FINAL REPORT
VULNERABILITY AND ADAPTATION
ASSESSMENT TO CLIMATE CHANGE IN
SEMARANG CITY
EXECUTIVE SUMMARY
In the future, a changing climate brought about by global warming is estimated to create new
patterns of risk, and higher risks generally. Sea level rise due to melting glaciers and polar ice
and thermal expansion will contribute to the increase of coastal flooding. Semarang as a coastal
city will be impacted seriously by climate change and sea level rise. At present, some of coastal
areas at Semarang are already inundated due to sea level rise. Floods and drought also occur
quite often. Government of Semarang City has implemented various program and also
developed medium and long-term strategies to manage hazards. Plan for improving
infrastructure for climate hazard control such as drainage system and dike has been prepared
(Bappeda, 2007). However, under changing climate with the increasing frequency and intensity
of extreme climate events the current design may not be very effective for managing future
climate hazards. Therefore it is also very important to consider climate change in designing
climate hazard control system.
ISET under the Asian Cities Climate Change Resilience Network (ACCCRN) with the support
from the Rockefeller Foundation, coordinate a study on vulnerability and adaptation assessment
to climate change conducted by MercyCorps, URDI and CCROM SEAP-IPB at Semarang City.
The study aims (i) to assess current and future climate variability in Semarang city, (ii) to assess
vulnerability and adaptive capacity as well as current and future climate risk at Kelurahan level,
(iii) to identify direct and indirect impact of climate hazards now and in the future at Kelurahan
level, (iv) to identify the most vulnerable areas and social groups, and dimensions of
vulnerability, including adaptive capacity of community to climate change impact, (v) to identify
institutional and governance issues that may affect the resilience of the city to current and future
climate risk, and (vi) to develop initial recommendations for Semarang City for increasing
resilience of the city to current and future climate risk
SEMARANG CITY PROFILE AND CLIMATE
The City of Semarang is the capital of Central Java Province with total administrative area of
about 374 km
2. Administrative boundaries of this area are Demak Regency (kabupaten) in the
east, Java Sea in the north, Kendal Regency in the west and Semarang Regency in the south. City
of Semarang is divided into 16 sub-districts (kecamatan) and 177 villlages (kelurahan). It is
located in Central Java’s north coast at 6.93
o– 7.13
olatitude and 110.27
o– 110.50
olongitude.
The topography of the coastal area is flat with elevation of less than 3.5 meters above m.s.l.
while in the south has topography with slope of between 2 and 40% and elevation of between 90
and 200 meters above msl. The rivers that flow in the City of Semarang include Garang, Kreo
and Kripik rivers. Fresh water some are taken from shallow ground water at the depth of 3-18 m
(lowland) and 20-40 m (highland), and from ground water stored in depressed aquifer layer at the
depth of 50-90 m from the surface.
this coastal area there are also several fishing activities, such as cultivation pond. Semarang City
also faced with problem of land subsidence.
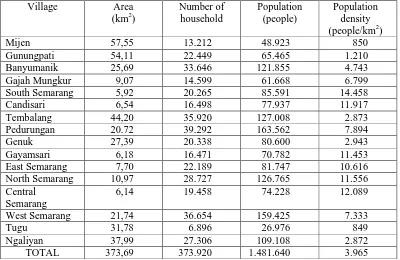
In 2008, the population of Semarang City is about 1.5 million people with growth rate of about
1.85% per annum. The densest is South Semarang sub-District with 14,458 people per km
2,
while the least dense is Mijen and Tugu Districts, i.e. about 850 people per km
2. The number of
population with productive age (15-64) in the City of Semarang is quite large, reaching 74% of
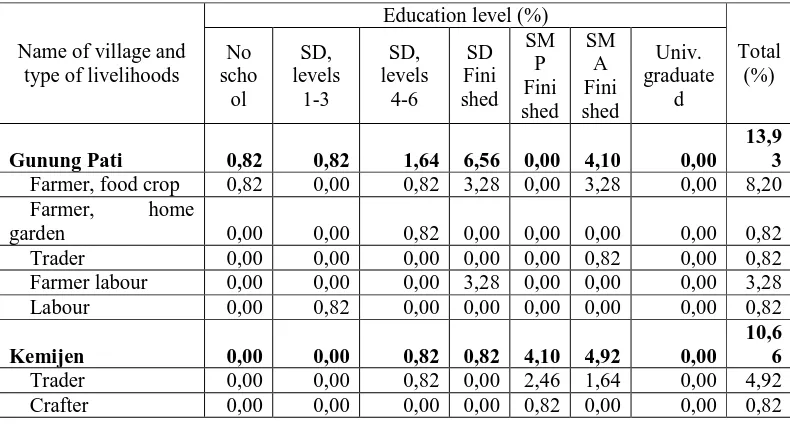
the total population. On the other hand, formal education level of residents in the village
observed is still relatively low. The percentage of residents who did not attend schools reaches as
much as 8.2%. While the number of people who did not complete elementary school and those
who complete elementary school is as much as 50.82%. Thus, approximately 59 % percent of
residents are in low level formal education structures. The number of residents who are junior
high school graduates is as much as 20.49%, high school graduates is as much as 18.03% and
university graduates is as much as 2.46%.
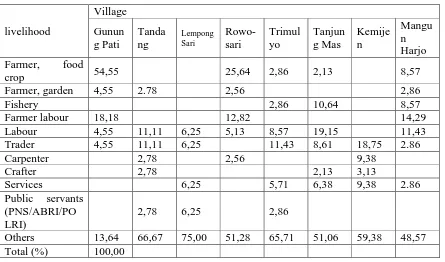
The main livelihoods of Semarang City are industrial workers (25.13%), construction workers
(13.05%), government employees/Armed Forces (16.04%), and other services (10.38%) and
farmers (4.8%). These livelihoods are the main contributor to the Gross Regional Domestic
Product (GRDP) in the City of Semarang. Gross Regional Domestic Product of the City of
Semarang (Table 2.8) is largely contributed by trade, hotel and restaurant (30.27%), followed by
industry (27.60%), buildings (14.76%), services (12.08%) and transportation and communication
(9.58%). Agriculture only contributes 1.25% to GDP.
Based on analysis to long historical climate data, it was found that there was a change in trend
and variability of climate variables such as temperature and rainfall. The most tangible evidence
can be seen from the increasing trend of mean surface temperature over the last 100 years in the
city. The change in seasonal rainfall was also found, i.e. a shift in the monsoon onset and a
change in the frequency of extreme rainfall. Based on 14 global climate models (GCMs), it was
indicated that wet season rainfall of Semarang City (DJF) in the future may be slightly lower
than current climate particularly in the center of the city. In contrast, the dry season (JJA)
rainfall might increase. However, the analysis of future climate may need to be refined using
climate models with high resolution such as RCM. The use of global model such as GCM will
not be able to capture the local effect. Further analysis on extreme weather under changing
climate should also be done. Many studies have shown that global warming will bring more
extreme events.
IMPACT OF EXTREME CLIMATE EVENTS
Floods and drought has change working relationship and transaction patterns of criminality. A
social relationship between people at the time of the disaster is still running well. The people
help each other during the disaster. However, in terms of working relationships the disasters
caused a change in pattern of working relationship. Many people have to find side-jobs to get
additional income, particularly when the disaster destroys their farming activities. Time is
becoming more precious for them. This condition gradually changes the working relationship,
initially was to help each other (for example replanting activities) and now this is transformed
into a pattern of wage payment system. In terms of the transaction patterns of production, the
disaster could encourage the development of the barter system (exchange of goods) as an
implication of the difficulty or lack of money held by the victims of the disaster. But on the other
hand, disasters also lead to increasing incidence of crimes such as theft.
Economic losses due to extreme climate events such as flood and drought can be evaluated from
their impact on main job, and prices of some commodities. The disasters reduce work
productivity especially if the main jobs of the society are vulnerable to disasters, such as the
agricultural, fisheries etc. The impact of flooding in coastal areas is reducing working people in
the fisheries sector, while in coastal areas; flood tides resulted in a decline in farmer incomes.
Based on the sectors of the economy, the impact of floods caused loss to the infrastructure sector,
housing and fisheries sectors. Meanwhile, drought caused losses in agriculture, fisheries and
drinking water. The disaster also caused an increase in prices of some agricultural products like
rice, crops and livestock, but this occurs only in the area surrounding the disaster.
Impact of disasters on health is the increase in number of people infected by diseases. Types of
diseases which often infect people during disaster are cough/cold /runny nose, fever, dengue,
diarrhea, itching, typhus, respiratory infection and asthma. Number of infected people by these
diseases was higher during floods season than during the drought.
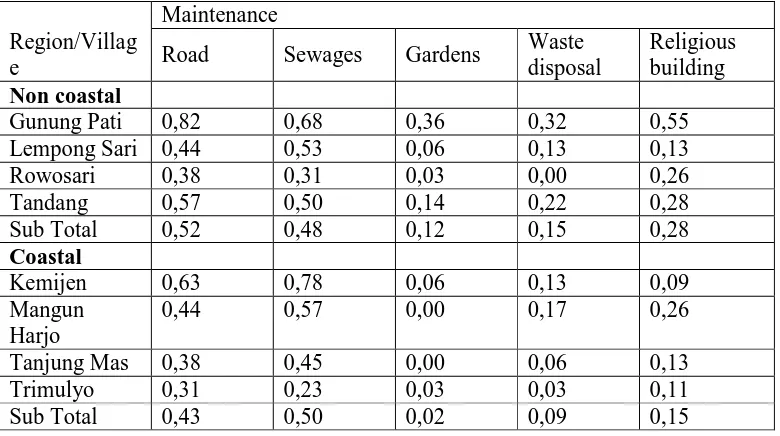
The impact of the disaster resulted in a change in behaviour as a form of adaptation. There is a
difference between adaptation measures undertaken by communities in coastal and non-coastal
during floods. To adapt to impact of robs (flood due to high tide), most communities in coastal
areas raise the floor level and build a dike. While communities in non-coastal areas also build a
dike, and some temporarily moved to other locations not affected by floods. During drought
season, to manage water scarcity problem, communities in coastal areas buy clean water,
whereas in non coastal region is by reducing water consumption.
and children who have grown up. This strategy is done in almost every village observed, both in
coastal areas and in non-coastal areas.
Communities expect that early warning system on disasters is in place. However, about 83% of
respondents stated that they did not get any information associated with the disaster from the
government. However, most of residents are aware of climate change. In general, they now
about climate change from television. Global warming will rise sea level, shift the seasons,
increase temperature, etc.
CLIMATE RISK LEVEL OF ‘KELURAHAN’
Level of risk of a system to a disaster or extreme climate event (ECE) will depend on capacity of
the system to cope with the events (called coping capacity index) and likelihood of the ECE to
occur. This study evaluated the level of climate risk at Kelurahan (village) level. The coping
capacity index is developed based on vulnerability and adaptive capacity index of the Kelurahan.
The vulnerability and capacity index of Kelurahan is measured using a number of
socio-economic and biophysical indicators. Kelurahan in which many of its household/ building
located in river bank, source of drinking water mostly not from PDAM (piping system), high
density population, many poor people and big portion of Kelurahan area near the river and
coastal with less green open area will be more vulnerable (high vulnerability index) than
Kelurahan with less household/building in the river bank, low population density, get better
services from PDAM, less poor people, and small portion of Kelurahan area near the river and
coastal with more green open area (low vulnerability index). The consequences (damage,
economic loss etc) caused by events will be severe in Kelurahan having high vulnerability index.
However, the consequence cased by the events in the high vulnerable Kelurahan would be less if
it has high adaptive capacity. Kelurahan with high adaptive capacity index is Kelurahan where
many of its households are well educated, main income source of communities not sensitive to
climate hazards (e.g. trading is much less sensitive than agriculture) and has better health facility
and road infrastructure. In this study, we normalized all the scores of the indicators in order to
have index of vulnerability and capacity range from 0 to 1.
Figure1. Classification of the villages based on their coping capacity index (quadrants 1 to 5)
and number of Kelurahan that are situated in each Quadrant at Current Condition (2005)
The analysis suggested that at present about 6% of Kelurahans have high coping capacity index
(Kelurahans with high vulnerability and low capacity index or at Quadrant 5), 38% in Quadrant
4, 27% in Quadrant 3, 3% in Quadrant 2 and 27% in Quadrant 1 (Kelurahan with low
vulnerability and high capacity index). Kelurahan at Quadrant 5 include Bandarhardjo,
Bengetayu Kulon, Bubakan, Gunung Pati, Kudu, Mangunsari, Ngadirgo, Penggaron Lor,
Podorejo and Wonoplumbon. In 2025 and 2050, one Kelurahan in Quadrant 5 will move to
Quadrant 4 indicating that there is an improvement of its coping capacity index. However,
coping capacity index of some Kelurahans in Quadrant 3 may change to Quadrant 4 in the future
(Figure 2). This suggests that coping capacity of these Kelurahans would decrease in the future
(Figure 3).
High Vulnerability Index
Low Vulnerability Index
High Capacity Index Low Capacity
Index
5
1 2
4
3
+0.25 +0.50
-0.50 -0.25
-0.50 -0.25 +0.25 +0.50
10
kelurahans
67
kelurahans
47
kelurahans
5 kelurahans
48
Figure 2. Number of Kelurahans according to the coping capacity index (quadrant 1-5) at
present and in the future (2025 and 2050)
To define level of risk of the Kelurahan to the impact of climate change was defined as a
function of the probability of unexpected (extreme) climate event to occur and the consequence
of the events if it occurs. As describe previously, we can expect that Kelurahans with high
vulnerability but low capacity indices (at quadrant 5) will be impacted more severe by the
extreme events than those with low vulnerability and high capacity indices (quadrant 1). Thus
we can define that the climate risk will be very high in Kelurahan at Quadrant 5 if probability of
the extreme climate events to occur in these Kelurahan is high. Climate risk will be very low in
Kelurahan at Quadrant 1 and the probability of the extreme climate events to occur in these
Kelurahan is also low.
To allow multiple climate hazards being accommodated in the climate risk assessment, we
developed composite climate hazard index (CCHI). The types of climate hazards include flood,
drought, landslides, and sea level rise. We classified the climate hazard index (index values
ranges from 0 to 4.5) into three categories, i.e. less than 2.0, between 2.0 and 3.5 and more than
3.5. Kelurahan with CCHI of 4.5 means that all area of this Kelurahan is exposed to flood and
drought, and land slide every year and it is completely inundated when robs occur. Kelurahan
with CCHI of zero means that none of the hazards occur in the Kelurahan. We used the rainfall
outputs from 14 general circulation models (GCM)
1run under high emission scenarios
(SRESA2) and low emission scenarios (SRESB1)
2.The study suggested that in 2005, the CCHI in most areas of Semarang City was mostly less than
2.0, and only a small portion of more than 2.0 which is situated in a small part of the northern
part of Semarang. In the future, A2 scenario, areas of index> 2 has decreased in 2025, but
increased slightly in 2050. Kelurahan with high CCHI both at present and in the future is
Kelurahan Tanjung Mas, Semarang Utara Sub-district.
Furthermore, we classified the level of climate risk of the Kelurahans based on their coping
capacity index and CCHI (Table 1). The climate risk maps of the Semarang City by Kelurahan
were produced by overlaying the coping capacity index map and CCHI under current and future
climate as shown in Figure 2.
Table 1. Matrix of Climate Risk according the coping capacity index and composite climate
hazard index
Coping Capacity
Index-Quadrant
Composite Climate Hazard Index (CCHI)
More than 3.5
Between 2.0 and 3.5
Less than 2.0
5
Very High (VH)
High (H)
Medium to High (M-H)
4
High (H)
Medium to High (M-H)
Medium (M)
3
Medium to High (M-H)
Medium (M)
Medium to Low (M-L)
2
Medium (M)
Medium to Low (M-L)
Low (L)
1
Medium to Low (M-L)
Low (L)
Very Low (VL)
1
General Circulation Model is a numerical representation of the climate system based on the physical, chemical and biological properties of its components, their interactions and feedback processes, and accounting for all or some of its known properties.
2
The result of analysis suggested that there are no Kelurahan with Very High (VH) Climate Risk
Category at present (baseline conditions). The highest category is only Medium to High (M-H).
There are about 15 Kelurahans (8%) with M-H risk category. These include Bandaharjo,
Bangetayu Kulon, Bubakan, Gunungpati, Kudu, Mangkang Kulon, Mangkang Wetan,
Mangunharjo, Mangunsari, Ngadirgo, Penggaron Lor, Podorejo, Tanjungmas, Tanjungmas,
Tugurejo, amd Wonoplumbon. The remaining are 63 Kelurahans (36%) as M (Medium) risk, 47
Kelurahan (27%) as L-M (Low to Medium) risk, 6 Kelurahans (3%) as L (Low) risk and 46
Kelurahans as VL (Very Low) risk. In the future (2025 and 2050), more Kelurahans will be
exposed to higher climate risk, particularly under scenario SRESA2 (Figure 5). There would be
two Kelurahans would move from M-H to High climate risk category, namely Mangunharjo
Village at Tugu Sub-District and Mangunharjo Village at Tembalang Sub-District. While many
of Kelurahans with L-M risk category would move to Medium risk category (Figure 6).
Figure 4. Number of Kelurahan by climate risk index category
Figure 5. Classification of Kelurahan based on their level of their exposure to climate risk (A)& (D) Climate risk baseline, (B)
Climate risk A2 2025, (C) Climate risk A2 2050, (E) Climate risk B1 2025, (F) Climate risk B1 2050
C
B
A
GOVERNANCE AND INSTITUTIONS
Governance and institutions are two determinant factors affecting the resilience of the city to climate change. Good governance and strong institutions will lead to climate change resilience city. There are three important aspects needs to be assessed to assess the resilience of the city to climate change. The first is how the stakeholders play their role in managing climate risk. The second is what are current initiatives and programs (short and long term) to cope with climate risks and how effective they are. Third is what is the capacity of local government and institutions to integrate climate change into short and long term development planing.
From the analysis it was revealed that the management of climate change in City of Semarang involve stakeholder both from internal and external of the city. Each stakeholder has their own roles and contribution to adapt and strengthen community to climate change. This partnership is a pre-condition to create community that has capacity to adapt to climate change. Overall, local government of Semarang plays the major roles in climate change both for financial support and implementing program. While the role of provincial government claims not too significant, but it has more roles in coordinating programs and policy from some cities. However, coordination among stakeholders and sectors should be strengthened in order to gain maximum benefits of the program to environment and community.
There are a number of programs and plans prepared by the government to address natural hazards in the city. The programs and plans were described in documents on development planning, spatial planning and disaster management. However there are some related problems with planning and programming facing by local government in Semarang in the light of addressing climate change. These problems include (i) lack of integration, coordination and vision-mission in climate change management, (ii) lack of budget allocation to support climate change, (iii) ineffective spatial planning to mitigate and adapt the impact of climate change, and (iv) no formal board or institution that formed to address local disaster.
Climate change management (adaptation and mitigation) is considered as new concept and not fully understood by all stakeholders at the local level. No special policies or programs related to climate change for both middle term (5 year plan) and long term (20 year plan) are issued. At present, even there are a number of local NGO’s and private sectors actively contribute to climate change related programs, however, the program are implemented partially with limited coordination among stakeholders.
Funding allocated to address climate change is also limited. Local government agency in charge with environmental issue received very low budget allocation. This agency will play significant role in improving environmental quality and contribute toward resilience city. Overall, each year budget for programs related to climate change has increased but far from enough to solve city problems. In last three years, local government only allocate 5-6 percent of its budget for program that related to climate change.
ii expose the city to higher climate risk in the future. Some problems that potentially cause the difficulty to implement climate proof spatial planning include inconsistency in the implementation of spatial planning, land use change such as areas along the river and others. Initial assessment conducted by this study to evaluate the level of climate risk at Kelurahan level at present and in the future should be considered in prioritizing programs and revising spatial plan.
Establishment of local disaster board as mandated by law no. 24/2007 is still underway. The presence of this board may be important to ensure the effective implementation of hazards and climate change programs by various stakeholders. It is planned that this board will be established in early year 2010. The role and function of this board in addressing climate change issues should be considered. The City Team3 should involve in the process of establishing the board.
Current capacity of local government in integrating climate change into long-term development planning is still limited. This can be understood as climate change is a complex issue. Strong scientific works on climate change scenarios and climate change impacts in Semarang City will be required to assist local government in developing horizon plan of adaptation4 to climate change. Technical assistance and capacity building program for local government officers is required to enable them in developing horizon plan of adaptation.
There are a number of good conditions that positively can contribute the process of developing resilience city to climate change. In the existing laws and policies, it is clearly mentioned that the planning document should consider disaster mitigation and adaptation and climate-change issue. The Semarang City Government will also formulate a new medium term development plan for 2011-2014 as resulted from the direct election which will be taken in April 2010. This is a good opportunity to integrate the climate change aspect into the document, so that it can be legally-binding. It needs political commitment and comprehensive understanding from the City Team to introduce the issues.
ADAPTATION ACTION PLANNING
To have resilience city to climate change, it is important to understand how people, community, and sectors response to current climate risk and how the current capacity should be developed to strengthen the capacity in managing future climate risk. Particular pilot projects may also be needed to get lesson learnt how we can effectively manage climate risk and use the lesson learnt to improve the climate change adaptation plan.
3
City Team is a team represented by various stakeholders from government bodies, academia and NGOs, community leaders being formed for formulating climate change programs for Semarang City as part of for Asian City Climate Change Resilience Network (ACCCRN) program funded by Rockefeller Foundation
4 Horizon plan of adaptation relates to the lifetime of decision-making associated with a particular
iii Based on study on the Community Based Vulnerability Assessment (CBA) in Kelurahan Tandang, Sukorejo, Mangunharjo and Kemijen, and also considering findings from surveys and literatures, we extract a number of lessons that may contribute in developing adaptation strategies. We learned some of the common qualities that seem to be present in the adaptation strategies at community levels: ♦ Quite simply ‘they work’: this is a very practical sense of adaptations that have
real bearing and effect on their everyday lives.
♦ They are inexpensive and work with what materials are available: for the urban poor, resources are scarce. They, for example, scavenged housing materials from a nearby scrap heap, or even community savings groups that collect very minimal amounts. These are what people can afford and that make sense to them.
♦ Accessible in times of need: In order to raise capital to recover from a flood a family may sell their television, motorbike or other fungible assets, rather than go through a bureaucratic process of applications that might imply lengthy paperwork. Generally in the city people want access to resources quickly and this is a very important characteristic of adaptation strategies that work, they are easily managed and accessed.
♦ They don't rely upon big government projects or interventions: People have developed reliance upon community organization and initiatives that better respond to their needs within their own means. While government intervention is appreciated and instrumental local self-reliance seems to be a key characteristic of adaptation strategies.
♦ Adaptation to severe climate events must work together with other adaptation strategies: Those most affected people by climate change may not know or care to plan for it if it doesn’t benefit other aspects of their lives. Safety for its own sake is not a motivating factor, but when other benefits can be derived then the solution becomes workable.
♦ The whole is greater than the sum of the parts: Many of the adaptation strategies are successful because they harness the collective efforts and strengths of people. People are concerned about each other and when this concern translates in collective action the results can be significant.
♦ Leveraging government support leads to better results: When communities are able to work together with local and city government (and vice versa) adaptation strategies seem to have been successful.
♦ More access to information can lead to better outcomes: Urban poor communities are usually isolated and so successful adaptation strategies seem to increase access to information.
iv Vulnerability Index, detailed maps for local neighbourhood government use, alternative social safety nets, and broad based coalition to deal with climate change issues).
Pilot projects are necessary to help local government to better understand how climate change will impact communities and sectors, how current capacity has to be strengthened and spatial plan to be improved to form climate change-resilience city and how to use the good lesson learnt from pilots in designing long term policies and strategies to address climate change. The City Team has facilitated a number of stakeholders to develop a number of pilot projects. The objectives of pilot implementation are (i) to prepare for climate change impact at the city level, (ii) to engage city level stakeholders (city government, NGOs, universities, CBOs, private sectors, community groups), (iii) to implement the pilot projects that test climate change resilience strategy, and (iv) to test the adaptive capacity of the community. For these pilot projects, the subject is vulnerable people who affected by climate change impact. The beneficiaries are women, children, elderly and men, both in terms of increased awareness, increase local capacity, influence local policy etc.
The activities of pilot project are also designed to meet the following criteria: (i) replicability, (ii) addressing current and future risks, (iii) benefit to local community, (iv) innovation, (v) collaboration, (vi) scalability, and (vii) sustainability strategy. There are some additional criteria that should be conducted by the implementer of pilot project: (i) implementation of pilot project has to be related to the local problems at local administrative or cross border administrative communities on issues of environment, health, education, social, economy in which related to the impact of climate change, and (ii) implementation of pilot project directed for adaptation and response effort activities to the impact of climate change, such as: erosion, flooding, drought, landslide, and etc.
There are four pilot projects being selected under the Asian Cities Climate Change Resilience Network (ACCCRN) for Semarang City. The projects include:
1. Land Arrangement Models In Sub District of Sukorejo, City of Semarang by State University of Semarang
2. Micro Finance Program: Community Based Revolving Fund for Improving Sanitation in Sub District of Kemijen, City of Semarang by Perkumpulan Perdikan (Local NGO)
3. Coastal Community Adaptation in Tapak Tugurejo as Resilience Community Coping Climate Change by BINTARI (Local NGO)
4. Adaptation to Cope Climate Change Impacts (Landslide and Cyclone) in Sub District of Tandang, City of Semarang by Centre of Planning and Public Participation
v
PREFACE
Indonesia has more than 17,000 islands, a coastline of more than 80,000 km, and the majority of population living in coastal zones where most of the country’s economic activity takes place. Indonesia is a country prone to natural disasters such as floods, droughts, storms, landslides, volcanic eruptions, and wild fires. In the future, a changing climate brought about by global warming is expected to create new patterns of risk, and higher risks generally.
Semarang is a coastal city which will be impacted by climate change and sea level rise. In the recent years, some locations in Semarang have been experiencing land subsidence. Some of coastal areas in Semarang City are already inundated due to high tides (rob). In these locations, there are many households that have low income and live in poverty; and they are highly vulnerable to the effects of environmental problems. City Government must take this into account seriously in developing its city development plan, while taking immediate actions response to immediate needs of the people in addressing their current problem. Therefore, Vulnerability and Adaptation Assessment to Climate Change in Semarang City was implemented and results of this assessment are presented in this report.
This report describe in detail: (i) characteristics of current and future climate of Semarang City, (ii) Impact of climate hazards and vulnerability of community to extreme climate events, and existing adaptive capacities, (iii) Maps of current and future vulnerabilities and capacity as well as climate risk at Kelurahan Level, (iv) Governance and institutional issues that may affect the effectiveness of the implementation of climate change programs, (v) Initial recommendations for increasing resilience of the City to current and future climate risk, and (vi) Recommendation on types of pilot projects for increasing communities’ resilience to the impact of climate change.
The study was supported by many institutions. Institute for Social and Environmental Transition (ISET) is managing the Asian Cities Climate Change Resilience Network (ACCRN) as part of the overall Rockefeller Foundation Climate Change Initiative. MercyCorp assists ISET in implementing the ACCRN program in Semarang City in collaboration with Local Government (City Team), Urban and Regional Development Institute (URDI), Centre for Climate Risk and Opportunity Management in South East Asia and Pacific (CCROM SEAP) Bogor Agriculture University, local institutions, local communities, and local NGOs. Their supports during the implementation of the study are paramount and highly appreciated.
vi
Table of Contents
EXECUTIVE SUMMARY .... 2
PREFACE .... v
Table of Contents ... vi
List of Figures . viii List of Tables .... x
Chapter 1 INTRODUCTION .... 1
1.1 Background ... 1
1.2 Objectives ... 2
1.3 Outputs ... 2
Chapter 2 BRIEF DESCRIPTION OF SEMARANG CITY PROFILE AND CONDITION OF RESPONDENCE .... 3
2.1 Geographical Location and Context ... 3
2.2 Municipal Administration ... 5
2.3 Resource Base ... 5
2.3.1 Water resources ... 5
2.3.2 Coastal areas ... 6
2.3.3 Water resources ... 7
2.4 Position of Semarang City in Regional Context ... 9
2.4.1 Pattern of regional development and function of the City ... 9
2.4.2 Conservation areas ... 9
2.4.3 Utilization of areas ... 10
2.4.4 Strategic and priority regions... 10
2.4.5 Plan of Green Zone Determination ... 11
2.5 Demographic Conditions and Social Context ... 12
2.5.1 Population and population density... 12
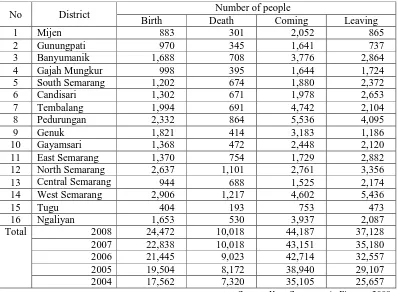
2.5.2 Population growth and Migration ... 14
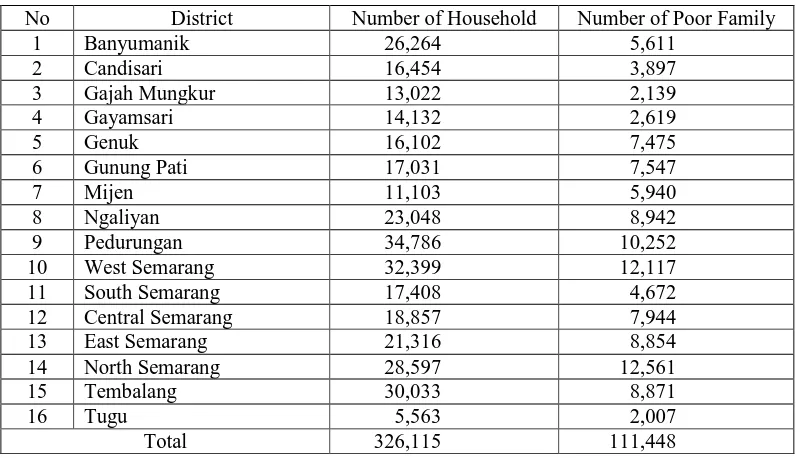
2.5.3 Number of poor families ... 14
2.5.4 Education ... 14
2.6 Economy and Livelihood ... 15
2.7 Respondent Profiles ... 16
2.7.1 Social Context ... 16
2.7.2 Economic and Livelihoods ... 25
Chapter 3 CLIMATE HISTORY AND FUTURES IN SEMARANG CITY .. 35
3.1 Extreme Climate and Weather Events ... 35
3.1.1 The influences of ENSO and IOD on rainfall variability over the Semarang City ... 35
3.1.2 Extreme wind ... 36
3.2 Trends of Historical Climate in Semarang ... 37
3.2.1 Rainfall ... 37
3.2.2 Temperature ... 41
3.3 Climate Change Projections ... 42
Chapter 4 IMPACT OF EXTREME CLIMATE EVENTS .. 48
4.1 Biophysical Impact of Extreme Climate Events ... 48
4.2 Socio-Economic Impact of Extreme Climate Events ... 49
vii
4.2.2 Economic impact ... 51
4.2.3 Health ... 55
4.2.4 Coastal ... 56
4.3 Government Community Responses to Extreme Climate hazards ... 56
4.3.1 Residents’ response towards the existence of disaster handling institutions... 56
4.3.2 Community’s Response Towards Disaster Information ... 56
4.3.3 Availability of disaster information ... 57
4.3.4 Disaster Information Sources ... 58
4.3.5 Forms of community adaptation ... 59
4.3.6 Assistance expected by residents ... 64
4.3.7 Identification of adaptation activities from the government that have been implemented by the community ... 67
Chapter 5 VULNERABILITY AND ADAPTIVE CAPACITY MAPPING .. 68
5.1 Methodology for Vulnerability and Adaptive Capacity Mapping ... 68
5.2 Classification of Kelurahan (Villages) Based on Vulnerability and Capacity ... 72
Chapter 6 CLIMATE RISK ANALYSIS .. 76
6.1 Methodology for Climate Risk Mapping ... 76
6.2 Classification of Kelurahan (Villages) Based on Level of Their Exposure to Climate Risk ... 80
Chapter 7 GOVERNANCE AND INSTITUTIONAL SYSTEM .. 85
7.1 Roles of Stakeholders and Existing Programs in Delivery and Management of Key Climate-Affected Sectors ... 85
7.1.1 Role of stakeholder in flood and rob management ... 85
7.1.2 Role of stakeholder in water and sanitation ... 87
7.1.3 Stakeholder analysis ... 87
7.2 Assessment of effectiveness of current initiatives and programs (short and long term) cope with future climate risks ... 91
7.3 Assessment of Local Government Capacity and Institutional to Integrate Climate Change into Development Planning ... 97
Chapter 8 ADAPTATION ACTION PLANNING 100 8.1 Adaptation Strategies ... 100
8.2 Lessons Learned from the Communities ... 103
8.3 Pilot Project in Semarang as Adaptation Action Planning ... 104
8.4 Adaptation and Resilience ... 106
8.5 Specific Ideas to Strengthen Adaptive Capacity ... 107
viii
List of Figures
Figure 2.1: The Position of Semarang City and Its Surrounding Areas (Source: Google Earth, 2009 and Image of Landsat ETM+, 2001). ... 4
Figure 2.2: Semarang City Slope Map. ... 4
Figure 2.3: City of Semarang Administrative Map (Source: http://www.semarangkota.go.id). ... 5
Figure 2.4: The Rate Of Land Subsidence In Semarang City: ... 6
Figure 2.5: Distribution of Inundation Area in Semarang City (Source: http://www.semarangkota.go.id)The Rate of Land Subsidence in Semarang City ... 7
Figure 2.6: Distribution of Land Use/Land Cover in Semarang City In ... 8
Figure 2.7: The Amount of Water Consumption by Residents in the Observed Villages, 2009 (%) ... 24
Figure 2.8: Water Quality According Residents in Various Areas of Semarang City, 2009. ... 25
Figure 2.9: Distribution of Resident’s Income in the Observed Villages in Semarang, 2009, ... 29
Figure 2.10: Residents’ Access to Banking and Insurance in the Observed Villages, 2009 ... 32
Figure 3.1: Series of seasonal rainfall over Semarang ... 36
Figure 3.2: Daily wind speed in two stations over Semarang city, a) Semarang station, b) Ahmad Yani station, and c) average of both stations (1 January 1994 – 31 December 1999). ... 37
Figure 3.3: Observed seasonal rainfall over Semarang averaged from five rain gauge ... 38
Figure 3.4: Spatial patterns of seasonal rainfall trends over Semarang. ... 38
Figure 3.5: Trends of seasonal rainfall in Semarang city (110.25E-110.51E, 7.12S-6.95S) extracted from CRU TS2.0 dataset ... 39
Figure 3.6: Trends of seasonal wet days frequency in Semarang city (110.25E-110.51E, 7.12S-6.95S) extracted from CRU TS2.0 dataset ... 40
Figure 3.7: Low-frequency component of seasonal rainfall in Semarang defined by a simple 13-year moving average ... 41
Figure 3.8: Trends of seasonal mean temperature in Semarang city (110.25E-110.51E, 7.12S-6.95S) extracted from CRU TS2.0 dataset ... 41
Figure 3.9: Trends of seasonal daily maximum temperature in Semarang city (110.25E-110.51E, 7.12S-6.95S) extracted from CRU TS2.0 dataset. ... 42
Figure 3.10: Trends of seasonal daily temperature range in Semarang city (110.25E-110.51E, 7.12S-6.95S) extracted from CRU TS2.0 dataset. ... 42
ix
Figure 4.1.Price Increase in Some Agricultural Commodities in Semarang City During Flood and Drought ... 54
Figure 4.2.Residents’ Response Towards The Use of News in Observed Villages in Semarang City based on Gender (%) ... 57
Figure 4.3:Residents’ Perception About Times of Water Shortages ... 61
Figure 5.1: Coastal area which is affected by tide + 100 m ... 71
Figure 5.2:. Determination of the highest order stream (A) & estimation of the wide of its water surge (B) ... 72
Figure 5.3: Classification of the villages based on their coping capacity index (Quadrant 1-5) ... 73
Figure 5.4: Current and Future vulnerability and Capacity indices of Kelurahan of Semarang City Baseline, (B) 2025, (C) 2050 ... 74
Figure 5.5:. Number of Kelurahans according to the coping capacity index (quadrant 1-5) at present and in the future (2025 and 2050) ... 75
Figure 5.6:. Coping Capacity Index of Kelurahans at Semarang city ... 75
Figure 6.1:Box plot of monthly rainfall in wet season during flood and no-flood years ... 78
Figure 6.2:Comparison between monthly rainfall during drought and no drought events. ... 78
Figure 6.3:Empirical Cumulative Distribution Functions (eCDF) and Scaled Density Function of observed rainfall over Semarang and the threshold of having flood. .... 79
Figure 6.4:Distribution of flood affected area. ... 79
Figure 6.5:Scatter plot of relationship between monthly rainfall and flood affected area. ... 80
Figure 6.6:Composite Climate Hazard Index of Semarang City ... 81
Figure 6.7:. Number of Kelurahan by climate risk index category ... 82
Figure 6.8:Classification of Kelurahan based on their level of their exposure to climate risk ... 84
x
List of Tables
Table 2.1: Use of Land in Semarang City in 2005 ... 8
Table 2.2: Development Plan of Semarang-Demak Regions ... 9
Table 2.3: Types of Utilization of Areas in Semarang City According To RT/RW in Central Java Province (Central Java Province Regulation No.23/2003) ... 11
Table 2.4: Female and Male Population in Semarang City in 2008 ... 13
Table 2.5: Area, Number of Households, Total Population and Population Density in Semarang City in 2008 ... 13
Table 2.6: Population Growth Based on Natural and Non-natural Factors in 2008 14 Table 2.7: The Number of Poor Families in Semarang, 2008 ... 15
Table 2.8: Gross Regional Domestic Product According Type of Business Based on Prevailing Price Rate in 2007 – 2008 ... 16
Table 2.9: Distribution of Education Level and Types of Livelihoods in the Observed Villages (%) ... 17
Table 2.10: Family Members Participating In Family Decision Making in the Observed Villages, 2009 (%) ... 19
Table 2.11: Family Member Participation in Training in the Observed Villages, 2009 (%) ... 20
Table 2.12: Distribution of Residents Based on Family Member Participation in Community Organizations (%) ... 21
Table 2.13: Residents Participation in Social Community Activities Villages, 2009 (%) ... 22
Table 2.14: Residents’ Participation in Various Public Facility Maintenance in the Observed Villages, 2009 (%) ... 23
Table 2.15: Distribution of Livelihoods in the Observed Villages, 2009 (%) ... 26
Table 2.16: Distribution of Family Members Making a Living in the Observed Villages, 2009 (%) ... 28
Table 2.17: The Average Percentage of Alternative and Main Income towards the Residents’ Total Income in the Observed Villages, 2009. ... 30
Table 2.18: The Average Building and Land Sizes in the Observed Villages, 2009 . 31 Table 2.19: Type of Walls Owned by Residents in the Observed Villages, 2009 (%) 31 Table 2.20: Type of Walls Owned ... 32
Table 3.1: Correlations between seasonal rainfall over Semarang city with DMI and with Nino3.4 SST anomaly ... 35
Table 3.2: Mann-Kandal Test for Detecting Trend ... 38
Table 3.3:. Gas Concentrations (ppmv) ... 44
Table 3.4 Temperature (oC) and Sea Level Rise (cm), with reference to 1990 ... 44
xi
Table 4.2: Disaster Impact on Residents’ Social Values in the Observed Villages in Semarang City, ... 50
Table 4.3: Amount of Freshwater/Fishpond Fisheries Production in 1997 and 2006 (Ton) ... 51
Table 4.4: Amount of Loss in Main Jobs Due To Disaster in Semarang City ... 52
Table 4.5: Amount of Loss in Fishpond Business Due To Disaster in Semarang City
... 52
Table 4.6: The number of fishermen, fishpond farmers, and fish sellers in Semarang City, 1997 and 2006 ... 53
Table 4.7: Amount of Loss (Rp) Due to Flood in Semarang City Based on Sectors 53
Table 4.8: Amount of Loss Due to Drought in Semarang City Based on Sector ... 54
Table 4.9: Residents’ Ditribution based on types of diseases During Flood in observed Villages (%) ... 55
Table 4.10: Residents’ Distribution Based on Types of Diseases During Drought in Observed Villages (%) ... 55
Table 4.11: Residents’ Response towards The Use of General Information and Information Relating to Disaster in Observed Villages in Semarang City, 2009 ( %)
... 57
Table 4.12: Distribution of The Average Value of Information Availability in Semarang City, 2009 ... 58
Table 4.13:. Sources of Disaster Warning Information in Semarang City (%) ... 59
Table 4.14:. Index Value of Forms of Adaptation During Flood in Semarang City . 60
Table 4.15:. Index Value of Forms of Adaptation During Drought in Semarang City
... 60
Table 4.16:. Sources of Water During Rainy Season in Semarang City ... 61
Table 4.17:. Sources of Water During Drought in Semarang City ... 62
Table 4.18:.Residents’ Efforts in Handling Problems Caused by Disaster in Observed Villages in Semarang City, 2009 ... 64
Table 4.19:. Government activities in improving disaster-handling capacity that is non-structural and community response ... 67
Table 5.1:..Indicators used for defining Vulnerability and Capacity and the corresponding weights ... 68
Table 5.2:..Indicator value according to types of main income source of community in the village ... 69
Table 6.1:.. Matrix of risk as a function of probability of unexpected event to occur and the consequences if the unexpected events occur... 76
Table 6.2: Weight and formula for calculating climate hazards index ... 77
Table 6.3:..Matrix of Climate Risk according the coping capacity index and composite climate hazard index ... 77
xii
Table 7.2:Stakeholder Roles and Contributions for Climate Change ... 87
Table 7.3: Allocation of budget in each sector for implementing Climate Change related program ... 95
Table 7.4:Budget Percentage Related to CC in Semarang City ... 95
Table 7.5:Bintari’s Programs ... 96
Table 7.6: Assessment of Local Government and Institutional Capacity to Integrate Climate Change into Development Planning... 98
Table 8.1: Pilot project in Semarang ... 110
1
Chapter 1
INTRODUCTION
1.1
Background
In the future, a changing climate brought about by global warming is estimated to create new patterns of risk, and higher risks generally. Sea level rise due to melting glaciers and polar ice and thermal expansion will contribute to the increase of coastal flooding. Increasing intensity of tropical cyclones observed in recent decades may be tied to increasing sea surface temperatures. By impacting the hydrologic cycle, global warming is expected to alter climatic ranges, shift regional climatic averages, resulting in shifting of climate zones, and lead to a higher frequency and amplitude of weather events. Climate variability and change occurring against a backdrop of increasing global population and globalization of economic processes may be expected to lead to increased competition over resources and new vulnerabilities. With the increase of climate risk, many countries, particularly least developed and developing countries may have difficulties to achieve the Millennium Development Goals related to poverty, hunger and human health.
Indonesia is a country already prone to natural disasters such as floods, droughts, storms, landslides, volcanic eruptions, and wild fires. Indonesia has experienced more frequent and severe climate-related hazards in recent years. Floods and windstorms accounted for 70% of total disasters and the remaining 30% of the total disasters are accounted for by droughts, landslides, forest fires, heat waves, storm,
robs (flood due to high tides) and others. Within the period of 2003-2005 alone, there
were about 1,429 disaster incidences in Indonesia. About 53.3 percent were hydro-meteorological disasters (Bappenas and Bakornas PB, 2006)
Rising sea levels pose a further risk. Approximately 24 small islands in Indonesian are already submerged (Ministry of Marine Affairs and Fisheries, 2007). This vast archipelago is extremely vulnerable to sea level rise with over 17,000 islands, a coastline of more than 80,000 km, and the population majority living in coastal zones where most of the country’s economic activity takes place. Currently, around 42 million people in Indonesia live in areas less than 10 meters above the average sea level (Government of Indonesia, 2007). Most of households living in the coastal area has an income of between the US$2 and US$1-a-day poverty lines (Indonesia Poverty Analysis Program, 2006), far too many Indonesians live in poverty and remain highly vulnerable to the effects of climate change. The high population densities of Indonesia will further increase its sensitivity to climate hazards.
2 effective for managing future climate hazards. Therefore it is also very important to consider climate change in designing climate hazard control system.
1.2
Objectives
This study was aimed
• To asses current and future climate variability in Semarang city
• To assess vulnerability and adaptive capacity as well as current and future
climate risk at Kelurahan (villages) Level
• To identify direct and indirect impact of climate hazards now and in the future at
Kelurahan level.
• To identify the most vulnerable areas and social groups, and dimensions of
vulnerability, including adaptive capacity of community to climate change impact
• To identify institutional and governance issues that may affect the resilience of the city to current and future climate risk.
• To develop initial recommendations for Semarang City for increasing resilience
of the city to current and future climate risk
1.3
Outputs
The final outputs of this work will be a report describing
• Characteristics of current and future climate of Semarang City
• Impact of climate hazards and vulnerability of community to extreme climate
events, and existing adaptive capacities
• Maps of current and future vulnerabilities and capacity as well as climate risk at
Kelurahan Level
• Governance and institutional issues that may affect the effectiveness of the
implementation of climate change programs
• Initial recommendations for increasing resilience of the City to current and future
climate risk.
• Recommendation on types of pilot projects for increasing communities’
3
Chapter 2
BRIEF DESCRIPTION OF
SEMARANG CITY PROFILE AND
CONDITION OF RESPONDENCE
2.1
Geographical Location and Context
The City of Semarang is the capital of Central Java Province. Semarang’s
geographical condition (Figure 2.1) is located in Central Java’s north coast at 6.93o –
7.13o latitude and 110.27o – 110.50o longitude. And its size reaches 37,366,838 ha or
373,7 km2. Administrative boundaries of this area are Demak Regency (kabupaten)
in the east, Java Sea in the north, Kendal Regency in the west and Semarang Regency in the south. The City of Semarang has a flat to hilly topography (Figure 2.2); flat topography is in coastal areas with 0-2% slope and elevation less than 3.5 meters above mean sea level (msl), while hilly topography is in the south of the flat topography with 2-40% slope and 90-200 meters above msl elevation.
(http://www.semarangkota.go.id).
The geographical position of Semarang City in Central Java development corridor is a node of four gateways, which are north corridor of Coastal/Sea, south corridor towards dynamic cities such as Regencies of Magelang and Surakarta which is known as Merapi-Merbabu corridor, east corridor towards Demak/Grobogan Regencies, and west corridor towards Kendal Regency. In the development and growth of Central Java, Semarang City plays an important role, especially with its ports, land transportation networks (rails and roads) as well as air transportation, which is a potential for transport node and transit City of Central Java Region. Another position that is not less important is the strength of the relationship with areas outside Java, directly as central part of national territory in the middle. (http://www.semarangkota.go.id).
Figure 2.1: The Positio Google Earth, 2009 and
F
ition of Semarang City and Its Surrounding Ar nd Image of Landsat ETM+, 2001).
Figure 2.2: Semarang City Slope Map.
4
5
2.2
Municipal Administration
Administratively City of Semarang is divided into 16 districts (kecamatan) and 177 villlages (kelurahan). Those districts are: 1. West Semarang District, 2. East Semarang District, 3. Central Semarang District, 4. North Semarang District, 5. South Semarang District, 6. Candisari District, 7. Gajahmungkur District, 8. Gayamsari District, 9. Pedurungan District, 10. Genuk District, 11. Tembalang District, 12. Banyumanik District, 13. Gunungpati District, 14. Mijen District, 15. Ngaliyan District, 16. Tugu District. (Figure 2.3).
Figure 2.3: City of Semarang Administrative Map (Source: http://www.semarangkota.go.id).
2.3
Resource Base
2.3.1
Water resources
6 Shallow ground water in the area of Semarang City is at the depth of 3-18 m (lowland) and 20-40 m (highland). Shallow ground water quantity is strongly influenced by the seasons and the surrounding environment. In addition to the shallow ground water the residents also use deep ground water, which is ground water stored in depressed aquifer layer. The depth of this layer is at 50-90 m from the surface and the location of the aquifer is in the northeast of Semarang City and at the mouth of old Garang River located in the confluence of Garang river valley and coastal plains (Government of Semarang City, 2009).
2.3.2
Coastal areas
City of Semarang is a port city that is important for Java. Based on the location and shape of coastal physiographic, Semarang Harbour city is located in an open coastal plain. In open coastal plains, high waves resulted from strong winds may hit coastal plains easier. In some coastal plains, rob (flooding associated with high tides) phenomenon has been observed that can disrupt resident’s economic activities.
The northern part of Semarang City is bordered by Java Sea. Centre of economic activities in the coastal areas of Semarang City, are among others focused in the area of Tanjung Mas Port. In this coastal area there are also several fishing activities, such as cultivation pond.
In Semarang City also faced with problem of land subsidence. One of the triggering factors of the problem is the high population growth. The growing population will result in increased consumption of ground water. As a result there is decrease in hydraulic pressure in the soil layer that will be followed by decrease in soil surface. This condition will get worse if there is additional load on the surface such as settlements or other building areas. Georisk Project (cooperation between Indonesia and German Geological Agency) has conducted a research to determine the rate of land subsidence in the area of Semarang City. The data of PSI (Persistent Scattered Inferometry) in 2002 to 2006 has been used by the Project to build Georisk maps or spatial distribution of the rate of land subsidence in Semarang City. The rate of land subsidence in this region is between 0-1 cm/year and 8-9 cm/year (see Figure 2.4.)
7 The highest rate of land subsidence (8-9 cm/year) covers most of North Semarang district and Genuk District, while the lowest (0-1 cm/year) are in some parts of Tugu District, central part of West Semarang District, and southern parts of the following four districts, namely Central and East Semarang, Gayamsari and Padurungan.
Some areas near the coast which has low elevation are susceptible to water inundation caused by rob; while the regions far enough from the coast are susceptible to water inundation due to water overflow as drainage system in the area is inadequate. The distribution of water inundation in Semarang City area can be seen in Figure 2.5.
Figure 2.5: Distribution of Inundation Area in Semarang City (Source: http://www.semarangkota.go.id)The Rate of Land Subsidence in Semarang City
2.3.3
Water resources
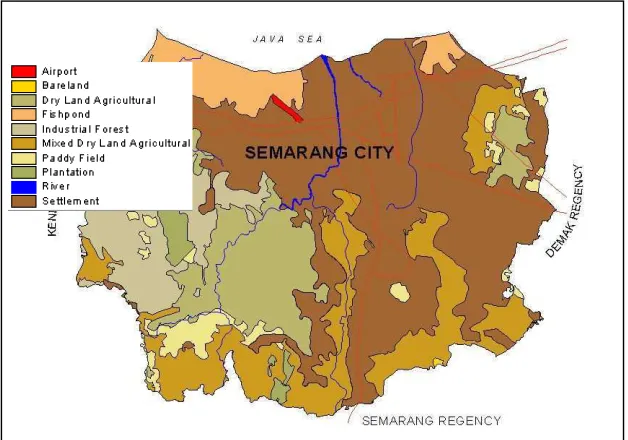
Land area is the area for many sectors such as residential, industrial, trade and services, green open land, and agricultural land. The largest percentage of land use/land cover in the City of Semarang is settlement and the smallest is bare land. The distribution of the settlement is to the north, east and south (Figure 2.6). The western part is dominated by land use for dry land agriculture and forest plants. Because the north, east and south side of this city are highly occupied with settlements, then in the coming years it is predicted that settlement development will shift to the west. As a result, land use for forest plants and dry land agriculture may will be converted to settlements or other land use that supports the settlement
8 trends in the development of the future is increasing number of built land (Source: Regional Development Planning Agency of Semarang City, 2009/Semarang City RT/RW draft document, 2010-2030)
Figure 2.6: Distribution of Land Use/Land Cover in Semarang City In
Table 2.1 informs that the largest land use is dry land use. This is a reasonable; given the City of Semarang is the capital of Central Java Province that has urban hierarchy as a prime city in Central Java scope. Thus, the City of Semarang is an area with very high urban level. This is supported by the position of Semarang City that is in the regional route node of Jakarta-Surabaya and south route to Surakarta and Yogyakarta (Source: Regional Development Planning Agency of Semarang City, 2009/Semarang City RT/RW draft document, 2010-2030).
Table 2.1: Use of Land in Semarang City in 2005
No District Paddy
field
Dry lands
Total Building Garden Grassland Swamp Fish pond Forest Others
1 Mijen 1.008,89 822,88 1.715,79 0,00 0,00 17,34 809,70 611,52 4.986,12
2 Gunungpati 1.382,00 1.313,00 2.180,37 0,00 0,00 0,00 0,00 125,08 5.000,45
3 Banyumanik 95,00 430,00 379,58 614,00 0,00 0,00 0,00 811,48 2.330,06
4 Gajahmungkur 0,00 691,63 2,97 0,00 0,00 0,00 0,00 54,27 748,87
5 S.Semarang 0,00 473,39 2,50 0,00 0,00 0,00 0,00 371,16 847,05
6 Candisari 0,00 494,39 19,98 13,87 0,00 0,00 0,00 1,02 529,26
7 Tembalang 432,00 2.085,40 800,80 0,00 0,00 0,00 0,00 623,84 3.942,04
8 Pedurungan 64,00 1.507,00 356,00 0,00 394,19 0,00 0,00 113,00 2.434,19
9 Genuk 94,00 1.118,71 890,14 0,00 0,00 208,40 0,00 0,00 2.311,25
10 Gayamsari 19,50 420,89 0,00 13,75 0,00 11,09 0,00 49,50 514,73
11 E. Semarang 0,00 696,80 0,00 0,00 0,00 0,00 0,00 73,45 770,25
12 N. Semarang 0,00 979,33 0,00 0,00 0,00 9,43 0,00 144,51 1.133,27
13 C. Semarang 0,00 527,55 5,48 0,00 0,00 0,00 0,00 66,53 599,56
14 W. Semarang 18,57 1.389,20 8,20 0,00 0,00 52,66 0,00 899,07 2.367,70
15 Tugu 460,00 507,73 30,20 0,00 0,00 1.579,00 0,00 53,52 2.630,45
16 Ngaliyan 324,00 418,00 469,00 10,00 0,00 0,00 706,00 817,84 2.744,84
9
2.4
Position of Semarang City in Regional Context
The descriptions in Section 2.4 are quoted from Regional Development Planning Agency of Semarang City, 2009/Semarang City RT/RW draft document, 2010-2030.
2.4.1
Pattern of regional development and function of the City
Based on RTRWN regarding regional development and function of the city, Semarang City area is in the development plan of regions of Semarang - Demak as shown in Table 2.2.
Table 2.2: Development Plan of Semarang-Demak Regions
Land Area Related Sea Area Areas In Land Area National City
Function
Source: Government Regulation No 47 Year 1997. Notes: Local Activity Center (PKL), Area Activity Center (PKW), National Activity Center (PKN)
2.4.2
Conservation areas
Conservation areas are areas whose main function are to protect the environmental sustainability that covers natural resources, man-made resources, historical value and culture for the interest of sustainable development.
Conservation areas in Semarang City include:
1. Conservation areas that protect sub areas
2. Local conservation areas that include coastal border, river bank, areas around
lakes/reservoirs, and areas around springs;
− River border
− Coastal border
− Areas around lakes/reservoirs
− Areas around springs
3. Disaster prone areas
• Rob/flood prone areas
10 In the area of Semarang City, areas potential to be flood prone areas include part of Districts of Tugu, West Semarang, Central Semarang, North Semarang, and Genuk.
• Prone to landslides and land movement
Prone to landslides and land movement areas are areas that have a vulnerability to natural disasters of landslides and soil movement. Prone to landslides area are areas that have slopes of more than 40%, which can be found in some location in Districts of Gajahmungkur, Candisari, Tembalang, Banyumanik, Gunungpati, Mijen, and Ngaliyan
Areas that are prone to soil movement are in Gunungpati, and Banyumanik Districts. Based on its geological conditions this area is potential to land movements. Active fault areas, which are areas geologically have fault prone to land movements. The locations of these areas are:
• Along the Mijen and Gunungpati Districts, through Villages of Sumurejo,
Mangunsari, Gunungpati, Purwosari, Limbangan, and Cangkiran.
• Along Banyumanik District, through Villages of Jabungan, Padangsari,
Plalangan, Sumurboto, and Tinjomoyo.
• Gunungpati Districts, through Villages of Sukorejo, Kalipancur and
Bambankerep
4. Culture conservation areas
2.4.3
Utilization of areas
The utilization of areas in the provincial level is in the form of space utilization for various activities. The utilization should consider (a) the conditions of existing city planning, natural resources and man-made resources, human resources, socio-economic and the environment; (b) development objectives and (c) regional spatial planning objectives. Types of utilization of areas in the City of Semarang can be seen in Table 2.3.
2.4.4
Strategic and priority regions
Areas in the administration of Central Java Province can be classified into strategic and priority areas. These area are:
1. Strategic regions
a. Mainstay region (kawasan andalan); One of the mainstay region in Central
Java is Kedungsapur (Kendal, Demak, Ungaran, Salatiga, Semarang, Purwodadi)
b. Strategic development region which is potential for the development of
national service.
11 upgraded to be secondary main port as the container of activity overflow from port of Tanjung Priok or Port of Tanjung Perak is one of the strong considerations for the development of this area.
2. Priority regions
a. Kedungsapur region is included in provincial strategic rgional cooperation. The
development strategy for this region is intra regional as a distribution center for products from hinterland because it is around the route of north coast and inter regional and national as transit location of trade and services from west and east Java and from other islands especially Kalimantan.
b. Province border cooperation region. Kedungsapur region is included in
Joglosemar (Jogjakarta, Solo dan Semarang) regional cooperation between Central Java and Jogjakarta.
c. Region of conservation and protection againts disasters. Included in this region is
the Kaligarang watershed area (DAS). The management of Kaligarang watershed area is done mainly in order to address the problems of flooding and environmental hazards that occur in other areas around the watershed through improving the water resistance and accelerating the drainage process into the sea. As a watershed area, the handling is integrated by considering the administrative, ecological, economic, social and physical aspects in the areas located along the river path.
Table 2.3: Types of Utilization of Areas in Semarang City According To RT/RW in Central Java Province (Central Java Province Regulation No.23/2003)
NO Type of activity Remarks
1 Tourism area Semarang City is part of development area B
This area is more varied with several attraction themes, namely maritime, culture and mountain. This area covers the corridor of Demak-Kudus-Jepara and corridor of Semarang-Ambarawa-Wonosobo. Objects in this development area are: Cultural tourism objects in Semarang, Karimunjawa Islands, Great Mosque of Demak, Kudus Mosque and Kretek Museum, Dieng Highland
2 Industrial area Tugu industrial area, Genuk industrial area
There is a need in the area of Central Java Province of integrated zone integrated to port area (outlet), which is Port of Tanjung Emas Semarang and Port of Tanjung Intan Cilacap, to improve industrial commodity export.
3 Settlement area The growth of settlement in Semarang City is classified into settlement prone to problems (environmental conflict)
Source: RTRW in Central Java