1
Institute for Social and Environmental Transition www.i-s-e-t.org
Semarang Climate Change Resilience Strategy, Indonesia
June 2011
The attached report is the Semarang Climate Change Resilience Strategy, produced by the
Semarang ACCCRN City Team and led by the Semarang Climate Working Group with
support from National partner Mercy Corps. Supporting analyses were completed by
CCROM, DPK and URDI. The strategy was completed in August 2010. It was produced
during the city engagement phase of the Rockefeller Foundation Asian Cities Climate
Change Resilience Network (ACCCRN) program. This document represents the culmination
of the engagement work.
The Semarang Climate Change Resilience Strategy is the work of the Indonesian ACCCRN
partners, and is presented here in translation, the original having been prepared in Bahasa
Indonesia and translated into English by the Semarang partners and Mercy Corps. The
views in the paper represent the knowledge and opinions of the authors. In these cover
pages we discuss the relevance of the document in the context of ACCCRN, what we have
seen the city learn as a result of its preparation, and how we anticipate it will be used in the
future. These observations are )SET’sand may differ f
rom those of other ACCCRN partners.
Introduction to ACCCRN
The Asian Cities Climate Change Resilience Network (ACCCRN) is an innovative program
that helps mid-sized cities in South and South East Asia build resilience to climate change.
Rockefeller Foundation launched the program in 2008. The Rockefeller Foundation and
ACCCRN partners work together to conceptualize frameworks, tools and methods for cities
to understand, identify, prioritize and actualize climate change resilience in vulnerable
urban areas.
The program includes ten cities in South and South East Asia. Da Nang, Can Tho and
QuyNhon in Vietnam; Gorakhpur, Surat and Indore in India; Bandar Lampung and
Semarang in Indonesia; and Chiang Raiand Hat Yai in Thailand.
ACCCRN works with national partners TARU Leading Edge and Gorakhpur Environmental
Action Group (GEAG) in India, the National Institute for Science and Technology Policy and
Strategy Studies (NISTPASS) and Challenge to Change (CtC) in Vietnam, Mercy Corps in
Indonesia and the Thailand Environmental Institute (TEI) in Thailand.
The Institute for Social and Environmental Transition (ISET) is the lead facilitating partner
for the ACCCRN process. The ACCCRN interaction with cities was organized in three
phases:
2
Institute for Social and Environmental Transition www.i-s-e-t.org
understanding the complex systems within each of the partner cities, and working with a
diverse range of city actors to build urban resilience.
The SLDs are informed by city specific information generated or compiled to support the
ACCCRN engagement, includingclimate science and model results, vulnerability
assessments, and sector studies. Through this process, local partners and relevant
stakeholders increased their understanding of climate change in general and how it will
impact and affect their cities, particularly for vulnerable groups and areas, in particular.
This understanding was tested and extended through the development and
implementation of climate change adaptation pilot projects in each city. Phase 2 culminated
with preparation by each city of their own
city Climate Resilience Strategy . ACCCRN
provided tools and methods through which local partners themselves led coordination and
analysis, with the goal of fostering strong city ownership and integratingresilience
planningprocesses into city planning for the long-term.
Background Information and Document Discussion
The Indonesian ACCCRN experience has a number of unique qualities in contrast to other
ACCCRN cities and countries. Two central issues in particular demonstrably shaped the
final Indonesian resilience strategies:
Concern by the city teams that the results of the initial citywide vulnerability
assessments were inadequate ledto extensive deliberation on the part of the
ACCCRN teams in both cities, reliance on additional secondary sources, and the
production of new hybrid analysis in the resilience strategy to a greater extent than
in other countries; and,
Mercy Corps and the Indonesian City Teams put strong priority on integrating the
resilience strategies with national and local policy.
The impact of these two issues are described below for the Semarang case.
The Semarang Climate Change Resilience Strategy opens with an introduction clearly
outlining the city background and purpose of the document, before moving into
vulnerability analysis, presentation and prioritization of proposed resilience actions, and a
discussion of relevant national and local policies.
3
Institute for Social and Environmental Transition www.i-s-e-t.org
assessments prepared during the engagement phase. CCROM undertook a citywide
assessment, characterizing
kelurahans
/sub districts by levels of current and future risk by
overlaying exposure to climate hazards based on a composite climate hazard index with
coping capacity (based on vulnerability and adaptive capacity indices using a number of
indicators). Meanwhile, Mercy Corps contributed a community-based vulnerability
assessment in
kelurahans
identified as vulnerable by the City Team during SLD 1. The
Urban and Regional Development Institute (URDI) produced an assessment of governance
in relation to climate change adaptation.
The vulnerability analysis in the Semarang resilience strategy draws from these three
documents, supported by additional materials. As in other countries, the vulnerability
section represents the culmination of a number of activities, deliberations between
technical staff, and a consensus on the most key activities. In Semarang, however, the
deliberation and consensus took on a particularly important role due to discomfort among
members of the City Team with the CCROM citywide vulnerability assessment. Some of the
issues the city partners flagged were:
The cities didn’t agree with some of the indicators that were selected for analysis. )n
part, this was because some of the indicators were misleading, such as the number
of educational facilities in an area, rather than the average level of education.
Because the indicators were not made transparent in the document, the city team
spent considerable effort to discover what was actually being measured, and also
lost confidence in the analysis;
Aggregating the hazards resulted in losing information about which hazards
impacted which areas;
Analyses were based on national datasets, some of which are available only at
large-scale and therefore have limited accuracy at the city-level;
Areas currently unexposed to flooding were identified as vulnerable to future
flooding, but the city team was not convinced this was realistic;
Involvement of city team and consultation during the process was minimal; and,
The report writing was very academic which made it difficult for many of the city
partners to understand and increased the challenges in giving feedback to CCROM.
This discomfort catalyzed partners to adopt certain elements of the vulnerability
assessment, while replacing or supplementing other analysis with information from other
sources. The City Working Group, City Team and Mercy Corps deliberated on these issues
through a series of SLDs during the resilience strategy development phase. In this way, the
resilience strategies provided a forum in which partners could formulate a new and more
comfortable understanding of vulnerability.
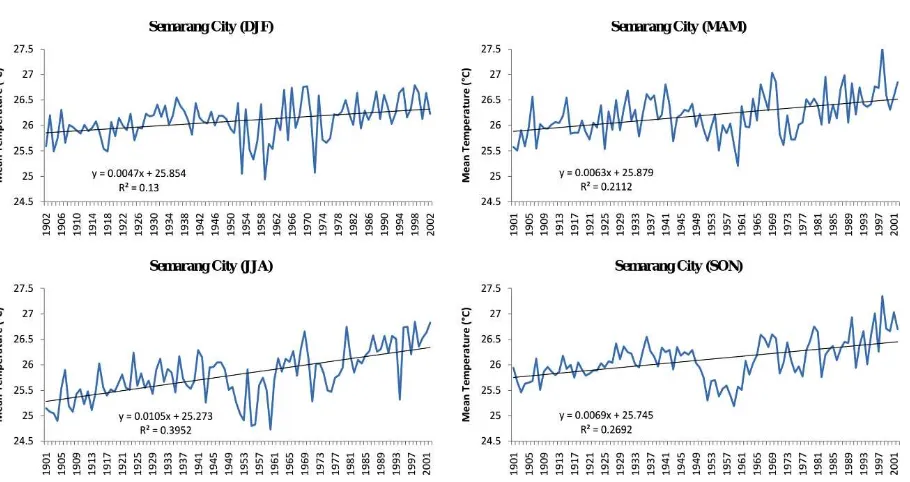
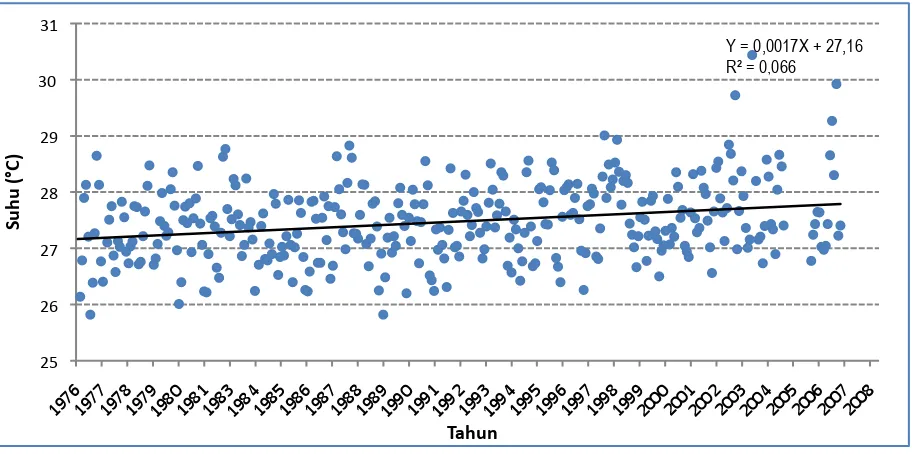
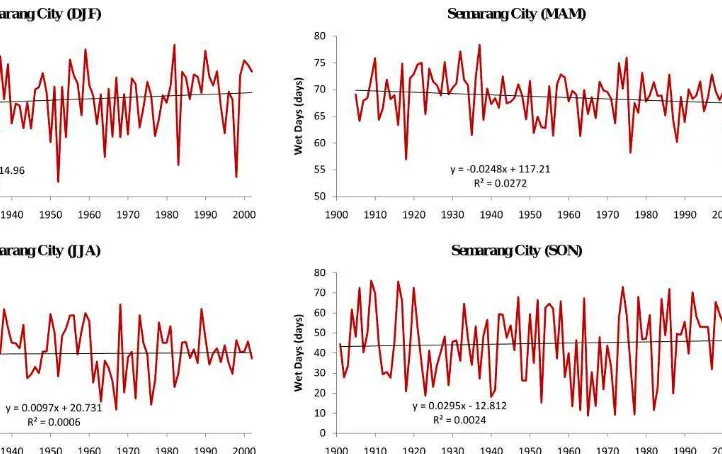
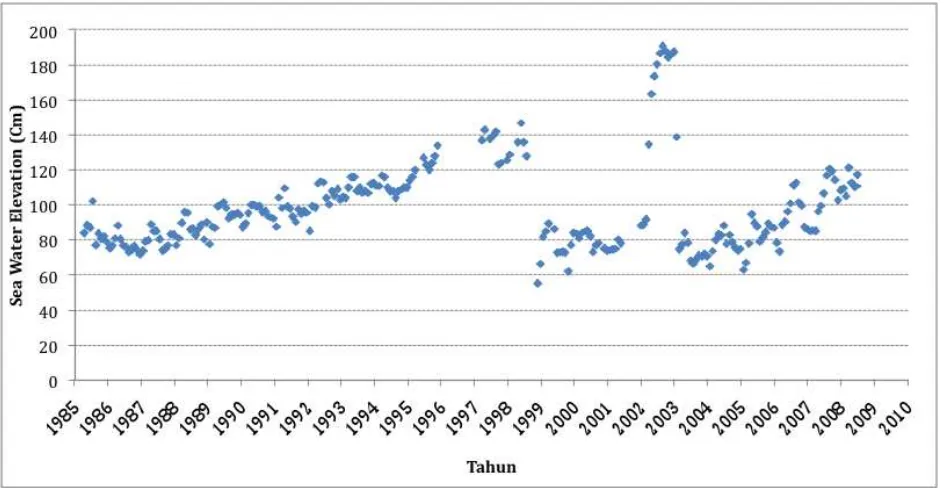
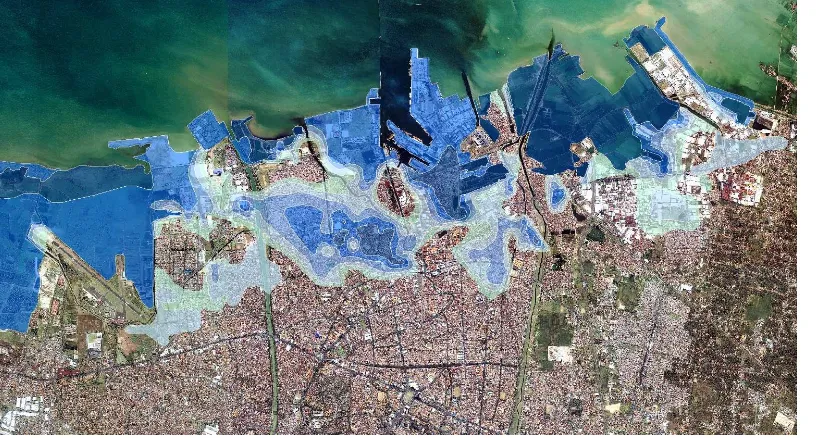
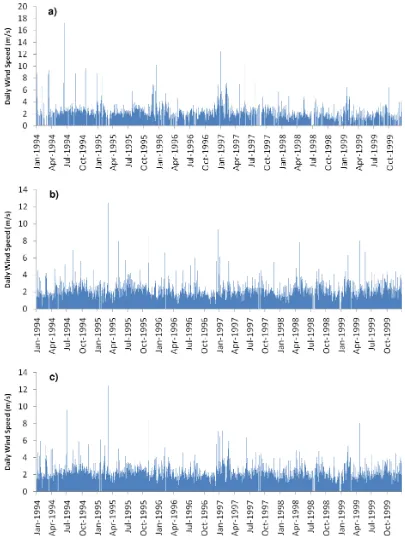
The resulting vulnerability analysis in the resilience strategy outlines historical trends and
future climate projections, including temperature, sea-level rise, rainfall and wind patterns,
supplemented with historical trend analysis and sea-level inundation mapping. Vulnerable
areas in Semarang are identified based on information from the community-based
4
Institute for Social and Environmental Transition www.i-s-e-t.org
concern
–
dry season (drought), rainy season (inundation), and sea level rise
—
are
introduced, with each scenarios examining how city development projects (extension of
piped water, dam and embankment construction, etc.) will affect issues such as water
scarcity, flooding, water contamination, saline intrusion, aquaculture, etc. In most cases,
the results of these scenarios indicate large gaps between climate, population, and
development trends and the solutions currently proposed by current city plans.
The strategy concludes with an outline of 16 proposed interventions. These are
categorized by sector: clean water; environment; infrastructure; marine, coastal and
fisheries; development of human resources; and development of institutional capacity.
Working group members used resilience matrices and qualitative cost benefit analysis tool
introduced by ISET to rank each proposed action by priority. Aside from these analytical
tools, partners describe other factors impacting this selection process, acknowledging that
prioritization reflected strategy as well as absolute perceived importance. Actions areas
already underway for government implementation were not prioritized in the resilience
strategy, for instance.
The significance of these sectors for Semarang is evident from the vulnerability analysis,
particularly in regard to development priority gaps identified in scenarios. But when
paired with action, it is clear that each of the presented sectors (with the exception of
human and institutional capacity) correspond fairly directly with specific hazards: land
movement, sea-level rise, flooding, high temperature and water scarcity, and salinization.
In this way, actions connect also to hazards identified in the vulnerability section.
The Semarang strategy stresses the importance of carrying out actions using a community
based, participatory approach
–
especially for decentralized infrastructure oriented
interventions. Decentralized actions promoting diversity and modularity, such as
rainwater harvesting, wastewater treatment, and water filtration systems, are aimed at
enhancing the resilience of vulnerable groups who cannot access centralized systems
—
but
at the same time, the strategies look toward enhancing or developing integrated drainage,
waste management, and water supply systems. This focus perhaps reflects the close
involvement throughout the process of local NGOs and universities who have close ties to
projects in vulnerable communities, the organizational focus of Mercy Corps as a
poverty-reduction NGO, and use of the community based assessment.
5
Institute for Social and Environmental Transition www.i-s-e-t.org
implementation opportunities, and planning processes. This includes national policy and
specifically the Indonesian Climate Change Sectoral Roadmap (ICCSR), which provides
guidelines for mitigation and/or adaptation coordination in water, marine and fisheries,
agriculture, health, transportation, forestry, industry, energy, and waste sectors. Authors
outline the (complex) process of accessing funding from ICCSR-linked sources, arguing the
importance of having a city-
level institution specifically able to support local government
to transform )CCSR policies into action.
With regard to local planning, the Semarang
strategy outlines its Long-term Development Plan (RPJP), but does not explicitly highlight
areas of weakness in the existing plans. The strategy does highlight its co-development
with Midterm Development Plans (RPJM) and the success in integrating climate change
priorities.
Indonesia was arguably the most successful of the ACCCRN countries at embedding and
integrating their strategies into local planning. This was due to the strategic configuration
and composition of their working groups and pointed effort made by city partners and
Mercy Corps to ensure that their strategies corresponded effectively with national and local
plans to demonstrate credibility, raise their profile, and increase likelihood of
implementation. Both successfully provided informed, climate related input in the midterm
development planning process, ensuring that all action areas were included in this plan.
TAHTA together with CWG (City Working Group) of Semarang City would like to express deep appreciation for the cooperation and trust given by Mercy Corps Indonesia. This activity is one form of support to Semarang City as one of the pilot cities in the ACCCRN (Asian Cities Climate Change Resilience Network) program, which was initiated by the Rockefeller Foundation (RF) and ISET (Institute for Social and Environmental Transformation).
This document is a plan for Semarang City in order to adapt to the pressures and shocks that may occur as a result of climate change. This document is not exclusive in the context of planning for the city because its formulation and format has been synergized with the substances of Semarang’s Medium Term Development Plan (RPJM). The final section of this document can be an inspiration for agencies in Semarang City about how they can contribute to climate change adaptation activities. This document is not a static document as this can be quickly adjusted with
1. Introduction
1.2. Goal
Scope 1: Scope 2: Scope 3: Scope 4:
Review of Climate Impacts Assessment and Vulnerability
Strategy Formulation & Proposed Action Plans
Prioritization of Action plans
Annex Draft Proposal
Synthesis document's ACCCRN (VA, CBVA, Sector Studies, Pilot)
Additional issues of SLDs
The actual and dynamic issues in urban
development
Supporting studies
Development of climate and city scenarios
Produce the series of activities to create resilience
Assess the contribution the proposed activities
Identify benefits for vulnerable groups
Role of stakeholders
Development of prioritization criteria
Comparative analysis of the proposed activities
Identify of complementary activities and actors
Development of M &E mechanisms
Outline budget of the prioritized activities
Preparation of timeline
1.5.1. Preparation.
PREPARATION
!
!
"#$%&$'&()*#+*),-'(&.)/(012(
.'%(0$34(5*.6(-'(078
!
!
0--#%$'.,-'(9$3:(3:*(+-#*(3*.6(
-;((<$%=3*#6(0$34(>*?*@-)6*'3(
A@.'(B7AC<>D
!
BRAINSTORMING
!
!
>*?*@-)6*'3(-;(+@$6.3*((.'%(+$34(
%*?*@-)6*'3(E+*'.#$-E
!
!
F-#6G@.,-'(-;(.%.)3.,-'(
E3#.3*&$*E(.'%(.+,-'E
!
CONSULTANCY AND
PRIORITIZATION
!
!
1-#HE:-)(9$3:(3:*(3.#&*3(&#-G)(
.'%(3:*(*I)*#3(6**,'&
!
!
A#$-#$,J.,-'
!
FINALIZATION
!
!
1#$,'&(3:*(%-+G6*'3
!
!
A#*).#.,-'(-;(%#.K()#-)-E.@
!
2. Semarang City’s Vulnerability
Gambar 4.1.6 Temperatur rata – rata bulanan di wilayah Semarang, Prov. Jawa Tengah !"%
!&% !'% !(% !)% *$% *+%
!"#"$%&
'
($
)*#"+$
Y = 0,0017X + 27,16
R! = 0,066
2000 2025 2050 2100
SRESA2: moderate 0.2 0.5 1.2 2.9
Range 0.15-0.25 0.3-0.7 0.8-1.6 2.0-4.1
SRESB1: moderate 0.2 0.7 1.1 1.9
Gambar 3.5.
Gambar 3.6
2000 2025 2050 2100
SRESA2: moderate 2 10 21 60
Range 0-4 4-20 9-41 15-112
SRESB1: moderate 2 10 21 48
Range 0-4 4-22 9-42 18-85
SEMARANG City Resilience Strategy
Gambar 3.2.
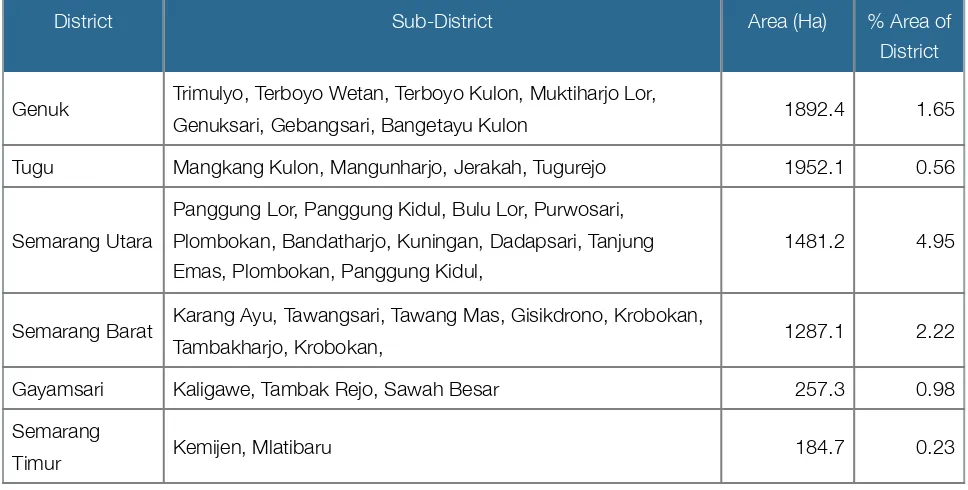
District Sub-District Area (Ha) % Area of District
Genuk Trimulyo, Terboyo Wetan, Terboyo Kulon, Muktiharjo Lor,
Genuksari, Gebangsari, Bangetayu Kulon 1892.4 1.65 Tugu Mangkang Kulon, Mangunharjo, Jerakah, Tugurejo 1952.1 0.56
Semarang Utara
Panggung Lor, Panggung Kidul, Bulu Lor, Purwosari, Plombokan, Bandatharjo, Kuningan, Dadapsari, Tanjung Emas, Plombokan, Panggung Kidul,
1481.2 4.95
Semarang Barat Karang Ayu, Tawangsari, Tawang Mas, Gisikdrono, Krobokan,
Tambakharjo, Krobokan, 1287.1 2.22
Gayamsari Kaligawe, Tambak Rejo, Sawah Besar 257.3 0.98
Semarang
Timur Kemijen, Mlatibaru 184.7 0.23
District
Pedurungan Muktiharjo Lor, Muktiharjo Kidul 431.7 0.12
Semarang
Tengah Pandansari, Purwodinatan 280.1 0.13
TOTAL 7487 10.85
!"###$ !%##$ #$ %##$ "###$ "%##$ &###$ &%##$
"$ &$ '$ ($ %$
)*+,$"$ )*+,$&$ )*+,$'$
Type of Activities Impact Economic Loss (IDR)
Mangrove Ecosystem Hectare 729,351,612*
Fishponds 2,889 Hectare 110,937.600
Rice Fields 902 Hectare 29,221,560,000
Settlements 10,425 Houses 208,500,000.000
Infrastructure 2.27 Km 5,602,961,405
Assessment Aspects Year 2007 (IDR) Year 2010 (IDR)
Housing 5,000,000 5,004,000
Productivity 1,000,000 10,800,000
Education 0 1,110,000
Health 0 1,440,000
TOTAL 6,000,000 18,354,000
*"+","-./#012#"-.%23%24",./-"-5"-"-6%"2-",/72-510-5"-
8"90-:;;)
*"+","-./#012#"-.%23%24",./-"-5"-"-6%"2-",/72-510-5"-
3. National and City Policy
Sectors Policy Direction in Adaptation and Mitigation Strategies
Agriculture On food crops and horticulture through: Improved management of water management, including systems and irrigation networks; Development of water harvesting technologies (ponds, trench dams) and the efficiency of water use such as irrigation drip and mulch; Development of species and varieties of plants tolerant to environmental stresses such as increase in air temperature, drought, inundation (flooding), and salinity; Development of soil management technologies and crops to improve crop adaptation, and
Development of farm protection system of failure due to climate change or weather crop insurance.
In plantation crops through: Development of commodity which can survive in stress drought and excess water; Application of soil and crop management technologies to increase crop’s power adaptation; Development of water-saving technology; Application of water management technologies, especially on
land prone to drought.
On farm management: Development of livestock more adaptable to extreme environments (such as Drought, high temperature, inundation); Development of silage technology to cope with food shortages,
Seasonal Development of integrated crop-livestock systems (CLS) to reduce the risk of and optimizing the use of land resources.
Health Strengthening early warning systems and emergency response in the community; Strengthen review on vulnerability and risk assessment of the health sector due to climate change: Developing a policy
framework supported by legislation and regulation; Develop planning and evidence-based decision-making areas; Improving cross-sectoral cooperation; Increase community participation, private and higher education; Strengthen the ability of local governments; Development of networking and sharing of information; and improve the quality and quantity of clean water and community sanitation.
Waste Carry out a more complete and perfect review of GHG inventory of waste sector to accompany a systematic plan for GHG reduction; Applying environmentally sound waste management policies in the field of infrastructure development supported by environmentally sound development and applied technology research; Develop environmental policy implementation to the principle of 3R (reduce, reuse,recycle) in waste management: Developing a sustainable infrastructure development (By balancing
three pillars of development, namely economic, social, and environmental) with reducing GHG emissions (GHG) and increasing carbon sequestration; Conducting solid waste infrastructure development sector that put concern the capacity of human resources and institutions including local government
competence and independence to promote environmentally sound infrastructure development and to encourage the role of the private sector and communities; Develop waste management technologies that are environmentally friendly and anticipative to climate change; Developing the application of EPR (Extended Producer Responsibility) to hazardous waste producers and importers; Develop quality
improvement of landfills technology.
Marines In the group of inventory data and research activities include: Strengthening the capacity of research on the phenomenon, hazards, and potential impacts of climate change; Strengthen the capacity of adaptation and mitigation assessments more appropriately in accordance with the conditions of vulnerability and local wisdom.
In the group of planning activities: Integrate climate change in planning documents and management of maritime affairs and fisheries.
In the group of policies, regulations, and capacity building: The preparation of norms, standards and guidelines adaptation and mitigation of climate change; Adjustment of regulations and activities related to climate change; Accelerate regional head decision in the preparation of Strategic Planning Document (RENSTRA) in Maritime Affairs and Fisheries has to consider climate change issues; Improved institutional capacity and monitoring and control.
In groups of implementation activities: Adjustment strength of coastal structures, Maintenance and rehabilitation of coastal ecosystems and small islands, Anticipating the sinking of small islands, especially outermost Indonesian island, Developing disaster reduction and climate variability on the coast,
Anticipation of fishing ground’s shifting area towards the sea and their sustainability of fisheries production
Sectors Policy Direction in Adaptation and Mitigation Strategies
Water Resources
Carry out hazard assessment, vulnerability, climate change impacts on natural resources sector which is more detailed; Increasing the capacity of data and information in term of national resources, including its
availability, needs, resources, and how residents obtain water through updates, upgrades, and providing public access to data and information resources; Strengthen the capacity of water resources in order to improve the situation of water supply; Increase or apply the concept of conjunctive use of surface water potential of the area is less; Increase provision and public access to data and information concerning water- related disasters and climate change such as floods, droughts, and landslides; setting (regulation) of the Act further resources at the national level and areas that consider climate change issues; Set or secure areas or water catchment or protection of water resources and protected areas of socialization and
adaptation to climate change campaigns water sector.
Energy Fuel pricing with more balanced (fair); Policy natural resource price of renewable energy; Requiring renewable energy resources; Tax or carbon tax from fuel burning activities; Development of the fuel gas
supply infrastructure; introduction of new technologies and cleaner technologies using coal, and mixing policy with biofuels
Industry Improving energy efficiency and energy diversification; Monitoring GHG emissions; Modification and replacement of technology
!
"#$%!
&'#! &#()%! &#(#%!
&*%("!'+! &*%,-&"!'+!
#./0123!
#./0123! #./0123!
#./0123! 455,&!
#./0123! #./0123! 455-6!
78%8&9! :&"%-!
"#$7!
&#(#7! &#()7!
&'#7! &*%("!
,'#7!
&*%,-&"! ,'#7! 7"'!
%;3</=;>! +1?1>!
5<3@!+1?1>!
455,&!AB=C<=D!6>/E!
PROGRAMS GOALS EXPECTED OUTCOMES
ECONOMY Trade and Serv-ices
Increasing the contribution of re-sources trade to reach at 35.45% in 2014
Increasing economic growth followed by com-munity per capita income
Anticipating the impact of trade globalization, which has impacts on the strict competition. SMEs and Micro
Finance
Strengthen middle down economic community
Finding the economic potential and improve competitiveness of SMEs
Pressing the level of poverty in the community who experience increase of 0.21% during 1993 - 2004 Promoting economically independent community
Penetrate export markets and increase national incomes
Investment Creating a conducive climate in-vestment, ie mainly the protection of investors and simplification of bureaucracy for investment
Attract investors, both domestic and external country because of security and convenience for investing
Increasing economic growth Industry Socializing environmentally friendly
industry/ Green industry Building partnerships, capital-in-tensive industry with a small indu-stry to have mutual benefit
Social sensitivity to global warming and increa-sed environmental health
Support the existence of small scale industries with the partnership with large industry. Contribute to economic growth which showed positive trends 3.35% to 3.95% from 2000 to 2004
Employment Creating new jobs for growing la-bor force.
Reducing the social gap
Pressing the crime rate caused by high unem-ployment problems
Pressing the projected high rates of unemploy-ment that will reach at 62.84% in 2025
Transportation Improving and optimizing the con-ditions of damaged roads throug-hout the 638,754 km of the total road length reaches 2,762,731 km.
Achieve an effective and efficient transportation system in accordance with the hierarchy and the function of roads as well as the realization of transportation system on land, sea and air in an integrated way.
Realization of rapid and mass transportation (mass and rapid transportation).
GOVERNANCE
Public Services Increasing public satisfaction on government service by establishing a unit integrated service (UPT), standard applications of minimum service, complaints and hotline service to improve performance, develop the quality of the bu-reaucracy, develop infrastructure, and create space for public partici-pation.
Increased public confidence to the government that can generate public support for government programs
Law Improving the performance of law enforcement and quality of regional law.
Increasing law enforcement stability that can support programs government programs.
INFRASTRUCTURE AND ENVIRONMENT INFRASTRUCTURE AND ENVIRONMENT
Spatial Planning The creation of structure and spa-tial pattern effectively and efficiently in accordance with hierarchy and its development function
The harmony, sustainability and optimum utiliza-tion of space in accordance with the potential and carrying capacity of the region
Water Resources Support the sustainability of water resources for urban activities
Drainage The creation of coherence in ma-nagement of drainage from upstream to downstream
Sustainable urban drainage system
Waste The integration of waste manage-ment systems at urban scale
The sustainable urban waste management sy-stem
Pollution Pollution management and en-vironmental friendly development of green open space system
Improving the quality of urban environment
Housing and Settlements
Meeting the needs of housing qu-antity and quality as population grows
PROGRAMS GOALS EXPECTED OUTCOMES
Public Facilities Meeting the needs of urban com-munities and facilities
The provision of urban public facilitiescommuniti-es and urban facilitifacilitiescommuniti-es that can support Sema-rang City as a city of trade and metropolitan sca-le services
HUMAN RESOURCES HUMAN RESOURCES
Health Improving community health status through: Promotive, preventive and curative activities
Creation of healthy environment Support medical professionalism Adequate health facilities and in-frastructure
Development of the community health care system
Increasing the degree of community quality of life that can be seen in the following indicators: Life Expectancy in 2025 will reach 75 years,rea-ching 4.00 Infant Mortality / 1000 birth, maternal mortality rate reached 42/100.000 give birth Health care coverage to 100% of the total popu-lation
Tourism and Culture
Development of tourism as a ful-fillment of community needs and assets to create city’s magnet. The development of local culture as tourism potential
Development of tourism as a ful-fillment
Increased contribution of tourism in the city eco-nomy Preservation of local culture as an aspect of community characteristics forming
Education Improving community awareness for the importance of education for the effort to improve quality of life
9 years mandatory up to secondary level for the basic education level of Semarang community Increased community participation to education Achieving gross enrollment rate in each educa-tion stage
ȋ Ȍ
Ǥ
ȋ Ȍ
ȋȌǤ
ȋ Ȍ
Ǥ ǡ
Ǥ
!"#$"%
&'&(
)*#+*,-,
.%"/,"0-
)*1"
2-#"%",3
Population:1.4 Millions
(Current)
Population:1.4 Millions
(Current)
Population: 2.9 Millions
(Next 50 years)
Population: 2.9 Millions
(Next 50 years)
People Uncovered by PDAM Wed by PDAM Water Tap
3 Months Dry Season 60%60% 80%80%
4 Months Dry Season 70%70% 85%85%
Post Development of
Dam
wo/ Upstream Conservation
w/ Upstream Conservation
wo/ Upstream Conservation
w/ Upstream Conservation
3 Months Dry Season 54% 47% 78% 75%
9% Drainage Masterplan
are Implemented (Current)
50% Drainase Masterplan will be
implemented (Next 50 years)
Percentage of Inundated Arcentage of Inundated Areas
2-3 Months Rainy Season 10.8% 6.5%
4-6 Months Rainy Season 13% 7.8%
Number of Days with Flooding Number of Days with Flooding
2-3 Months Rainy Season 36 22
4-6 Months Rainy Season 72 44
Flooded Houses and Contaminated W Flooded Houses and Contaminated Wells
2-3 Months Rainy Season 51.000 92.800
4-6 Months Rainy Season 58.500 98.600
Areas Preas Prone to Landslide
2-3 Months Rainy Season 23 Sub-district 8 Sub-district
4-6 Months Rainy Season 38 Sub-district 19 Sub-district
9% Drainage Masterplan
are Implemented (Current)
50% Drainase Masterplan will be
implemented (Next 50 years)
Percentage of Inundation in Coastal Arcentage of Inundation in Coastal Areas
SLR 21 Cm 10.8% 6.5%
Mangrove 37% of Ideal
(Current)
Mangrove 18% of Ideal
(Next 50 Years)
Percentage of Loss on Fishponds frcentage of Loss on Fishponds from Existing (2009 data)
SLR 21 Cm 40% 50%
SLR 38 Cm 75% 90%
Production Loss (in Billions IDR)oduction Loss (in Billions IDR)
SLR 21 Cm 7.2 9
SLR 38 Cm 13.2 16.3
CLIMATE ADAPTA-TION STRATEGIES
REDUNDANCY FLEXIBILITY/ ROBUSTNESS
REORGANIZATION/ RESPONSIVENESS
LEARNING
1. Rain Harvesting Can be done by making ponds, recharge wells, or catch water directly from the roof building.
The rainwater can be directly used to wash-ing and toiletwash-ing or through processing prior as drinking water.
Rain harvesting re-duces run-off which potentially caused flooding.
There are individual initiation on rain water harvesting implemen-tation
2.Water Saving The reduction could also include reuse
in using water and can be done in various household activities.
Water savings can be done in the dry or rainy season.
Water saving can also provide water supply in the dry season.
There have been many campaigns about water savings.
3. Purification of pub-lic wells / contami-nated water sources
Purification can be done with various ways, both traditional and with im-plementation appropriate technology.
Filtration systems de-signed in order to run during floods and sea-water inundation.
inundation, purifica-tion guarantee the availability of clean water for community and reduce commu-nity fees to purchase clean water.
Purification has been applied, for example, in Aceh
4.Seawater desalina-tion
Desalination is con-ducted in emergency situation only, especially when flooding occurs.
Desalination facilities are designed with mo-bile concept to reach flooding areas.
In emergency case, seawater desalination will guarantee avail-ability clean water for flooding victims.
Desalination projects has been imple-mented in in Aceh and Bali
5. Sea wall Sea dike will also serve as the north outer ring road of Semarang City
Sea dikes can over-come SLR at the most extreme level
It has been imple-mented in several other countries, such as the Nether-lands and South Ko-rea.
6. Channels belt network
Can be designed to accommodate rain-water runoff in extreme conditions, the volume channels can be design to consider extreme rainfall conditions.
Could reduce the pressure of flooding in the central part of Semarang City
It was pointed out in the drainage master-plan of Semarang. It has been imple-mented in some part of Semarang at small scale.
7. Neighborhood Drainage System
Can be designed to accommodate presipi-tation runoff in extreme conditions. The drain-age design
such as volume and materials may consider availability material at the local level.
Could reduce the pressure flooding in the central part of Semarang City, espe-cially in neighborhood settlements. It can improve the quality of public health.
It has been imple-mented in some parts of the city at small scale, such as KIP.
8. Flooding Shelter Should be designed with minimum elevation which higher than flooding level at the most extreme rainfall.
The construction of flooding shelter is allo-cated to settlement centers with time and distance consideration. The shelter can be a new building or it just integrated its function with others available building.
Community resilience increase when ex-treme rainfall and the failure of drainage system occurs.
The victims of flood disaster often evacu-ate their self inde-pendently to higher locations used to public building close to their home such as mosques, curchs, and schools.
9. Upstream Conser-vation of Jatibarang Dam
Can be done with vari-ous ways, such as agro-forestry.
Planting can be done in rainy season, and treatment will be fo-cused on dry season.
Can deliver value added economically for the community besides
reduce sedimentation to Jatibarang Dam
It has been studied by Central Government, Local Government, and JICA.
10. Protecting water resources through domestic liquid waste management.
Can be done through the management liquid waste.
Can be done in individ-ual and communal scale. The design can be customised with the characteristic of problems at different locality.
Improving public health and environ-ment quality.
There are initiation activity applied by the City Government and NGOs. Citywide- sanitation masterplan is available.
11. Vegetative Treatment to address landslide
in the high slope areas
There are various kinds of species (vetiver, bam-boo,
crops) and planting techniques.
Planting can be done in rainy season, and treatment will be fo-cused on dry season
In addition to protect-ing homes and pre-vent the victim, this has contribution to reduce sedimentation in the urban drainage network.
There were initiation activity practised through ACCCRN’s pilot projects.
12. Green belt along the shoreline in aq-uaculture land
There are various kinds of species and planting techniques for man-groves.
Planting can be done in rainy season, and treatment
will be focused on dry season
In addition to protect-ing the fishponds, it also increases the coastal biodiversity, providing additional benefits such as for education and tour-ism.
CLIMATE ADAPTA-TION STRATEGIES
REDUNDANCY FLEXIBILITY/ ROBUSTNESS
REORGANIZATION/ RESPONSIVENESS
LEARNING
13. Diversification of marine and fisheries business and prod-ucts
Development of fisheries and marines business which is not sensitive to SLR and extreme rainfall.
Development of busi-ness and products fol-lows the demand of the markets.
Economically strengthened people who are working in marine and fisheries sector will be more stable and are able to afford individual adap-tation action if neces-sary
There are many op-tions of activities to develop this sectors.
14. Mainstreaming climate change into education curricula
Can be done through both formal and non formal education and within local government and broader community
Can be done any time. Its application could be integrated or adjusted with available education system
and training.
Environmental Educa-tion programs have been practised to formal education but it is not specific about climate change.
15. The establish-ment of Center for Cities and Climate Changes
The institution organiza-tionally under local gov-ernment but it consists of city development stakeholders (govern-ment, NGOs, University, Private, Media, and Community Groups).
The organization format follow the mechanism and procedure in local government. This insti-tutional development is to increase government capacity by providing information and data base to support deci-sion making process.
This organization also provides training for government staffs or other on request.
Other similar centers are available in other cities and the centers usually based in uni-versity.
16. Involvement Pri-vate Sector in Cli-mate Adaptation Projects
Private contribution will be made specifically relevant with their inter-est.
CSR programs in pro-climate adaptation activities. Private sec-tors will be directed to have contribution to CC adaptation
Some private corpo-rations have invested their CSR to environ-mental protection projects.
17. Strategic Envi-ronmental Assess-ment of City Master-plan with Climate Change Criteria
There are some docu-ment on CC in Sema-rang City
There are enough hu-man resource capacity to deal with the evalua-tion
The output of evalua-tion can be useful for further spatial plan-ning policies.
The result of evalua-tion will feed city regular evaluation on masterplan every 5 years.
There is no initiative to evaluate city master-plan with CC criteria in Indonesia, but this practice may be avail-able in other country such as India (Surat City)
CLIMATE ADAPTA-TION STRATEGIES
COSTS COSTS TION STRATEGIES
Economy Social Environment Others
1. Rain Harvesting Need a DED study, Installment, system maintenance, land acquisition for ponds system model
Negative percep-tion on rainwater quality which are assumed as dirty water
Health risks as medium to mos-quitos and larvae
Landscape modi-fication for ponds system model has an effect for envi-ronment
2.Water Saving Installment, saving water technology
Community resis-tance to new life style
3. Purification of public wells / con-taminated water sources
Need a DED study, Installment
Less practice from community point of view
4.Seawater desali-nation
Machinery invest-ment, operational and maintenance, Distributor vehicle
Massive energy, produce a high level of CO2
Skillful operators
5. Sea wall Need a DED study, Operational and maintenance, High cost investment
Sensitive to conflict over land acquisi-tion issues, loss of some people liveli-hoods
Coastal ecosys-tem degradation Sand mining in-crease to sea wall construction
People safety are threatened if there is failure
Will promote develop-ment in SLR prone areas
6. Channels belt network
Need a DED study, Operational and maintenance, High cost investment
Land acquisition for development
Traffic jam due to development proc-ess
CLIMATE ADAPTA-TION STRATEGIES
COSTS COSTS TION STRATEGIES
Economy Social Environment Others
7. Neighborhood Drainage System
Need a DED study, Operational and maintenance, High cost investment
Reduction of channel drainage lifetime due to sediment and garbage
8. Flooding Shelter Need a DED study, Investment for new building, investment for building modifi-cation, land acquisi-tion, Operational and maintenance
Perception and negative image to government (why do not solve the root of problem?)
9. Upstream Con-servation of Jatibarang Dam
Seed provision, planting, and main-tenance
Need intergovern-mental coopera-tions: beyond the authority of city government
Government’s percep-tion that conservapercep-tion is economically not feasible, especially from regional income perspective
10. Domestic liquid waste management to protect water re-sources
Need a DED study, Installment, and maintenance
Community per-ception that waste water should be away from their homes
Community resistance if maintenance costs became their responsi-bility due to lack of un-derstanding and econ-omy
11. Vegetative Treatment to ad-dress landslide in the high slope areas
Seed provision, planting, fertilizing, and maintenance
Land acquisition Time gap between planting actions and gained benefits
12. Green belt along the shoreline in aq-uaculture land
Land acquisition, seed provision, and maintenance
Sensitive to conflict over land acquisi-tion issues be-cause land owner-ship
Government’s percep-tion that conservapercep-tion is economically not feasible, especially from regional income perspective
13. Diversification of marine and fisheries business and prod-ucts
Training, Business assistance, capital support,and moni-toring
Community resis-tance to new life style
Inappropriate type of business has a negative impact to environment
Marine and fisheries sector get less gov-ernment attention
14. Mainstreaming climate change into formal education curricula
Training, curricula development, and development of learning forum
Too many subjects on formal educa-tion
Economy Social Environment Others 15. The
establish-ment of Center for Cities and Climate Changes
Training, developing tools and learning media
Multi-stakeholder insti-tutions are difficult to be funded by govern-ment
16. Involvement Pri-vate Sector in Cli-mate Adaptation Projects
Training, seminar, and workshop
Develop dialogue forum between Private, Govern-ment,and Commu-nity.
Multi-stakeholder insti-tutions are difficult to be funded by govern-ment
17. Strategic Envi-ronemntal Assess-ment of City Master-plan with Climate Change Criteria
Workshop series The result of evaluation might be difficult to be adopted due to a huge social cost
Non-physical outputs are less considered because don’t have direct impact to people
CLIMATE ADAPTA-TION STRATEGIES
BENEFITS BENEFITS TION STRATEGIES
Economy Social Environment Others
1. Rain Harvesting Reduce cost for water purchase Reduce economic loss from flooding
Recreation object Reduce under-ground water ex-ploitation
2.Water Saving Reduce cost for water purchase
Reduce pressure to
water resources
3. Purification of pub-lic wells / contami-nated water sources
Reduce cost for water purchase
Reduce health risk due to flooding
4.Seawater desalina-tion
Reduce cost for water which are expensive especially on flood disaster
Provide clean wa-ter in emergency situation
5. Sea wall Reduce economic loss of flooding and seawater inundation Increase accessibil-ity
CLIMATE ADAPTA-TION STRATEGIES
BENEFITS BENEFITS TION STRATEGIES
Economy Social Environment Others
6. Channels belt net-work
Reduce economic loss of flooding
Reduce health risk due to flooding and create new employments in construction phase 7. Neighborhood
Drainage System
Reduce economic loss of flooding and landslides
Reduce health risk due to flooding and create new employments in construction phase 8. Flooding Shelter Shelter can be
func-tioned as public space when there is no flooding
Reduce health risk due to flooding and create new employments in construction phase
Quality of shelter is better than their houses which are flooded
9. Upstream Conser-vation of Jatibarang Dam
Support water sources for PDAM
Create new em-ployments in planting phase and tourism activ-ity post develop-ment
Reduce sedimenta-tion into the dam and contribute to green masterplan
10. Protecting water resources through domestic liquid waste management
Consistency of wa-ter supply non PDAM
Waste is also community re-sponsibility Increase public health quality
Protect water re-source non PDAM
11. Vegetative Treat-ment to address landslide
in the high slope ar-eas
Reduce material loss due to land slide
Reduce the num-ber of victims
Reduce sedimenta-tion into the drain-age and contribute to green masterplan
12. Green belt along the shoreline in aq-uaculture land
Protecting 1000 hectares of fish-ponds valued at 18 Billions/ year
Increase the wel-fare o coastal community Tourism and man-grove for educa-tions
Increase coastal biodiversity
13. Diversification of marine and fisheries business and prod-ucts
Increase community income
The level of com-munity welfare at least will not de-cline
Economy Social Environment Others
14. Mainstreaming climate change into formal education cur-ricula
Economic lost due to environmental degradation can be reduced
Increasing knowl-edge of people at school and uni-versity
Community-based environmentally sound activities will grow considerably
Key success for the implementation of climate adaptation program
15. The establishment of Center for Cities and Climate Changes
Availability of infor-mation, data base, and human re-source to local gov-ernment
The capacity of government and public will increase
Key success for the implementation of climate adaptation program
16. Involvement Pri-vate Sector in Climate Adaptation Projects
Alternative sources of climate adapta-tion funding are available
Environmental man-agement activities increase which con-tribute to resilience
Key success for the implementation of climate adaptation program
17. Strategic Envi-ronmental Assess-ment of City Master-plan with Climate Change Criteria
Non-physical so it less expensive ac-tivity
The future impact of CC to society can be anticipated by spatial plan-ning.
CLIMATE ADAPTATION COSTS BENEFITSBENEFITS RatioB/C CLIMATE ADAPTATION
STRATEGIES Economy Social Environ-ment Others
Total
Costs Economy Social
Environ-3. Purification of public wells /
contaminated water sources 3 3 - - 6 3 3 - - 6 1.00
4.Seawater desalination 4 - - 4 8 2 4 - - 6 0.75
5. Sea wall 5 3 3 4 15 5 3 - - 8 0.53
6. Channels belt network 5 3 - 1 9 4 3 - - 7 0.78
7. Neighborhood Drainage
Sys-tem 5 - - 3 8 3 3 - - 6 0.75
8. Flooding Shelter 4 2 - - 6 3 4 3 - 10 1.67
9. Upstream Conservation of
Jatibarang Dam 2 4 - 3 9 4 2 2 - 8 0.89
10. Domestic liquid waste man-agement to protect water re-sources
4 2 - 2 8 4 3 5 - 12 1.50
11. Vegetative Treatment to address landslide
in the high slope areas
3 4 - 3 10 3 3 4 - 10 1.00
12. Green belt along the
shore-line in aquaculture land 3 4 - 3 10 3 2 4 - 10 1.00
13. Diversification of marine and
fisheries business and products 3 4 2 3 12 3 3 4 - 10 0.83
14. Mainstreaming climate change into formal education curricula
4 4 - - 8 3 3 3 2 11 1.38
15. The establishment of Center
for Cities and Climate Changes 3 - - 4 7 4 4 - 3 11 1.57 16. Involvement Private Sector
in Climate Adaptation Projects 2 4 - - 6 2 - 3 2 7 1.17
17. City Masterplan
Evaluation-with Climate Change Criteria 1 4 - - 5 1 3 7 1.40
6. Implementation and M&E
ADAPTATION ACTIONS TIME
Rain Harvesting 30 Months 750,000 USD Rockefeller Foundation, ISET, MercyCorps
BAPPEDA, BLH; Dinas Kesehatan; BAPERMAS, University and Research Institution, and NGOs Flood Shelter 18 Months 210,000 USD Rockefeller
Foundation, ISET, MercyCorps
BAPPEDA,PSDA, DPU, DTK, DKPB, University and Research Institution, and NGOs
The establishment of Center for Cities and Climate Changes
12 Months 100,000 USD Rockefeller Foundation, ISET, MercyCorps
BAPPEDA, BPS, Litbang, Bag. Hukum, University and Research Institution, and NGOs
Protecting water resources through domestic liquid waste management
21 Months 230,000 USD Rockefeller Foundation, ISET, MercyCorps
BAPPEDA,BLH, Dinas Kesehatan, DTK, University and Research Institution, and NGOs
Strategic Environmental Assessment of City Masterplan with Climate Change Criteria
12 Months 100,000 USD Rockefeller Foundation, ISET, MercyCorps
BAPPEDA, University and Research Institution, and NGOs
TIME FRAME ADAPTATION ACTIONS FUNDING
PROPOSAL
COLLABORATION AND FUNDING
Medium Term Mainstreaming climate change into formal education curricula
APBD, ICCTF Dinas Pendidikan, BLH; University and Research Institution
TIME FRAME ADAPTATION ACTIONS FUNDING PROPOSAL
COLLABORATION AND FUNDING
Medium Term Involvement Private Sector’s CSR in Climate Adaptation Projects
APBD, ICCTF BAPPEDA, BLH, University and Research Institution, and NGOs
Purification of public wells / contaminated water sources
APBD, ICCTF, DAK
BLH, Dinas Kesehatan, BAPERMAS
Vegetative treatment to address landslide in the high slope areas
APBD, ICCTF, DAK
BLH, Dinas Pertanian, Dinas Pertamanan, NGOs
100 m Green belt along the shoreline in aquaculture land
APBD, ICCTF, DAK
DKP, BLH, Dinas Pertanian, NGOs
Upstream Conservation of Jatibarang Dam
APBD, ICCTF Pem Provinsi (BLH, Kehutanan), BLH, Dinas Pertanian
Diversification of marine and fisheries business and products
APBD, ICCTF, DAK
DKP, BAPERMAS, Dinas Koperasi
Long Term Channels belt network APBN, ICCTF DPU Pusat, BAPPEDA, DPU, PSDA, DTKP
Neighborhood drainage system
APBN, ICCTF DPU Pusat, BAPPEDA, DPU, PSDA, BAPERMAS, DTKP
Seawater desalination APBN, ICCTF DPU Pusat, BAPPEDA, DPU, PSDA
Sea wall APBN, ICCTF DPU Pusat, BAPPEDA, DPU, PSDA, DTKP
Reference
People uncovered by PDAM
80%
!
85%
!
60%
70%
!
Pop: 2.9 Millions!
Pop: 1.4 Millions!
Dry Season!
3 Months! Dry Season4 Months! !
People uncovered by PDAM
80%
!
85%
!
60%
70%
!
Pop: 2.9 Millions!
Pop: 1.4 Millions!
Dry Season!
3 Months! Dry Season4 Months! !
People uncovered by PDAM after Jatibarang Dam development (2050)
75%
!
80%
!
78%
82%
!
Pop: 2.9 Millions; Dam with up-stream conservation!
Pop: 2.9 Millions; Dam without up-stream conservation!
Dry Season!
3 Months! Dry Season4 Months! !
Coastal Area Covered by SLR with different Drainage Masterplan Implementation
13%
!
28%
!
53%
68%
!
50% of Masterplan Drainage are implemented !9% of Masterplan Drainage are implemented! SLR!
SRESA B1/A2! 21 cm!
Area Covered by Flooding with different Drainage Masterplan Implementation
6.5%
!
7.8%
!
10.8%
13%
!
50% of Masterplan Drainage are implemented !
9% of Masterplan Drainage are implemented!
Wet Season!
2-3 Months! Wet Season4-6 Months!!
Number of Days Flooding with different Drainage Masterplan Implementation
22
50% of Masterplan Drainage are implemented !
9% of Masterplan Drainage are implemented!
Wet Season!
2-3 Months! Wet Season4-6 Months!!
Households with Contaminated Private and Public Wells
92.8
Thousand HH
98.6
Thousand HH!
51
Thousand HH
58.5
Thousand HH! 20% well are contaminated!
30 % wells are contaminated! Wet Season!
2-3 Months!
Wet Season! 4-6 Months!
Number of Sub-district Prone to Land Slide with different Drainage Masterplan Implementation
8
Sub-district!
19
50% of Masterplan Drainage are implemented !
9% of Masterplan Drainage are implemented!
Wet Season!
2-3 Months! Wet Season4-6 Months!!
Loss of Production Value of Fish Pond Area Covered by SLR with different Mangrove Conservation
9.0
18% of Total Suggested Areas for Mangrove Conservation!
37% of Total Suggested Areas for Mangrove Conservation!
SLR!
SRESA B1/A2!
21 cm!
SLR!
DKP Projection!
38 cm!
Loss of Fish Pond Area Covered by SLR with different Mangrove Conservation
50%
!
9!
4
0%
75%
!
18% of Total Suggested Areas for Mangrove Conservation!
37% of Total Suggested Areas for Mangrove Conservation!
SLR!
SRESA B1/A2!
21 cm!
SLR!
DKP Projection!
38 cm!
SECTION 1 – TITLE, CONTACT DETAILS AND BACKGROUND
1.1 Concept title: Water Resources Management In Dry Vulnerable Area of Semarang through Rain Harvesting Model
SECTION 2 – OUTCOMES, APPROACH, SCOPE AND
2.1 Problem definition
Why is this problem?
! what is the Climate Risk? to this being identified (e.g. Vulnerability Assessments/ Sector Studies/ SLD Meetings)
• Some of drought area (such a Mangunharjo and Kec Tembalang) have risk climate category Medium-High. In 2025 and 2050, they will expose to high risk climate category.
• People who lives in drought area
• It affected to pipeline or water supply system (infrstructure) and community development
• VA: In drought area, people will dug well to get water. It contribute land subsidence. In some of area, they need to buy water from private provider at a costly high.
• SLD 3: Rainharvesting to solve dry areas
2.2 Method
What is the intended method?
! How would it be done (what is the intended process)
! Who would do it (project owner, partners, involved institutions)
• To identify potential water resource in semarang with mapping
• To identify existing water consumption pattern and water needed projection in a future with mapping
• Local Institutional dan community strengthening by training • To set participatoy planning action to cope with climate change by
FGD and training
• DED (detail engineering design) for new water resources utilizing through rainharvesting concept
• Project Implementation • Monitoring and Evaluation
2.3 Scope
What is the estimated Cost?
• Provide a breakdown of costs by resource and time
What is the estimated timeframe?
• Is it a staged approach?
• When would outcomes be achieved or outputs delivered?
Cost
! Prefeasibility study : US$ 25,000
! DED Rain harvesting models: US$ 50,000
! Piloting and Advancing the models: US$ 100,000
! Social marketing and awarenes: US$ 50,000
! Rain harvesting installment: US$ 500,000 USD
! Monev: US$ 25,000 Timeframe
! Prefeasibility study: 6 Months
! DED Rain harvesting models: 3 Months
! Piloting and Advancing the models: 6 Months
! Social marketing and awarenes: 3 Months
! Rain harvesting installment: 1 Years
3.1 ACCCRN Principles
Does the concept challenge the ACCCRN principles in any way?
! Ecologically Sustainable Development
! Do No Harm
! Yes, It ecological sustainability development and have no ecological impact.
! This intervention doesn’t need chemical or any dangerous materials that can contribute negative impact to environtment. It expanse greenery to make the existing water resource sustainable.
3.2 Criteria 1: Contribution to building Urban climate change resilience (Credibility)
Outline how the proposal meets criteria 1.
! Based on VA, this area is Medium,Medium – High climate risk area and they will move to High climate risk in the future if we do
nothing. This intervention will help reduce the exposure of climate risk and improve coping capacity in drought area in Semarang by potential water resource management. It will interfere infrastructure system (such as pipeline) and using water resource and also find new water resource with rainharvesting system.
3.3 Criteria 2: Impact on lives of poor and vulnerable populations (Credibility)
Outline how the proposal meets Criteria 2.
! It does impact to poor and vulnerable people in drought areas in Semarang. They will have good access of water supply, especially in dry season. The management water supply and greenery can be managed by local communities.
3.4 Criteria 10:
!
Prospects for replication in other places (Replicable and scalable)Outline how the proposal meets Criteria 10.
! It could be replicate to other city in regional scale and have high potencial for wide and scale up in every drought area in ACCCRN cities, especially in steep/hill areas. Rainharvesting concept is adopted from local communities, e.g, In Bandar Lampung use a tank to catch the rainfall. What we do now is how to distribute and manage the water resource and how the poor and vulnerable people have good access and can get it cheap.
3.5 Criteria 11: Ability to achieve scale (Replicable and scalable)
Outline how the proposal meets Criteria 11.
SECTION 1 – TITLE, CONTACT DETAILS AND BACKGROUND
1.1 Concept title: Disaster Risk Reduction through developing shelter in flood area
SECTION 2 – OUTCOMES, APPROACH, SCOPE AND
2.1 Problem definition
Why is this problem? y what is the Climate Risk? y who is vulnerable? y which Urban Systems are
affected?
y What is the justification? y What studies/ processes led
to this being identified (e.g. Vulnerability Assessments/ Sector Studies/ SLD Meetings)
y In 2050 SLR will be reach 21 – 38 cm
y Base on local government budget ability, drainage master plan will be achieved about 50% from all actions plan.
y Currently, implementation of drainage master plan is only 9% with own local government financial ability. Every year local government have ability to implement just 1% from all action plan in drainage master plan without development aid from others resource.
y Consequence of that situation is more than 7% of coastal area will getting flood in 2050.
y Now, it is about 51,000 household have flood disaster vulnerability and it will be increase until 98,000 household in 2050, or growing about 1,200 household per year with trend of drainage master plan implementation about 1% per year.
y VA and sectoral studies show flood disaster give impact to loss of assets, to damage of infrastructure and public facilities, and health problems.
y People who rich and has a family will move or evacuate to out of there are, but for poor people especially who hasn’t family, so they don’t have option or capacity to move from their area.
y It is needed to develop flood shelter as a evacuation place for community during flood.
y Flood shelter is expected to reduce victims of flood disaster because they have save evacuation shelter.
2.2 Method
What is the intended method? y How would it be done (what
is the intended process) y Who would do it (project owner, partners, involved institutions)
y Feasibility Study for flood shelter in flood area in Semarang City
- Flood risk mapping and potential location for community evacuation
- Deciding effective and efficient for shelter
- Developing alternative for shelter shape with new building or improving existing building (public facilities)
y DED for flood shelter development
y Shelter construction which appropriate with location characteristic and technology
y Developing disaster risk reduction system for flood disaster in Semarang, which flood shelter as a main component for flood evacuation.
2.3 Scope
What is the estimated Cost? y Provide a breakdown of
costs by resource and time
y What is the estimated timeframe?
Cost
y Feasibility study : US$ 30,000
y DED for flood shelter development : US$ 30,000 y Shelter construction : US$ 100,000
y Developing disaster risk reduction system : US$ 50,000