(IJSBAR)
I SSN 2 3 0 7 - 4 5 3 1 (Print & Online)
http://gssrr.org/index.php?journal=JournalOfBasicAndApplied
The Difference of Capital Structure Based on Ownership,
Variance, and Correlation: Venture Capital Firms in
Indonesia
Andi Buhari
a*, Noer Azam Achsani
b, Mangara Tambunan
c, Tubagus Nur
Ahmad Maulana
da
Graduate School of Management and Business, Bogor Agricultural University (IPB), Indonesia b
Graduate School of Management and Business, Bogor Agricultural University (IPB), Indonesia c
Graduate School of Management and Business, Bogor Agricultural University (IPB), Indonesia d
Graduate School of Management and Business, Bogor Agricultural University (IPB), Indonesia a
Most Small and Medium Enterprises (SMEs) and start up are widely viewed as unbankable and have various
obstacles, such as weak management and lack of collaterals, in accessing funding sources. In Indonesia, venture
capital (VC) is expected to become as an alternative mode of financing for SMEs and start up, hence VC firms’
capital structure is matters. The study aims to analyze the capital structure of VC firms in Indonesia using econometric
model of ANOVA, difference test, and bivariate analysis test. This study is utilizing monthly financial statements for
six years period (2009-2014) of 27 samples out of 58 VC firms total population in Indonesia. Debt to Equity
Ratio (DER) is proxy for capital structure which is hypothesized severally correlated with Total Asset (TA),
Return on Equity (ROE), Current Ratio (CR), Non-Performing Investment (NPI), and Earning Asset Ratio
(EAR).
---
* Corresponding author.
The study finds that there is a variance of VC firms’ capital structure in Indonesia which is dominated by
debt/loan rather than capital. Moreover, there is a significant difference of capital structure between
government-owned VC firms and private VC firms where government-owned VC firms have a stronger capital
structure (DER = 122.16%) compared to private VC firms (DER = 260.70). The study also reveals that asset
size (TA), profitability (ROE), liquidity (CR), asset quality (NPI), and earning asset structure (EAR) respectively
have a correlation to the capital structure (DER) of VC firms.
Keywords: Capital structure; Indonesia; SMEs; start up; venture capital.
1. Introduction
The funding for SMEs is not only from banks. Reference [1] stated that venture capital (VC) has the potential to
become an alternative funding sources for start up and early stages as part of SMEs productive sectors. VC
focuses on providing capital to companies that have growth prospects, value creation, and feasible although
unbankable. In addition, References [2] and [3] stated that VC provides a model of entrepreneurship with equity,
debt, or hybrid financing, usually with direct involvement in management.
VC typically invests in companies in early stage but having the capacity for rapid growth and supported by
high-technology. Several well-known companies in the United States, Europe, Australia, and Asia were initially
supported by VC firms, among others Google, Youtube, Apple, Wang Computer, eBay, Formula-1, Myer,
Fitness First, Genentech, Kentucky Fried Chicken, Haagen Daz Ice Cream, IBM, HP, Intel, Lotus, Microsoft,
Air Asia, Alam Maritim, and Burger King [4,5,6,7,8].
Reference [9] noted that VC firms play an important role in promoting entrepreneurs, hence in some countries
the government supports the growth of VC industry. In Indonesia, VC firms are expected to be one of solutions
for funding sources to the SMEs. For that purposes, VC firms should have strong capital structure. The capital
structure is more important considering that the main activity of VC firms’ investment is in equity participation.
It is not possible to invest in equity participation with the funding sources from short-term debts including bank
loan since it will lead to the mismatch.
According to Otoritas Jasa Keuangan [OJK] (Financial Services Authority of Indonesia), the number of VC
firms in Indonesia decreased from 89 in 2012 to 73 in 2013, 67 in 2014 and then to 58 in the second quarter of
2015. In addition, although total asset of VC industry in Indonesia is still growing but the composition of
earning assets particularly equity participation (EP) portion is continuously decreased. In 2012, earning assets
consist of 79% EP but in 2013 has been lowered to 68% and dropped to 14.5% in the second quarter of 2015.
That condition indicates VC industry in Indonesia has certain problem. According to [10], profitability is one of
the main issues that made companies to stay or leave the industry.
In terms of market share, total asset of VC industry is still small compared to non-bank financial institutions,
such as multifinance industry. Reference [11] noted that multifinance industry’ assets grew 4.33 times in the last
10 years with total assets of IDR 420.4 trillion in 2014. While, VC industry only grew 2.17 times in the last 10
years with total assets is only 2.14% of multifinance industry. Total assets are essential for the firms as
indicators of size, financial strength, and operational activities. Therefore, well-established big firms may easier
to access funding sources and capital market [12,13,14].
In the midst of that situation, many foreign-based VC firms with strong capital and funding sources enter the
Indonesian market and invest in many start up business as well as e-commerce companies such as Gojek
(Northstar Group, Sequoia Capital), tokopedia (Cyberagent Ventures, Softbank Internet and Media (Sequoia
Capital), Berrybenka (East Ventures, Transcosmos, Gree Ventures), Scoop (Kompas Gramedia, Mitsui, Gobi
Partners), Qraved (500 Startups, Rebright Partners, Convergence Ventures), Berrykitchen (East Ventures),
Bilna.com (CyberAgent Ventures, East Ventures, DG) and Bukalapak (Aufan, 500 startups, IREP, Gree
Ventures) [15]. The domestic market and potential start up and SMEs could be taken over by foreign-based VC
firms, if local VC firms failed to finance them due to some obstacles such as capital structure and funding
sources problems.
For instance, previous studies in capital structure by [16,17,18,19,20,21,22,23] prevailed that there is a
relationship between size and other financial determinants to the capital structure of certain industries in some
countries. Additionally, the capital structure is also related to the corporate strategy to run the activities of the
firms. However, the study about the VC firms’ capital structure in Indonesia has not been found.
1.1. Purpose of the Study
The study aims to analyze the capital structure of VC firms in Indonesia in order to know the variance of capital
structure among VC firms, the difference of capital structure between government-owned VC firms and private
VC firms, the relationship of certain financial parameters with the VC firms’ capital structure in Indonesia.
1.2. Significance of the Study
This study is expected could give benefits to the public, financial society, business and start up/SMEs as well as
investors. In addition, the results of the study can be used by VC practitioners for planning and making decision
related to financial aspects of the VC firms; by government, law maker, and financial authority to review
policies related to the VC industry; and indeed for academic purposes to the literature, particularly capital
structure and venture capital.
2. Literature Review
2.1. Venture Capital
Venture Capital (VC) is the capital invested in certain business (investee companies) within a specified period in
order to earn return and gain [24,25,26,3,27,28]. According to [7,29,30], VC firms invest in seed, start up or
early stages companies and the expansion phase together with involving in the management. Hence, the role of
VC firms is not only for financing but also supporting the entrepreneurship.
2.2. Capital Structure
Capital structure is a mix of short-term debt, long-term debt, preferred stock and common stock combined to
finance the company. The financial structure of firms is reflected by the composition of liabilities that describes
the source of funds [31]. Reference [17] stated that the proportion of funding in the form of debt and equity
capital in the company is defined as capital structure.
Reference [32] and [17] mentioned, there are several theories of capital structure as follows: (1) Traditional
Approach Theory: the existence of an optimal capital structure; capital structure affect the value of the
company; capital structure can change in order to obtain optimal business value; (2) [33] (MM Theory; 1958) or
Irrelevance Capital Structure Theory: the theory argues that the capital structure is not affecting the value of
company; (3) Pecking Order Theory (POT) [34]: the financing order starts from retained earnings, third-party
debt or bond, and the last is new share issuance. Hence, [35] stated, the company with high profitability has a
low debt due to abundant internal funding sources. (4) Trade-Off Theory (TOT) [36,37]: there is a choice
(trade-off) between financial distress costs and tax savings (tax shields) that occur in the company. [38] found that
companies with high profitability have a low debt ratio and it is contrary to TOT. (5) Asymmetric Information
Theory and Signaling Theory. [39]: there is different information between internal parties (managers) and
external parties (investors) about the prospects and risks of the company. [30]: an action taken by the
management provides guidance and signal for investors on how to look at the prospects of the company. [40]
stated that high prospect company will avoid the issuance of shares and tend to use debts. (6) Agency Theory:
management is an agent of the owner, while the owner as principal delegates the authority to an agent to act
based on interests of the owner. However, there is no guarantee that managers always act accordingly, therefore
principal provides incentives for managers and supervise them with the consequences to the agency cost [32].
The researches in capital structure for different sectors in some countries have been published in recent years. In
Indonesia, [41] released a paper about ownership and determinants capital structure of public listed companies
using panel data analysis as well as a paper about the difference of capital structure among industry sectors in
the Indonesia stock exchange [42]. Before that, [43] explored the capital structure in plantation companies in
Indonesia particularly the factors that influence it. Analysis of capital structure in corporate telecommunication
operators in Indonesia was investigated by [44], while a study in determinants of capital ratio on state-owned
banks in Indonesia was published by [45]. Moreover, testing trade-off theory (TOT) of capital structure of
Indonesian listed companies was investigated by [46], while testing on pecking order theory (POT) and analysis
of company’s characteristic effects on emitten’s capital structure was inspected by [47]. However, studies
concerning the capital structure of venture capital firms, particularly in Indonesia, have so far not been found.
2.3. Research Hypotheses
Hypotheses of the research are formulated to achieve the purpose of the study as well as based on theory or
previous empirical research findings.
To investigate the variance of VC firms’ capital structure, the alternative hypothesis is:
HA1 : There is a variance of capital structure among VC firms in Indonesia.
To investigate the difference of capital structure between government-owned VC firms and private VC firms,
the alternative hypothesis is:
HA2 : There is a difference between government-owned VC firms and private VC firms.
To investigate the relationship between certain financial parameters respectively with VC firms’ capital
structure, the alternative hypotheses are:
HA3 : There is a correlation between asset size and VC firms’ capital structure.
HA4 : There is a correlation between profitability and VC firms’ capital structure.
HA5 : There is a correlation between liquidity and VC firms’ capital structure.
HA6 : There is a correlation between asset quality and VC firms’ capital structure.
HA7 : There is a correlation between earning asset structure and VC firms’ capital structure.
3. Methods
This quantitative study is conducted in Indonesia, uses parametric statistical methods with econometric
approach including analysis of variance (ANOVA-F test), difference (Z test), and correlation. The study utilizes
secondary data of 27 samples out of 58 VC firms’ total population in Indonesia in the second quarter of 2015.
Data collected from monthly financial statements for the period 2009-2014 in order to provide some financial
ratios used in this study. In particular to investigate the difference of VC firms’ capital structure, the samples is
grouped into 2 (two) categories which are 12 government-owned VC firms (>50% ownership) and 15 private
VC firms. The capital structure uses debt to equity ratio/DER as proxy to measure capital structure for the
variance of capital structure among VC firms, the difference of capital structure between government-owned
and private VC firms, as well as the relationship between certain financial parameters respectively with VC
firms’ capital structure. Beside DER, financial ratios used in this study are total asset/TA (as proxy of asset
size), return on equity/ROE (as proxy of profitability; earnings after tax divided by total equity), current
ratio/CR (as proxy of liquidity; current assets divided by current liabilities), non-performing investment/NPI (as
proxy of asset/investment quality; total NPI divided by total earning assets), earning asset ratio/EAR (as proxy
of earning asset structure; total earning asset divided by total asset).
4. Results and Discussion
4.1. Descriptive Statistics
Based on the result of data processing using SPSS, the study reveals that VC firms’ capital structure in
Indonesia is on average 136.95% meaning that the total loan used for the company's operations is greater than
the total capital owned by the companies. In addition, it is found that on average VC firms have total assets in
the amount of IDR 40.82 billion, ROE 2.33%, CR 296%, NPI 17.15%, and EAR 89.57%.
4.2. The Variance of VC Firms’ Capital Structure in Indonesia
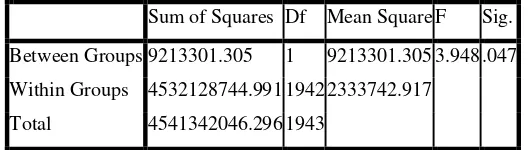
The ANOVA test was performed to investigate the variance of VC firms’ capital structure in Indonesia. The
result is shown in Table 1.
Table 1: Result of ANOVA test
Sum of Squares Df Mean Square F Sig.
Between Groups 9213301.305 1 9213301.305 3.948 .047
Within Groups 4532128744.991 1942 2333742.917
Total 4541342046.296 1943
Source: SPSS output
The result shows that there is a variance of capital structure among VC firms in Indonesia as measured by the
average value of DER with a significance value of 0.047 < 0.05. Therefore, the alternative hypothesis (HA1) is
not rejected.
The diversity of the capital structure among VC firms in Indonesia may be caused by differences in management
policy related to the allocation of fund resources for the business activities which are derived from debt and
equity. In other words, the VC firms by design have different ways to obtain as well as to utilize their funds. In
contrary, the variance condition in VC firms’ capital structure can also caused by difficult circumstances where
certain firms, for example, have a negative position in their equity due to some previous losses (suffering
negative profit).
4.3. The Difference of VC Firms’ Capital Structure Based on Ownership
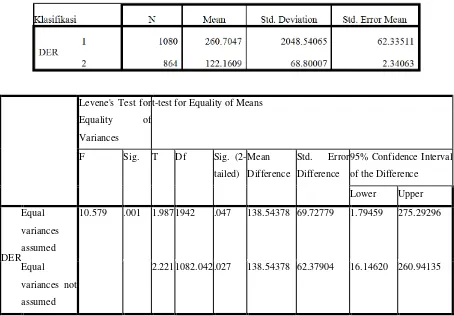
The Independent sample test was performed to investigate the difference of capital structure based on ownership
(shareholding) that is between VC firms majority owned by the government and VC firms owned by
non-government (private). The result is in Table 2.
The Table 2 shows that there is a significant difference of the capital structure between VC firms majority
owned by the government and VC firms owned by non-government (private), with a significance value of 0.001
< 0.05. Therefore, the alternative hypothesis (HA2) is not rejected.
The average capital structure (DER) for VC firms owned by the government is 122.16% (N = 864), while
private VC firms is 260.70% (N = 1080). Therefore, the VC firms owned by the government have a better
capital structure, hence a lower dependence on funds from external debt. This phenomenon also shows that there
is a good support from the government to their affiliated VC firms in providing funding sources in the form of
capital. In contrary, VC firms owned by non-government (private) should try harder to obtain funding from
external sources to run their business.
Table 2: Result of difference test
2.221 1082.042 .027 138.54378 62.37904 16.14620 260.94135
Source: SPSS output
Those results support the previous studies where the government in some countries plays an important role in
supporting the VC industry in their respective countries. The studies by [48]; [49]; [50] in the United States and
Canada; [51] in France; [52] in Brazil; [53] in Japan; [54] in China; and [55] in Malaysia, revealed that
government provided supports in some ways in order to grow the VC industry in their respective countries. The
government concerns among others are in the form of capital injection through VC firms devoted to SMEs and
start up business, to provide the venture funds supported by the government bodies, and create a favorable
regulatory support.
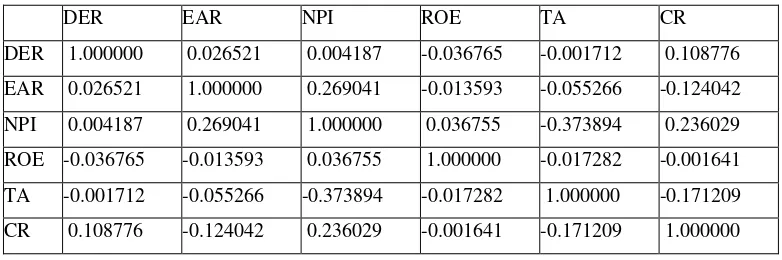
4.4. The Correlation Between Some Financial Parameters and VC Firms’ Capital Structure
The study uses bivariate analysis test was performed to investigate the relationship between some financial
parameters and the capital structure of the VC firms. The tests with SPSS severally inspect the correlation
between VC firms’ capital structure with total asset (TA), return on equity (ROE), current ratio (CR),
non-performing investment (NPI), and earning asset ratio (EAR). The results are shown in Table 3.
This test aims to determine whether there is a relationship between some financial parameters with the capital
structure of VC firms. Bivariate correlation analysis tests the relationship between two variables that
theoretically can be: perfectly not correlated (r = 0), perfectly correlated (r = 1), or in between of the two
figures. The test results are shown in Table 3 above.
Table 3: Result of bivariate analysis test
DER EAR NPI ROE TA CR
DER 1.000000 0.026521 0.004187 -0.036765 -0.001712 0.108776
EAR 0.026521 1.000000 0.269041 -0.013593 -0.055266 -0.124042
NPI 0.004187 0.269041 1.000000 0.036755 -0.373894 0.236029
ROE -0.036765 -0.013593 0.036755 1.000000 -0.017282 -0.001641
TA -0.001712 -0.055266 -0.373894 -0.017282 1.000000 -0.171209
CR 0.108776 -0.124042 0.236029 -0.001641 -0.171209 1.000000
Source: SPSS output
The correlation between Total Asset (TA) and DER shows that there is a negative relationship with r =
-0.001712, so that the greater of total asset, the smaller of DER. Therefore, the alternative hypothesis (HA3) is not
rejected. This result supported the studies conducted by [32,56,57] mentioned that generally in developing
countries, companies prefer equity as source of funds rather than debt. Moreover, the companies which have
greater asset may tend to use the source of funds from the equity than debt, since bigger value of companies’
asset could attract the investors to funding the companies.
For relationship between Profitability (ROE) and DER, the results shows that there is a negative relationship
with r = -0.036765, it means that the greater of the VC firm profitability, the smaller of DER. Therefore, the
alternative hypothesis (HA4) is not rejected. This result is consistent with the Pecking Order Theory (POT) as
proposed by [30], that a company with high profitability tends to have a low debt due to a much of internal fund
sources. The results supported by previous studies i.e. [32] and [58].
The correlation between Liquidity (CR) and DER shows that there is a positive relationship with r = 0.108776,
it means that the higher of DER derived from debt would improve the company's liquidity. Therefore, the
alternative hypothesis (HA5) is not rejected. This supports the implementation of asset and liability management
(ALMA) in business and finance in which the management may use the fund resources derived from debt
(short-term) to meet the liquidity needs of the company, while for capital expenditure the management may use
the equity (long-term) for their funding sources.
For relationship between Asset Quality which is proxied by Non-Performing Investment (NPI) and DER, the
results shows that there is a positive relationship between NPI and DER with r = 0.004187. Therefore, the
alternative hypothesis (HA6) is not rejected. Meaning that NPI could become a reflection of financial risk
management in which the lower NPI is resulted from a better risk management performance. It may attract new
investors to invest and to provide a funding to the firms. For existing shareholders, a good performance of risk
management (lower NPI) would encourage them to keep dividends as retained earnings to be reinvested in the
companies.
The correlation between Earning Asset Ratio (EAR) and DER shows that there is a positive relationship with r =
0.026521, so that the higher of EAR, the greater of DER. Therefore, the alternative hypothesis (HA7) is not
rejected. The results are caused by the fact that the biggest portion of VC financing to investee companies in
Indonesia is dominated by the scheme of profit or revenue sharing about 70%, followed by equity participation
19%, and convertible bonds about 11% [10]. Most of VC firms’ portfolio is in short-term financing (not more
than 3 years tenor) driven by sources of fund dominated by commercial debt/loans from banks and other
institutions. Therefore, it is difficult for VC firms to provide a long-term financing such as equity participation.
5. Conclusions
SMEs including start up and early stage business generally have problems in accessing funding sources,
particularly in the developing countries such as Indonesia. Most SMEs are considered unbankable, high risk, and
having various obstacles such as weak management and lack of collaterals. Hence, VC is expected to become
alternative solution by providing equity financing with a long-term tenor. Nevertheless, this study finds that there
is a significant variance of the capital structure among VC firms in Indonesia with average DER is 136.95% (1.37
times). This result indicates that VC firms’ capital structure in Indonesia is majority derived from debt in which
most VC firms currently use loans from banks and other sources to finance their business activities. The debt
from banks or other creditors with a short-term tenor cannot be used by VC firms to finance their investee
companies (SMEs and start up) in the form of equity participation. Equity participation is considered as the
nature of venture capital which could give value proposition for the VC firms’ customers compared to other
financial institutions.
In terms of ownership, there is a significant difference in the capital structure between the government-owned
VC firms and private VC firms. The VC firms majority owned by the government (> 50% ownership) have a
better capital structure with DER = 122.16% compared to private VC firms with DER = 260.70%. The bivariate
analysis test reveals that there is a relationship between some financial parameters respectively and the capital
structure of the VC firms. The tests severally confirms that there is a correlation between VC firms’ capital
structure with total asset (TA), return on equity (ROE), current ratio (CR), non-performing investment (NPI), and
earning asset ratio (EAR).
The paper is subject to the limitation in which the study only examines VC firms’ population (58 VC firms) in
Indonesia which is registered in the Financial Services Authority (FSA) in the second quarter of 2015. Other VC
firms (most of them are foreign-based) which are in fact operating in Indonesia at this time but not registered in
the FSA are not included in this study.
6. Recommendations
It is recommended that to enhance the role of VC firms/VC industry in Indonesia, particularly as funding
sources for SMEs and start up, the stakeholders including the government, the FSA, the law maker, the
Association of Indonesian Venture Capital Firms (AMVI), as well as VC practitioners, are expected to
undertake strategic steps and initiatives to operationalize the program of “the revitalization of venture capital in
Indonesia”. Action to be prioritized among others is to strengthen the capital of the VC firms through capital
raising program. Furthermore, the establishment of venture funds through the mobilization of potential funding
sources initiated and sponsored by the government is quite urgent to be realized. Simultaneously, the
management of the VC firms has to do some efforts to improve the VC firms’ financial performance in order to
increase the investors’ level of confidence.
It is suggested to conduct further researches related to other financial aspects of VC firms in Indonesia, such as
soundness rating and risk profile. In addition, some aspects about the practices of Islamic VC in Indonesia, such
as products and schemes, are interesting topics to investigate.
References
[1] R. Oakey. “A Commentary on Gaps in Funding For Moderate ‘Non-Stellar’ Growth Small Businesses
in the United Kingdom.” Venture Capital: An International Journal of Entrepreneurial Finance, vol.9,
no.3, pp. 223-235. 2007.
[2] C. Zott . “Information, Learning and Decision-Making: Applications to Venture Capital Finance and
Strategic Management .” PhD Dissertation. The University of British Columbia. Canada. 1998.
[3] T.A. Poetra. “Keunggulan modal ventura dan kelemahan modal ventura.” Internet:
http://tantra-agistya.blogspot.com/2012/03/modal-ventura.html., 2012 [Sep. 27, 2014].
[4] M. Wright and K. Robbie. “Venture Capital and Private Equity: a Review and Synthesis.” Journal
Business, Finance and Accounting, vol.24, pp.521–570. 1998.
[5] M. Fuady. Hukum tentang Pembiayaan dalam Teori dan Praktek. Bandung: Citra Aditya Bakti. 1999.
[6] A. Metrick. Venture Capital and the Finance of Innovation. John Wiley & Sons. 2006.
[7] PriceWaterhouseCoopers (PwC). “Global Private Equity Report.” 2008.
[8] D. Hussain. “Workshop on Financing for ASEAN MSME in the 21st Century”. Malaysian Venture
Capital & Private Equity Association. 2011.
[9] R.B. Hasan, S.A. Mikail and M. Arifin. “Historical Development of Islamic Venture Capital: an
Appraisal.” Journal of Applied Sciences Research, vol.7, no.13, pp.2377-2384. 2011.
[10] M.R. Baye. Managerial Economics and Business Strategy, 7th edition. McGraw-Hill International.
2010.
[11] Otoritas Jasa Keuangan (OJK). “Statistik 2014 dan Direktori Lembaga Pembiayaan”. 2015.
[12] N. Fidyati. “Faktor-Faktor yang Mempengaruhi Kebijakan Hutang Perusahaan.” Jurnal Ekonomi,
Manajemen & Akuntansi, vol.1, no.1, pp.17-34. 2003.
[13] Wahidahwati. “Pengaruh Kepemilikan Manajerial dan Kepemilikan Institusional pada Kebijakan
Hutang Perusahaan: Sebuah Perspektif Theory Agency.” Jurnal Riset Akuntansi Indonesia, vol.5, no.1,
pp.1-16. 2002.
[14] J.F. Weston and E.F. Brigham. Essentials of Managerial Financial, 9th edition. London (UK): The
Dryden Press. 1990.
[15] Forbes Indonesia. “Smarter E-Economy.” November 2015 Edition. vol.6, no.11. 2015.
[16] W.H.B. Ayed and S.G. Zouari. “Capital Structure and Financing of SMEs: the Tunisian Case.”
International Journal of Economics and Finance, vol.6, no.5. 2014.
[17] I.B.G.N.S. Adiyana and P.A. Ardiana. “Pengaruh Ukuran Perusahaan, Risiko Bisnis, Pertumbuhan
Aset, Profitabilitas dan Tingkat Likuiditas pada Struktur Modal.” E-Journal Akuntansi Universitas
Udayana, vol.10, no.1, pp.14-30. 2014.
[18] A.H. Manurung. Teori Keuangan Perusahaan. Jakarta (ID): PT. Adler Manurung Press. 2012.
[19] S. Panda. “Factors Affecting Capital Structure of Indian Venture Capital-backed Growth Firms.” South
Asian Journal of Management, vol.19, no. l, pp.98. 2012.
[20] Joni and Lina. “Faktor-Faktor yang Mempengaruhi Struktur Modal.” Jurnal Bisnis dan Akuntansi,
vol.12, no.2, pp.81-96. 2010.
[21] J. Lopez-Gracia and F. Sogorb-Mira. “Testing Trade-off and Pecking Order Theories Financing
SMEs.” Small Business Economics, vol.31, pp.117-136. 2008.
[22] Saidi. “Faktor-faktor yang Mempengaruhi Struktur Modal pada Perusahaan Manufaktur Go Public di
BEJ Tahun 1997-2002.” Jurnal Bisnis dan Ekonomi, vol.9, no.1. 2004.
[23] M. Harris and A. Raviv. “The Theory of Capital Structure.” The Journal of Finance, vol.46,
pp.297-355. 1991.
[24] A. Metrick and A. Yasuda. Venture Capital and the Finance of Innovation, 2nd edition. John Wiley &
Sons. 2012.
[25] O. Umaya. “Modal Ventura.” Internet:
http://opanumaya.blogspot.com/2013/05/devinisi-modal-ventura_9.html., 2013 [Sep. 2, 2014]
[26] L.S. Muliya and N.S. Imaniyati. Perusahaan Modal Ventura: Dalam Perspektif Hukum Bisnis dan
Hukum Islam. Bandung: Fakultas Hukum Universitas Islam Negeri Bandung. 2008.
[27] H. Dipo. Sukses Memperoleh Dana Usaha, Dengan Tinjauan Khusus Modal Ventura. Jakarta: Pustaka
Utama Grafiti. 1993.
[28] A. Budisulistyawati. “Karakteristik Modal Ventura Sebagai Lembaga Pembiayaan.” Yustisia, vol.68.
2006.
[29] A. Jalil. “Islamic venture capital: a new source of Islamic equity financing.” Conference Paper ESSET,
Bangi, Universiti Utara Malaysia. 2005.
[30] A. Muhammad and R. Murniati. Segi Hukum Lembaga Keuangan dan Pembiayaan. Bandung: PT Citra
Aditya Bakti. 2000.
[31] J.R. McGuigan, W.J. Kretlow and R.C. Moyer. Contemporary Financial Management, 11th edition.
South-Western (US): Cengage Learning. 2009.
[32] E.F. Brigham and J.F. Houston. Dasar-dasar Manajemen Keuangan. Ali Akbar Yulianto (penerjemah).
Jakarta: Salemba Empat. 2006.
[33] F. Modigliani and M. Miller. “The Cost of Capital, Corporation Finance and The Theory of
Investment.” American Economic Review, vol.48, no.3, pp.261-297. 1958.
[34] G. Donaldson. “Corporate Debt Capacity: a Study of Corporate Debt Policy and the Determination of
Corporate Debt Capacity.” Division of Research. Harvard Graduate School of Business
Administration. Boston. 1961.
[35] S.C. Myers. “Capital Structure.” The Journal of Economic Perspectives, v ol.15, no.2, pp.81-102.
2001.
[36] J.E. Stiglitz. “Are-Examination of the Modigliani-Miller Theorem: American Economics.” vol.28,
no.1, pp. 167-187. 1969.
[37] R. Haugen R and J.L. Pappas. “Equilibrium in the Pricing of Capital Assets, Risk-Bearing Debt
Instrument, and the Question of Optimal Capital Structure.” Journal of Financial and Quantitative
Analysis. vol.6 no.3, pp.943-953. 1971.
[38] C.N. Zonenschain. “The Capital Structure of Brazilian Companies.” n.a.
[39] S.C. Myers and Majluf. “Corporate Financing and Investment Decisions When Firms Have
Information that Investors Do Not Have.” Journal of Financial Economics, vol.13. 1984.
[40] Mamduh. Manajemen Keuangan, Edisi 1. Yogyakarta (ID): BPFE. 2004.
[41] A.T. Hardiyanto, N.A. Achsani, R. Sembel and T.N.A. Maulana. “Ownership and Determinants
Capital Structure of Public Listed Companies In Indonesia: A Panel Data Analysis.” International
Research Journal of Business Studies, vol.6, no.1. 2013.
[42] A.T. Hardiyanto, N.A. Achsani, R. Sembel and T.N.A. Maulana. “The Difference of Capital Structure
Among Industry Sectors in the Indonesia Stock Exchange.” Business and Management Review, vol.3,
no.08, pp.28-35. 2014a.
[43] A. Munawar. “Struktur Kapital Perusahaan Perkebunan di Indonesia, Kebijakan, Faktor-Faktor yang
Mempengaruhi dan Dampaknya Terhadap Kinerja Perusahaan.” Disertasi Doktor. Bogor: Institut
Pertanian Bogor. 2010.
[44] P.M.T. Sitorus, D.S. Priyarsono, A.H. Manurung and T.N.A. Maulana. “Analysis of Capital Structure in Corporate Telecommunications Operators in Indonesia.” International Journal of Economics and Management Engineering, vol.4, no.3, pp.64-69. 2014.
[45] P.G. Raharjo, D.B. Hakim, A.H. Manurung and T.N.A. Maulana. “Determinant of Capital Ratio: A Panel Data Analyisis on State-Owned Banks in Indonesia.” Buletin Ekonomi Moneter dan Perbankan, vol.16, no.4. 2014.
[46] A.T. Hardiyanto, N.A. Achsani, R. Sembel and T.N.A. Maulana. “Testing Trade-Off Theory of Capital
Structure: Empirical Evidence from Indonesian Listed Companies.” Economics and Finance Review,
vol.3, no.06, pp.13-20. 2014b.
[47] T. Noor, B. Sinaga and T.N.A. Maulana. “Testing on Pecking Order Theory and Analysis of
Company’s Characteristic Effects on Emitten’s Capital Structure.” Indonesian Journal of Business and
Entrepreneurship, vol.1, no.2. 2015.
[48] S. Kaplan and A. Schoar. “Private Equity Performance: Returns, Persistence, and Capital Flows.”
Journal of Finance, vol.60, pp.1791-1823. 2005.
[49] P. Gompers and J. Lerner. The Venture Capital Cycle, 2nd edition. The MIT Press. Massachusetts
Institute of Technology. 2004.
[50] Macdonald & Associates Ltd. “Venture Capital in Canada: Annual Statistical Review and Directory.”
Association of Canadian Venture Capital Companies: Toronto. 1996.
[51] K. Medjad, E. Krieger, V. Gerasymenko, R. Grandsart and Iselin. “You Said Successful? Actual and
Perceived Performance of Venture Capital in France.” International Journal of Business, vol.16, no.4.
2011.
[52] C.C.M. Ramalho. “Private Equity and Venture Capital: An Important Public Policy Towards Innovation
and Entrepreneurship in Brazil.” Internet: http://www.anpad.org.br/admin/pdf/gct2784.pdf., 2010 [May
18, 2014].
[53] D. Cumming, G. Fleming and A. Schwienbacher. “Financial Intermediaries, Ownership Structure and
the Provision of Venture Capital to SMEs: Evidence from Japan.” Small Business Economy, vol.31.
2008.
[54] X.E. Xu. “Comparative Study of Venture Capital Performance in the US and Europe.” The Journal of
Entrepreneurial Finance, vol.9, no.3. 2004.
[55] Securities Commission. “Legislation Guidelines on Venture Capital.” Internet:
http://www.sc.com.my/legislation-guidelines/venture-capital/., 2014 [Sep. 6, 2014].
[56] A. Singh and Hamid. “Corporate Financial Structure in Developing Countries”. Working Paper. 1992.
[57] A. Singh. “Corporate Financial Patterns in Industrialising Economies – A Comparative International
Study.” IFC Technical Paper No.2, Washington D.C: International Finance Corporation. 1995.
[58] R.P. Indahningrum and R. Handayani. “Pengaruh Kepemilikan Manajerial, Kepemilikan Institusional,
Dividen, Pertumbuhan Perusahaan, Free Cashflow dan Profitabilitas Terhadap Kebijakan Hutang
Perusahaan.” Jurnal Bisnis dan Akuntansi, vol.11, no.3, pp.189-207. 2009.