ISSN: 2333-6080(Print), 2333-6099(Online) Copyright © The Author(s). All Rights Reserved. Published by American Research Institute for Policy Development DOI: 10.15640/jmm.v4n1a12 URL: https://doi.org/10.15640/jmm.v4n1a12
Does Fear of New Car Technologies Influence Brand Loyalty Relationship?
Syahida Abd Aziz1
Abstract
The increasing importance of technology in our daily lives has led companies to implement the latest technology on their products before marketing them to their customers. In this era of technology, fuel efficient vehicles have attracted a great deal attention with a rapidly increasing customer base in the automotive industry. Automobile companies use this as a means of increasing customers’ level of loyalty, due to the anxiety about the system installed in their cars. The purpose of this study is to investigate the indirect effects of brand service quality and brand value towards brand loyalty moderated by technology anxiety. Since moderator variables are rarely tested in the context of PLS model, the author will analyze the data by utilizing Partial Least Square (PLS) in measuring the moderating effect of technology anxiety in brand loyalty relationships. The results illustrate that technology anxiety, one of factors of Car Technology Acceptance Model (CTAM), moderates the relationship between brand service quality, brand value and brand loyalty.
Keywords: Brand Service Quality, Brand Value, Technology Anxiety, Brand Loyalty, CTAM Introduction
Nowadays, technology is part of daily life. People look forward to products that offer advanced technological systems which can improve their way of doing things (i.e. during driving). The rapid growth of technology systems adopted in the automotive industry has forced automakers to embed high technology systems into their manufactured cars in order to gain competitive advantages which could increase anxiety level among the automotive consumers (i.e. driver). In the context of this investigation, customers’ feeling (i.e. anxiety) toward the technology installed in their car shall be an important point to understand the intention of the customers to repeat their purchase when purchasing a car. However, Osswald et al. (2012) noted that there is high anxiety level in the public towards technologically advanced cars, which is considered as poor customer behaviour.
Besides, as the population in industrialized countries like North America, E urope, and Japan grows slowly, customer loss can be disastrous to companies. This is due to a smaller number of available new customers to replace those who leave (Blackwell et al., 2012). From the context of this study, a slow growing population in a developing country like Malaysia, has caused automotive companies difficulties in gaining new customers (MIDA, 2012). Therefore, retaining their existing customers is the best way to increase their market share and profitability. In accordance with the situation above, Malaysia which is a previously overlooked country due to its political instability has started to gain more and more international attention. Tight competition in the business environment has urged companies to take action in building close relationships with their customers and encourage a long-term relationship.
Due to this phenomenon, establishing and maintaining brand loyalty is not be easily achieved by companies as the services offered to customers were unsatisfactory and the delivery slow, despite of the product quality (E s, 2012).
1
Therefore, marketers need to take this phenomenon seriously as service quality can help them to achieve sustainable competitive advantage and customer brand loyalty (Yarimoglu, 2014). Moreover, companies are being forced to embedded excellent value into their products and service as individuals today are able to switch brand easily due to the variety brands present in the market (Koller et al., 2011). Thus, companies need to understand the determinants of brand loyalty among existing and potential customers.
This topic is expected to become a priority in brand building, especially in fast growing and emerging markets (Meyer, 2014). It is well accepted by scholars and practitioners in the marketing field that it is at least five times more cost efficient to retain the existing customers compared to attracting new customers (Oladele and Akeke, 2012). Brand loyalty is however, a much used and abused term. Although it is widely utilised, many scholars investigate different determinants of customer brand loyalty, resulting in a lack of consistency in findings of the investigation (E s, 2012; Thompson et al., 2010; Sugiati et al., 2013; K assim et al., 2014). The frequent assumption is that a satisfied customer is the reason for customer to repeat a purchase from the same supplier (Alex and Thomas, 2011; Chinomona and Sandada, 2013; Goel, 2014). However, many other factors could influence customers to repeat the purchase. Therefore, this investigation aims to bridge the research gap by exploring and examining key factors that influence brand loyalty, as well as the moderating role of technology anxiety in strengthening the relationship between brand service quality and brand value towards brand loyalty.
Literature Review
Since 1950s, marketing researchers have conducted several research in the context of branding (Bastos and Levy, 2012) due to the importance of increasing sales (Li and Green, 2011). Historically, brand loyalty was explained only in terms of customer behavior (i.e. repeat purchase) and since 1969, Day launched a two dimensional concept which includes attitudinal and behavioural (Sivarajah and Sritharan, 2014). However, due to insufficient findings regarding the two dimensions of customer loyalty, researchers in the marketing field added another dimension known as composite (K aur and Soch, 2013; Tabaku and Kushi, 2013). Therefore, the three dimensions (i.e. attitudinal, behavioral and composite) are necessary to understand and measure the level of brand loyalty (Chuah et al., 2014).
In an increasingly innovative and aggressive business environment, fierce competition exists between firms. One of the key success factors of firms is how customers perceive the quality of service that is offered to them (Auka et al., 2013), as it determines their level of satisfaction (Ivanauskienė and Volungėnaitė, 2014). This is because, the profits and sales of a company depend on the behaviour of customers (Rahman, 2014). Therefore, it is important for firms to focus not only on improving the quality of their products to create an intention to purchase, but also to improve the quality of their services. In the past, little effort has been spent in maintaining a relationship with customers after they purchased goods in the retail business even though the brand service quality was found to encourage customers to do repeat purchase and remain loyal to the brand (Auka et al., 2013). Brand service quality is acknowledged as the positive attitudes of customers towards a brand (Chinomona et al., 2013). However, offering high quality service is not the only way to increase the level of brand loyalty among customers, as anxiety towards technological tools installed in cars also play a vital role in influencing buyers’ brand loyalty.
In the business world of today, every company tries to grab the attention of their potential customers by embedding high value into their products. Brand value is an important element in gaining the competitive advantage (Sugiati et al., 2013). It could be defined as what customers think of the brand, including the gap between the price paid and the benefit gained from the products offered by the firms (Thaichon et al., 2013). Customers who view a product or service as having more value than their expectations will encourage them to do repeat purchase with the same company (Alex and Thomas, 2011; Goel, 2014) and it can be measured by examining whether this brand is offering a reasonable and fair price as well as giving a high value for the money spent in purchasing a product instead of the competitors (Auka et al., 2013). Focusing on brand value helps firms to maintain a longer relationship with customers as it builds trust towards the products’ brand (Hanzaee and Andervazh, 2012) that will finally lead to brand loyalty (Geçti and Zengin, 2013).
Additionally, with the latest technology, auto manufacturers currently produce numerous fuel-efficient cars believed to be able to protect the environment, in response to reports that transportation is responsible for about 20 percent of the global greenhouse gas emissions released into the air (Benthem and Reynaert, 2015). Furthermore, technology can be used as one of the preventive tools in providing greater safety and avoiding theft (Laguador et al., 2013). Therefore, consumers prefer to purchase a safer car which includes additional safety features such as airbags, antilock brake systems and anti-theft alarm systems.
More recently, researchers demonstrated the benefits of technology in the automotive industry, especially in providing safety in terms of information, safety environment and driving tasks assistance (Osswald et al., 2012). The message here is clear: A lower anxiety of technology increases trust towards a brand, while high anxiety reduces trust towards the brand. Once the customers place their trust in a brand, they intend to remain loyal with the brand. In relation to customer behaviour in technology related industries, it is recognized that the relationship between the infrastructure of technology and customer intention is moderated by technology anxiety (Yang and Forney, 2013). Therefore, technology anxiety is believed to play a role in strengthening brand loyalty relationships.
In previous studies, researchers employed Technology Acceptance Model (TAM) and Car Technology Acceptance Model (CTAM) in order to measure the level of anxiety among users towards technology (Osswald et al., 2012; Gelbrich and Sattler, 2014). CTAM is an extension of Unified Theory of Acceptance and Use of Technology (UTAUT). The theory of UTAUT was primarily developed to explain and predict users’ acceptance towards technology from the context of the organization. Since the UTAUT model has only been used to measure anxiety in context of computers (Yang and Forney, 2013) and not from the context of other technological system such as technology usage in car (Osswald et al., 2012), CTAM has been introduced by Venkatesh et al. (2012) to further improve the explanatory power of the model. Hence, to predict technology anxiety in the context of customers regarding the technology system installed in the cars, this investigation intends to revisit the predicting factors postulated by CTAM by introducing brand service quality and brand value to measure and analyze the technology anxiety among drivers.
Conceptual Framework
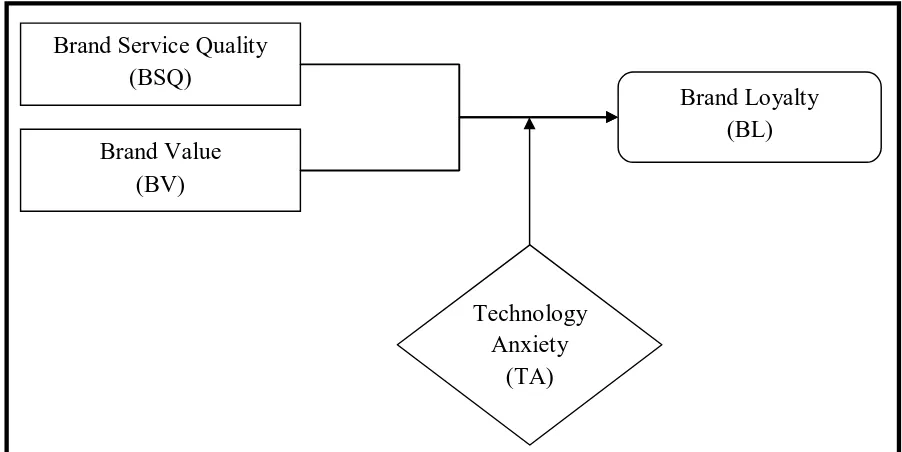
In accordance with the literature review and the purpose of this investigation, a proposed framework was constructed to investigate the indirect effect of brand service quality and brand value towards brand loyalty, with the moderating role of technology anxiety. The proposed model is depicted in Figure 1.
Figure 1: Conceptual Framework
Brand Service Quality
(BSQ)
Brand Value
(BV)
Brand Loyalty
(BL)
Technology
Anxiety
3.1 Relationship between Brand Service Quality and Brand Loyalty
E s (2012) unveiled the positive relationship between service quality and brand loyalty in context of the automotive parts industry (e.g., car materials and accessories). The author confirmed the service quality dimensions (i.e., tangibles, assurance, empathy, responsiveness, and reliability) as having a positive relationship with brand loyalty. However, service quality was found to have no direct relationship with brand loyalty due to the influence of customer satisfaction onto the relationship. The author concluded that the reliability of service quality holds the highest value in measuring brand loyalty.
In addition to that, Zehir et al. (2011) examined the relationship between service quality and brand loyalty in the context of global automotive brands in Turkey. The study focused on the influence of service quality and brand communication on brand loyalty influenced by brand trust. The authors concluded that brand service quality correlates positively with brand loyalty. In the past, studies of brand loyalty did not pay enough attention to brand service quality (Ahmed et al., 2013; Chinomona et al., 2013). Therefore, to create brand loyalty among customers, marketing managers need to improve the quality of service provided to their customers. These arguments showed that brand service quality influences brand loyalty, which can be proposed as:
H1: There is a positive relationship between brand service quality and brand loyalty.
3.2 Relationship between Brand Value and Brand Loyalty
A study conducted by Sugiati et al. (2013) found that customer value (e.g. functional, emotional, social, customer service and price fairness) has a positive and significant role in increasing customer satisfaction. This is because, better values embedded in the product increases the level of satisfaction which results in increased customer brand loyalty. However, the authors dispute that the indirect effect of brand value on brand loyalty could be further explained by customer satisfaction. Similarly, Senel (2011) stated that the perception of value has an indirect influence on brand loyalty through customer satisfaction from the context of Turkish automobile sector. Due to the irregularity in these findings, there is a reason for concern as some researchers have concluded that brand value has a direct influence on brand loyalty (Auka et al., 2013; Tabaku and Kushi, 2013).
On the other hand, Koller et al. (2011) found that perceived value has a direct influence on customer brand loyalty, in the context of the automotive industry. The authors investigated the influence of brand value dimensions (i.e. functional, economic, emotional and social) on brand loyalty and concluded that brand value has an impact on brand loyalty with full influence of sub-dimensions of brand value. Supporting this, an investigation conducted by Kuikka and Laukkanen (2012) pointed out that brand value has a direct influence on brand loyalty. However, research in this area has given little attention to differentiating the influences of perceived value and brand value towards the brand loyalty. Therefore, it is important to further investigate the direct relationship between brand value and brand loyalty, which can be formulated as:
H2: There is a positive relationship between brand value and brand loyalty.
3.3 The Moderator Role of Technology Anxiety
Despite calls for better understanding of customer brand loyalty through the consideration of brand value and technology anxiety, the concept of the customer brand loyalty may not be fully understood. The biggest shortfalls are in the understanding and inclusion of technology anxiety in measuring customer brand loyalty. Many anxiety measurements are considered to be incapable of measuring customer brand loyalty especially in the automotive sectors, as previous studies have examined anxiety from the context of technological gadgets such as computer and mobile phone (e.g. Vlachos et al., 2010; Nsairi and Khadraoui, 2013; Yang and Forney, 2013; Gelbrich and Sattler, 2014). These arguments show the indirect effects of brand service quality and brand value on brand loyalty, which are moderated by technology anxiety that can be proposed as:
H3a: The lower the level of technology anxiety, the higher will be the impact of brand service quality on brand loyalty H3b: The lower the level of technology anxiety, the higher will be the impact of brand value on brand loyalty
Research Methodology
This investigation is an explanatory study aiming to reveal and examine the relationship between brand service quality, brand value, technology anxiety, and brand loyalty. The data were obtained by administering a questionnaire which was distributed to the selected respondents. The selected respondents are the automotive consumers in the Northern Peninsular of Malaysia (i.e., Perlis, Kedah, and Penang). Furthermore, according to the proposed framework in this investigation, the variables of this study comprises exogenous (independent) variables including brand service quality (BSQ) and brand value (BV), moderating variable that consisting of technology anxiety (TA) and endogenous (dependent) variable consisting of brand loyalty (BL). E ach research variable is an unobserved latent variable measured by comparing the numbers of indicators. E ach indicator consists of items which have been constructed into statements. The data are in Likert’s scale that was anchored by 1 (strongly disagree) to 5 (strongly agree) indicating the extent of agreement and disagreement towards the statement. The data obtained is then confirmed for its validity and reliability through analysis.
Partial Least Squares (PLS) which is a technique that has been frequently adopted by previous studies (e.g., Chinomona et al., 2013; Sugiati et al., 2013; Wang et al., 2013) was employed in this investigation in order to analyze the proposed model. PLS has justified assumptions on non-normal distribution data, small sample sizes of respondents and is recommended for constructs that are formatively measured (Hair et al., 2014). As the sample of a pilot test in this study is relatively small, PLS is found to be more befitting for the purpose of this investigation. To analyze the proposed model, this investigation followed the two-step procedure for data analysis which includes the measurement model and structural model (Hair et al., 2013).
In order to assess the measurement model, this investigation measured the convergent and discriminate validity. The measurement of convergent validity shows the closeness of relations among items within the same construct, whereas convergent validity analyzes composite reliability (CR) and average variance extracted (AVE ). Researchers in PLS-based research used CR as a preferred alternative to Cronbach’s alpha to test convergent validity in a reflective model. This is because Cronbach’s alpha may over- or underestimate scale reliability, usually the latter (Garson, 2016). As suggested by Hair et al. (2014), the values of CR should be equal to or greater than .7. However, there is an exception for exploratory study as the values of CR should be equal to or greater than .6 (Chin and Newsted, 1999). Furthermore, the values of AVE should be greater than .5 (Fornell and Larcker, 1981; Chin and Newsted, 1999), as well as greater than cross-loading, whereby factors should explain at least half the variance of their reflective indicators (Garson, 2016). Therefore, the results in this investigation are acceptable when its CR and AVE values are equal to or greater than .6 and .5, respectively.
Result
5.1 Reliability and Validity
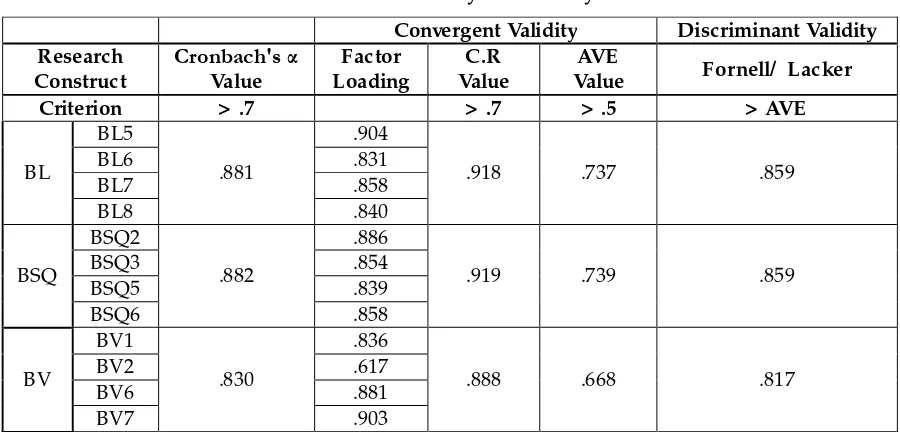
Reliability analysis was conducted by calculating the Cronbach's alpha, with each of the seven measures exceeding the .7 threshold required for this study (Nunnaly and Bernstein, 1994), representing a measurement of internal consistency reliability. This investigation achieved high levels of reliability as the value of the composite reliability range from .888 to .919, while the coefficient values of Cronbach’s alpha range from .830 to .882 for the three constructs shown in Table 1. All constructs in this study obtained an acceptable level of a composite reliability which is above the .6 cut off point as suggested by Chin and Newsted (1999). Therefore, indicating that the scales used to measure the dimensions for each construct in this study are reliable.
Table 1: Reliability and Validity
In addition, the maximum value of the squared path coefficient is .5 (Hair et al., 2013), all studied constructs of this investigation exceeded the squared path coefficient. The values for AVE ranged from .668 to .739 and convergent validity for each construct indicated a factor loading on each construct of more than .5. Meanwhile, measure of discriminant validity is presented in this investigation (Table 2) by calculating the square root of the AVE that exceeds the inter-correlation of constructs in the proposed model as recommended by Fornell and Larcker (1981). When analyzing a pair of constructs, the value of AVE for each construct should be greater than the squared structural path coefficient between the two constructs in order to be supported by discriminant validity. Based on Table 2, the diagonal elements (in bold), which represent the square root of AVE , are greater than the other non-diagonal elements which represent the latent variable correlations. Hence, this confirms that the discriminant validity has been established in this investigation.
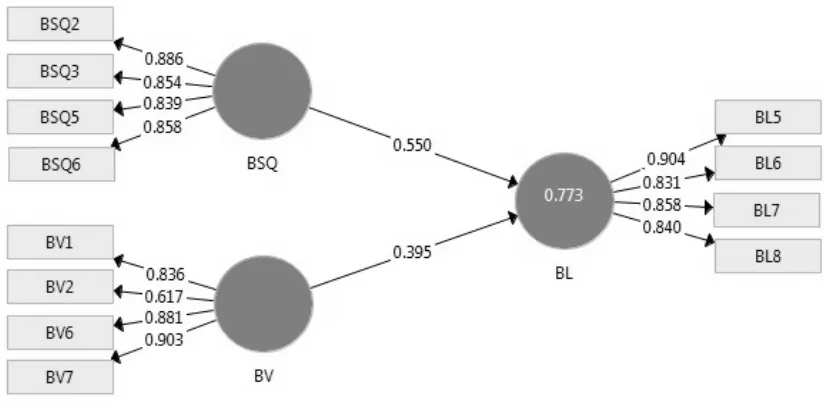
In testing the proposed hypotheses, the standardized path coefficient are expected to be at least .2 and preferably greater than .3 (Chin and Newsted, 1999). However, Garson (2016) stated that path coefficients are standardized path coefficients in which the path weights vary from -1 to + 1. The weight closest to absolute 1 indicates the strongest path, whereas the weight closest to 0 indicates the weakest path. As shown in Figure 2, a path weight of .550 and .395 show that brand service quality and brand value have positive effects on brand loyalty.
The predictive accuracy of a model can be measured by analyzing the coefficient of determination (R2). As
suggested by Hair et al. (2014), rule of thumb on the acceptable R2 is .75, .50 and .25, explaining substantial, moderate
or weak level of predictive accuracy respectively. As presented in Figure 2, the R2 value for the endogenous variable
is .773 indicating that brand service quality and brand value accounts for 77.3% of the variance in brand loyalty. Based on the results, the exogenous variables have strong predictive power to brand loyalty, as confirmed by the value of R2
greater than the .75 threshold suggested by Hair et al. (2011).
The reliability of the coefficients in this investigation is obtained from bootstrapping. A total of 500 resample’s are recommended for exploratory purposes, whereas a larger number (5,000 resample’s) is suitable for confirmatory purposes (Garson, 2016). In order to assess the significance of path coefficients, standard error, t-value and p-value of the hypothesized paths in this investigation, the bootstrap method (500 resample’s) was used. All t-values greater than 1.96 are consider significant at the .05 level, whereas for p-t-values, all paths are significant when greater than the .001 probability level (Garson, 2016). This provides support for hypotheses with a significant path coefficient of above 0.2. The respective t and p values are presented in Table 3.
Table 3: Results of structural equation model analysis
Hypothesized path Path Coefficients t-Value p-Value Significance
Level Decision
H1: BSQ BL .550 4.861 .000 *** Supported
H2: BV BL .395 3.528 .000 *** Supported
*** indicates p < .01; ** indicates p < .05
Figure 2: Measurement and Structural Model Results
Note: BSQ = Brand service quality; BV = Brand value; BL = Brand loyalty 5.3 Test of the Moderating E ffect
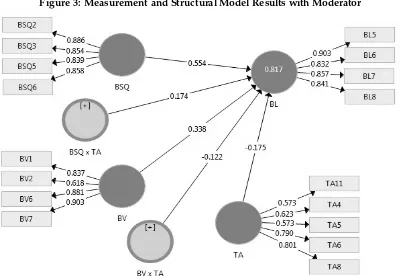
However, moderator variables are rarely been tested within the context of structural equation modeling (Henseler and Fassott, 2010). The moderator hypothesis in a study confirms whether the interaction effect (i.e., path c) is significant, independent of the magnitude of path coefficients a and b, in accordance to the idea proposed by Baron and Kenny (1986). Furthermore, Henseler and Fassott (2010) suggest a two-stage PLS approach for researchers in PLS-based studies in order to estimate the moderating effects using formative constructs. Latent variable scores will be first estimated during the first stage before it been used in the second stage to determine the coefficients of the regression function by using a formula. The PLS path model depicted in Figure 3, including its moderating effect can be mathematically formulated as follows:
Y = a + b · X + c · M + d · (X × M)
Based on the mathematical formula, Henseler and Fassott (2010) further explain that a is the intercept, and b
and c are the slopes of exogenous (X) and moderator (M), respectively. The effect of the exogenous variable towards the endogenous variable with the assistance of the moderator and the interaction variable towards the endogenous variable are estimated in this investigation in order to test the moderating effect (see Figure 3).
Figure 3: Measurement and Structural Model Results with Moderator
Note: BSQ = Brand service quality; BV = Brand value; TA = Technology anxiety; BL = Brand loyalty
To interpreted the moderating effect in a formative construct for PLS-based research, there are two steps to follow (Henseler and Fassott, 2010): (1) determining the significance of the moderating effect, and (2) determining the strength of the moderating effect. In the first step, it is recommended to conduct bootstrapping to estimate the standard error of the model parameters (Chin et al., 2003). The PLS model can also be tested using Chow test to measure whether specific path coefficients differ across groups (Chow, 1978). In this study, we discovered the path coefficient between brand service quality and brand loyalty with a moderating role of technology anxiety is .174. This indicates that high level of technology anxiety increases the relationship between brand service quality and brand loyalty.
This can be measured by comparing the proportion of variance explained in the main model (i.e. the model including the moderating effect). This idea also explains the parameter estimates for the effect size. As stated by Cohen et al. (2013), researchers can measure effect size (f 2) by using the following formula:
f 2 = R2 model with moderator – R2 model without moderator / 1 – R2 model with moderator
f 2 = 0.817 – 0.773 / 1 – 0.817
f 2 = 0.24
Moderating effects with the effect size, f 2 of .02 may be regarded as weak, effect sizes from .15 and above as
moderate, and effect sizes above .35 as strong. Therefore, the effect sizes of the parameter estimates in this investigation are regarded as moderate when its f 2 value is less than .35 (i.e., .24). As proposed by Chin (2010), “a low
effect size (f 2) does not necessarily imply that the underlying moderator effect is negligible”. This is because “even
small interaction effect can be meaningful under extreme moderating conditions. If the resulting beta changes are meaningful, it is important to take these conditions into account” (Chin et al., 2003).
6.0 Discussion and Conclusion
Brand service quality has a strong direct positive effect on brand loyalty, which occurs above the indirect effect, through the reduction of technology anxiety. It means that the refusal in using technological system installed in the car is mainly due to the emotional reaction of the drivers as they are fear of technology but not as a result of cognitive reflections on brand service quality. From the findings, brand service quality and brand value are not the only vital elements in the company to establish a long lasting relationship with the customers, but these elements hold an important role in improving the performance of companies (Oladele and Akeke, 2012). This is because companies have the ability to minimize the tendency of their customers to switch brands. Good customer perception on the quality of product and service will satisfy and retain customers within the companies, as customers tend to remain loyal to the current brands which they had trusted and familiarized. This will results in a larger market share for the company due to increment of customer brand loyalty.
From this investigation, it demonstrates that low level of technology anxiety influences brand loyalty among customers to a much greater extent than the high level of anxiety. Therefore, marketing agents in the automotive industry wishing to enter the Malaysian market must exert more effort to provide customers with information on the system installed in the car through a simple and easy-to-read instruction manual in order to reduce the level of anxiety among the drivers.
Furthermore, it is acknowledged that the proposed model in this paper is well-known in the marketing area and has been tested on products and services only in developed countries. However, this study bridges the research gap in investigating the effect of technology anxiety in brand loyalty relationships, in the context of automotive industry in a developing country such as Malaysia. At the same time, this study is able to verify the proposed conceptual model and test the model in the Northern States of Peninsular Malaysia (i.e., Perlis, Kedah and Penang). It is highly recommended that future research uses a larger sample size and examines additional variables that influence brand loyalty (e.g., brand communication, brand identity, brand satisfaction and commitment) in order to get a clear and better understanding on brand loyalty. The scope of future study could be focused on generation Y, as this generation represents the major percentage of the population in both developed and developing countries.
References
Ahmed, N., Majid, M., Nadeem, M., & Jalbani, S. M. (2013). The Impact of Service Quality on Brand Loyalty: Mediating Role of Customer Satisfaction. European Journal of Management Sciences, 1(1), 30–41.
Alex, D., & Thomas, S. (2011). Impact of Product Quality, Service Quality and Contextual E xperience on Customer Perceived Value and Future Buying Intentions. E uropean Journal of Business and Management, 3(3), 307– 316.
Baron, R. M., & Kenny, D. A. (1986). The moderator-mediator variable distinction in social psychological research: Conceptual, strategic, and statistical considerations. Journal of Personality and Social Psychology, 51(6), 1173–1182. http://doi.org/10.1037/0022-3514.51.6.1173
Blackwell, R. D., Miniard, P. W., & E ngel, J. F. (2012). Consumer Behavior. Singapore: Cengage Learning.
Chin, W. W. (2010). How to Write Up and Report PLS Analyses. In Handbook of Partial Least Squares (pp. 655–690). Heidelberg: Springer Berlin Heidelberg. http://doi.org/10.1007/978-3-540-32827-8
Chin, W. W., Marcolin, B. L., & Newsted, P. N. (2003). A partial least squares latent variable modelling approach for measuring interaction effects: Results from a monte carlo simulation study and an electronic-mail emotion/adoption study. Information Systems Research, 14(2), 189–217.
Chin, W. W., & Newsted, P. R. (1999). Structural E quation Modelling Analysis with Small Samples using Partial Least Squares. In R. H. Hoyle (E d.), Statistical Strategies for Small Sample Research (pp. 307–341). Thousand Oaks: SAGE Publications.
Chinomona, R., Mahlangu, D., & Pooe, D. (2013). Brand service quality, satisfaction, trust and preference as predictors of consumer brand loyalty in the retailing industry. Mediterranean Journal of Social Sciences, 4(14), 181–190. Chinomona, R., & Sandada, M. (2013). Customer Satisfaction, Trust and Loyalty as Predictors of Customer Intention
to Re-Purchase South African Retailing Industry. Mediterranean Journal of Social Sciences, 4(14), 437–446. Chow, G. (1978). Test of equality between sets of coefficients in two linear regressions. E conometrika, 28, 591–605. Chuah, H. W., Marimuthu, M., & Ramayah, T. (2014). The E ffect of Perceived Value on the Loyalty of Generation Y
Mobile Internet Subscribers: A Proposed Conceptual Framework. Procedia - Social and Behavioral Sciences, 130, 532–541. Model Design: A Study in the Dutch Automotive Industry. University of Twente.
Fornell, C., & Larcker, D. F. (1981). E valuating Structural E quation Models with Unobservable Variables and
Gelbrich, K., & Sattler, B. (2014). Anxiety, crowding, and time pressure in public self-service technology acceptance. Journal of Services Marketing, 28(1), 82–94.
Goel, P. (2014). An E mpirical Study of Relationships among Service Quality, Perceived Value, Customer Satisfaction and Post-Purchase Intention in Mobile Value-Added Services. International Journal of Business and Management Research, 4(4), 123–128.
Hair, J. F., Hult, G. T. ., Ringle, C. ., & Sarstedt, M. (2013). A Primer on Partial Least Squares Structural E quation Modeling (PLS-SE M). Thousand Oaks: Sage.
Hair, J. F., Ringle, C. M., & Sarstedt, M. (2011). PLS-SEM: Indeed a Silver Bullet. The Journal of Marketing Theory and Practice, 19(2), 139–151. http://doi.org/10.2753/MTP1069-6679190202
Hair, J. F., Sarstedt, M., Hopkins, L., & Kuppelwieser, V. G. (2014). Partial least squares structural equation modeling (PLS-SE M): An emerging tool in business research. E uropean Business Review, 26(2), 106–121.
Henseler, J., & Fassott, G. (2010). Testing Moderating E ffects in PLS Path Models: An Illustration of Available Procedures. In Handbook of Partial Least Squares (pp. 713–735). Heidelberg: Springer Berlin Heidelberg. http://doi.org/10.1007/978-3-540-32827-8
Hsu, L.-C. (2014). Influence of Quality of Information System Success (ISS) on Customer Intention to Continue Use in B2B E -commerce: A Contingency Approach of System Anxiety. Research Journal of Business Management, 8(4), 353–366.
Ivanauskienė, N., & Volungėnaitė, J. (2014). Relations between Service Quality and Customer Loyalty: An Empirical Investigation of Retail Chain Stores in E merging Markets. American International Journal of Social Science, 3(2), 113–120.
K assim, A. W. M., Igau, O. A., Harun, A., & Tahajuddin, S. (2014). Mediating E ffect of Customer Satisfaction on Perceived Product Quality, Perceived Value, and Their Relation to Brand Loyalty. International Journal of Research in Management & Business Studies, 1(2), 13–18.
K aur, H., & Soch, H. (2013). Mediating roles of commitment and corporate image in the formation of customer loyalty. Journal of Indian Business Research, 5(1), 33–51.
Khan, M. B., & Khawaja, K. F. (2013). The Relationship of E -CRM, Customer Satisfaction and Customer Loyalty. The Moderating Role of Anxiety. Middle-E ast Journal of Scientific Research, 16(4), 531–535. http://doi.org/10.5829/idosi.mejsr.2013.16.04.11568
Koller, M., Floh, A., & Zauner, A. (2011). Further Insights into Perceived Value and Consumer Loyalty: A “Green” Perspective. Psychology and Marketing, 28(12), 1154–1176.
Kuikka, A., & Laukkanen, T. (2012). Brand loyalty and the role of hedonic value. Journal of Product & Brand Management, 21(7), 529–537.
Laguador, J. M., Chung, M. M., Dagon, F. J. D., Guevarra, J. A. M., Pureza, R. J., Sanchez, J. D., & Iglesia, D. K. I. S. (2013). Anti Car Theft System using Android Phone. International Journal of Multidisciplinary Sciences and E ngineering, 4(5), 12–14.
Lee, H., Choi, S. Y., & K ang, Y. S. (2009). Formation of e-satisfaction and repurchase intention: Moderating roles of computer self-efficacy and computer anxiety. E xpert Systems with Applications, 36(4), 7848–7859. http://doi.org/10.1016/j.eswa.2008.11.005
Li, M., & Green, R. D. (2011). A mediating influence on customer loyalty: The role of perceived value. Journal of Management and Marketing Research, 7(1), 1–12.
Meyer, M. (2014). International KPMG’s Global Automotive E xecutive Survey 2014. United States: KPMG International Cooperative.
MIDA. (2012). Business Opportunities: Malaysia’s Automotive Industry. Kuala Lumpur.
Mouakket, S., & Al-Hawari, M. A. (2012). E xamining the antecedents of e-loyalty intention in an online reservation environment. Journal of High Technology Management Research, 23(1), 46–57. http://doi.org/10.1016/j.hitech.2012.03.005
Nsairi, Z. B., & Khadraoui, M. (2013). Website Satisfaction: Determinants and Consequences on Website Loyalty. International Business Research, 6(9), 77–92. http://doi.org/10.5539/ibr.v6n9p77
Nunnaly, J. C., & Bernstein, I. H. (1994). Psychometric theory (3rd ed.). New York: McGraw-Hill/Irwin.
Oladele, P. O., & Akeke, N. I. (2012). E ffect of Customer Satisfaction on Customer Loyalty Among Selected Bank Customers in Ado-E kiti Metropolis, Nigeria. Interdisciplinary Journal of Contemporary Research in Business, 3(11), 228–236.
Osswald, S., Wurhofer, D., Trösterer, S., Beck, E ., & Tscheligi, M. (2012). Predicting Information Technology Usage in the Car: Towards a Car Technology Acceptance Model. In Proceedings of the 4th International Conference on Automotive User Interfaces and Interactive Vehicular Applications (pp. 1–8). New York: ACM.
Rahman, M. K. (2014). E mpirical Evaluation of Customer Loyalty in Malaysian Retail Outlets. Journal of Marketing Management, 2(2), 129–143.
Senel, M. (2011). An Approach to Measuring Brand Loyalty in The Turkish Automotive Sector. Uludag Journal of E conomy and Society, 30(2), 137–154.
Sugiati, T., Thoyib, A., Hadiwidjoyo, D., & Setiawan, M. (2013). The Role of Customer Value on Satisfaction and Loyalty (Study on Hypermart ’ s Customers). International Journal of Business and Management Invention, 2(6), 65–70.
Tabaku, E ., & Kushi, E . (2013). Service Quality, Customer Satisfaction, Perceived Value and Brand Loyalty: A Critical Review of the Literature. Academic Journal of Interdisciplinary Studies, 2(9), 223–228.
Thaichon, P., Quach, T. N., & Lobo, A. (2013). Marketing Communications: Factors Influencing Brand Loyalty of Internet Service Provider. In Australian and New Zealand Marketing Academy Conference (pp. 1–4). Auckland.
Thompson, F. M., Newman, A., & Liu, M. (2010). The Impact of Culture on Brand Loyalty - A Study of the Young Affluent Chinese, 1–11.
Venkatesh, V., Thong, J. Y. L., & Xu, X. (2012). Consumer Acceptance and Use of Information Technology: E xtending the Unified Theory of Acceptance and Use of Technology. MIS Quarterly, 36(1), 157–178. Vinci, V. E ., Chin, W. W., Henseler, J., & Wang, H. (2010). Handbooks of Partial Least Squares. London: Springer
Handbooks of Computational Statistics.
Vlachos, P. A., Theotokis, A., Pramatari, K., & Vrechopoulos, A. (2010). Consumer-retailer emotional attachment: Some antecedents and the moderating role of attachment anxiety. E uropean Journal of Marketing, 44(9/10), 1478–1499. http://doi.org/10.1108/03090561011062934
Wang, S., Zhang, K. Z. K., & Lee, M. K. O. (2013). Developing Consumers’ Brand Loyalty in Companies’ Micro blogs: The Roles of Social- and Self-Factors. PACIS 2013 Proceedings. Retrieved from
http://aisel.aisnet.org/pacis2013/81/
Yang, K., & Forney, J. C. (2013). The moderating role of consumer technology anxiety in mobile shopping adoption: Differential effects of facilitating conditions and social influences. Journal of E lectronic Commerce Research, 14(4), 334–347.
Yarimoglu, E . K. (2014). A Review on Dimensions of Service Quality Models. Journal of Marketing Management, 2(2), 79–93.