CUSTOMERS’ PERCEPTIONS OF SERVICE QUALITY DIMENSIONS IN
THE INDONESIAN BANKING INDUSTRY: AN EMPIRICAL STUDY
Ananda Sabil Hussein
Faculty of Economics and Business Universitas Brawijaya Malang
Raditha Hapsari
Faculty of Agribusiness and Commerce Lincoln University Canterbury, New Zealand
ABSTRACT
This study aims to investigate the dimensions of hierarchical service quality in the area of the banking sector as well as to determine its relationships with other constructs, namely corpo-rate image and customer loyalty. One hundred and eleven respondents participated in this study. Partial Least Squares were employed to analyse the data. The inner and outer model evaluations showed that the proposed model was robust. This study found that the interaction quality, outcome quality and physical quality were the dimensions of service quality which were formed in the hierarchical model. In addition, this study indicated that service quality was a robust determinant of corporate image and customer loyalty in the banking sector. Similar to service quality, corporate image was also found to be an essential predictor of customer loyalty as well as the mediator between service quality and customer loyalty. To enhance the under-standing of service quality in the banking sector, further studies might add additional constructs such as brand engagement, perceived value, and customer experience.
Keywords: service quality, image, loyalty, bank
INTRODUCTION
As one of the competitive business service sectors in Indonesia, the banking industry creates tight market competition. As of now, around 120 commercial banks – both state-owned and pri-vate, operate in Indonesia (Bank Indonesia, 2011). This situation creates competition among the banks to obtain funds from third parties and therefore challenges the banking sector to main-tain their customers‟ loyalty.
Theoretically, maintaining customer loyalty is essential for any business sector, including the banking industry. Gremler and Brown (1996) argued that customer loyalty was the degree to which a customer exhibits repurchasing behavior from a service provider, possesses a positive attitudinal disposition toward the provider, and considers using only this provider when a need for this service emerges. Based on this notion,
customer loyalty would provide great benefits to an institution, such as in minimizing the cost of it attracting new customers, more efficient oper-ational costs, lowering the psychological and social costs, and making loyal customers defend the institution and even to attract others to it, and recommend the institution to them.
Service quality has been recognized as an important factor in maintaining loyal customers. Pollack (2009) mentioned that service quality had a positive effect in creating loyalty. It means a business organization offering a high quality service will likely have more loyal customers.
Parasuraman et al. (1988) is widely used by scholars to analyze service quality. However, there are some criticisms addressed at the SERVQUAL framework (Cronin and Taylor, 1994; Shu, 2010).
Apart from its role in creating customer loyalty, scholars also claim that service quality has an essential role in creating a positive corpo-rate image. Alfin et al. (2013) suggested that service quality had a positive effect on corporate image, which implied that a higher service qual-ity, as perceived by customers, resulted in a greater positive image of the corporation. Simi-lar to Alfin et al.‟s (2013) study, Cham and Easvaralingam (2012) explained that corporate image is significantly influenced by service quality.
As an important element in the marketing field, corporate image is recognized to have an important role in creating loyalty. Scholars sug-gest that corporate image has a significant effect on customer loyalty (Cheng and Rashid, 2013; Saleem and Raja, 2014). The more positive the image of the company is, as perceived by its customers, the more loyalty will be shown by the customers to the company. Although some stu-dies confirm the significant effect of image on loyalty, scholars such Hart and Rosenberger IIaboveI (2004) found that corporate image only had a marginally significant influence on cus-tomer loyalty. For that reason, there is still a need to examine this relationship in a different field.
Based on the research issues stated, we were led to the following two research objectives of this study:
1. To examine the hierarchical service quality dimensions as perceived by banking service customers.
2. To test the relationships among several essen-tial marketing constructs, namely service quality, corporate image, and customer loyalty.
This study provided some contributions by confirming the two research objectives above. Firstly, differing from the previous studies, this study developed and tested a comprehensive
hierarchical model that provided a complete and integrated analysis of the dimensions underlying customers‟ perceptions of service quality, and also analyzed the relationships that exist among several important higher order marketing con-structs in the banking industry. Secondly, this study provided empirical support for the use of a hierarchical model to conceptualize and measure customers‟ perceptions of service quality in the banking industry. Thirdly, the results of this study will benefit marketers and practitioners who are already operating in or preparing to en-ter the banking industry market, as the findings may assist these organizations in developing and implementing successful business strategies.
LITERATURE REVIEW AND HYPOTHESES
1. Service Quality
Service is any act or performance that one can offer to another that is essentially intangible and does not result in the ownership of anything (Kotler and Amstrong, 2006). In the area of ser-vice marketing studies, Parasuraman et al.(1985) stated that service quality was an elusive con-struct. Furthermore, Rust and Oliver (1994) contended that service quality was a subjective manner. Hence, Brady and Cronin (2001) claimed that the construct of service quality was difficult to grasp.
Empathy – the caring individualized attention that the firm provides to its customers.
Although SERVQUAL has been used extensively to measure service quality, several criticisms are addressed at this instrument (Babakus and Boller, 1992; Carman, 1990). Fernie et.al.(2003) contend that two criticisms can be directed at the SERVQUAL framework. Firstly, SERVQUAL generalises the relationship between customers and service providers; secondly, it disregards the crucial relationship between customers and service providers. Other scholars such as Babakus and Boller (1992) and Carman (1990) argued that SERVQUAL was being applied inappropriately to measure service quality because: 1) the dimensions of the SERVQUAL measures may not apply in all ser-vice settings, 2) items in some dimensions reveal that those are not distinct during scale purifica-tions, 3) SERVQUAL focuses on the compari-son between expectations and perceptions of actual service delivery and 4) SERVQUAL can-not adequately cover the complexity of custom-ers‟ perceptions.
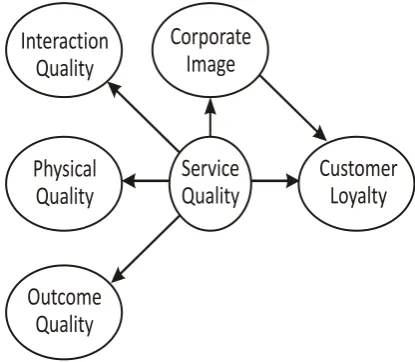
While there is no agreement about the con-ceptualization of service quality, scholars agree that service quality is multidimensional (Brady and Cronin, 2001; Dabholkar et al., 1995; Parasuraman et al., 1988). To overcome the inadequate measurements of SERVQUAL, Brady and Cronin (2001) proposed the hierar-chical service quality framework. This frame-work stated that the overall perception of service quality was affected by three dimensions, namely the interaction quality, physical quality, and outcome quality.
This study employs a hierarchical service quality framework that has been used by other studies to measure service quality. A study by Wu (2009) of the hotel industry in Taiwan found that the hierarchical service quality framework was a robust framework to measure service quality in the Taiwanese hotel industry. This study revealed that service quality was formed in a hierarchical model consisting of the interaction quality, outcome quality, and physical quality that were taken separately as primary dimen-sions. Similar to this study, Mohi (2012) found
that a hierarchical service quality framework was a robust framework to measure the service qual-ity of Malaysia‟s restaurants. In the telecomun-cations industry, Clemes et al. (2014) found that hierarchical service quality can be used to meas-ure the quality of services provided. Further-more, this study declared that interaction quality is the dimension which had the most dominant effect in determining the service quality.
Based on these contentions, these following hypotheses were proposed:
H1a : interaction quality has a significant effect on the overall perception of service quality
H1b : physical quality has a significant effect on the overall perception of service quality
H1c : outcome quality has a significant effect on the overall perception of service quality
2. Corporate Image
Image is one way the public perceives a company or its products (Kotler and Keller, 2006) Corporate image is the perception that different audiences have of an organization and results from the audiences‟ interpretation of the cues presented by an organization. Corporate image in service marketing literature was identi-fied as an important factor in the overall evalua-tion of the service and the company quite early on. Grönroos (1984) stated that brand image was largely affected by the overall assessment of the services received by the customers. Baker et al. (1994) explained that service quality was the determinant of image. In accordance with Baker (1994), Clemes et al. (2009) found that service quality significantly influenced brand image. Nguyen and LeBlanc (1998) indicated that the overall image of an organization, including its brand, was influenced by the perception of its customers about the quality of services offered.
they claimed that the customers‟ voice was believed to be important in this respect. According to this study, as a service company develops closer relations with its customers by offering services of a high quality and by stimu-lating its customers‟ voice, a strong correlation between image and loyalty will emerge. The study of Clemes et al. (2013) in the telecom-munications industry found that corporate image was an important predictor of customer loyalty.
Hence, the following hypotheses were pro-posed:
H2 : corporate image is significantly affected by service quality
H3 : corporate image has a significant effect on customer loyalty
3. Customer Loyalty
Loyalty is a consumer‟s voluntary decision to continue patronizing a specific service from the same firm over an extended period of time (Lovelock and Wirtz, 2011).Oliver (1997) claimed that customer loyalty was a deeply held commitment to rebury or re-patronize a preferred product or service consistently in the future, the-reby causing repetitive same-brand or same brand-set purchasing, despite situational influ-ences and marketing efforts having the potential to cause switching behavior.
According to Mardalis (2005), there were six reasons why an institution needed to get its cus-tomers‟ loyalty. First, loyal customers gave great benefits to the institution. Second, the cost of getting new customers was more expensive than that of keeping and maintaining existing cus-tomers. Third, the customers who already believed in the institution would also believe in other things it offered. Fourth, the operational costs of an institution were more efficient if it had many loyal customers. Fifth, the institution may deduct the psychological and social costs, because long time customers had many positive experiences with the institution. Sixth, loyal customers would defend the institution, and even attract and recommend it to other people.
Customers receive several benefits from being a loyal customer. These benefits can
include a feeling of optimal satisfaction, a knowledge of what to expect from the service provider, trust in the provider, friendship with employees, time savings from not having to search for a provider, and various types of spe-cial treatment (Gremler and Brown, 1996).
Customers are the driving force for profita-ble growth and therefore customer loyalty can lead to profitability (Hayes, 2008). Loyal customers are less likely to switch to other com-petitors and they even make more purchases than non-loyal customers. Therefore, loyal customers are considered to be the most important assets of a company.
Some studies have shown that service quality has an important role in creating loyalty (Ostrowski et al., 1993; Wong and Sohal, 2003). In this case, customers tend to be more loyal to a company when they perceive a high service quality. Furthermore, scholars also suggest that service quality has an indirect effect on loyalty through the corporate image (Shu, 2010).
The proposed hypotheses are:
H4 : customer loyalty is significantly affected by service quality
H5 : corporate image mediates the relationship between service quality and customer loyalty
Based on the review of the literature, the conceptual framework proposed in this study is as shown below.
Figure 1. Conceptual Framework
Interaction
Quality
Physical
Quality
Outcome
Quality
Service
Quality
Customer
Loyalty
Corporate
RESEARCH METHOD
1. Sample
The respondents of this study were the cus-tomers of a national banking company in Indo-nesia. One hundred and fifty questionnaires were distributed. A total of 111 respondents returned the questionnaires giving a 74 percent response rate. These respondents were recruited using a convenience sampling method.
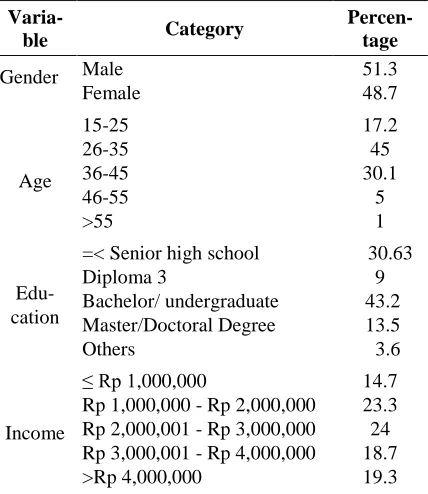
The following demographic profile emerged from the sample: 75 percent of the respondents were aged between 26 and 45 years old, 60 per-cent had a tertiary education, 51% were male, and 47% had an income between Rp1,000,000 - Rp. 3,000,000. Table 1 presents the demographic profile of the respondents in this study.
Table 1. Demographic Profile of Respondents
Varia-ble Category
Percen-tage
Gender
Male 51.3
Female 48.7
Age
15-25 17.2
26-35 45
36-45 30.1
46-55 5
>55 1
Edu-cation
=< Senior high school 30.63
Diploma 3 9
Bachelor/ undergraduate 43.2
Master/Doctoral Degree 13.5
Others 3.6
Income
≤ Rp 1,000,000 14.7
Rp 1,000,000 - Rp 2,000,000 23.3
Rp 2,000,001 - Rp 3,000,000 24
Rp 3,000,001 - Rp 4,000,000 18.7
>Rp 4,000,000 19.3
2. Questionnaire
A self-administered questionnaire survey of a national bank‟s customers was conducted in Malang to collect empirical data for this study. The questionnaire was designed based on the review of the related literature. The question-naire consisted of two parts. The first part collected information about the demographic characteristics of the respondents; and the second part measured the variables investigated
in this study. The measures used in this study were adapted from several studies measuring hierarchical service quality and its effects, espe-cially on corporate image and customer loyalty.
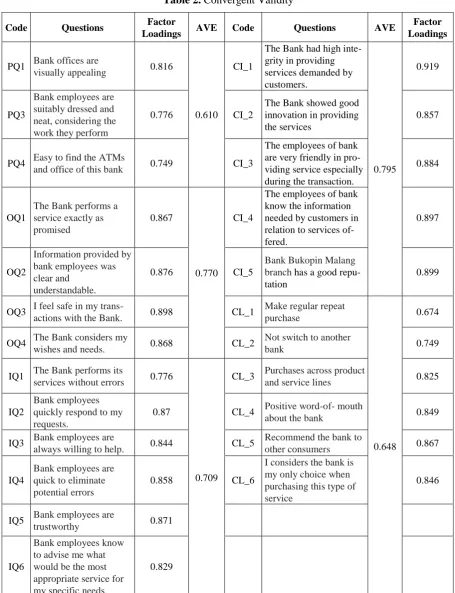
The questionnaire which examined the inte-raction quality, physical quality, and outcome quality was adapted from Brady and Cronin Jr (2001) and Parasuraman, et al.(1988). The inte-raction quality was measured by 6 items, in-cluding: bank employees are quick at eliminat-ing potential errors. The physical quality was measured by 3 items, for example: bank offices are visually appealing. The outcome quality was measured by 4 items, such as: I feel safe in my transactions with the Bank. The questions to measure the corporate image were adapted from Kotler and Amstrong (2009) – like: the bank had high integrity in providing services demanded by customers; further, the questions for customer loyalty were adapted from Jones and Taylor (2007), for instance: do (you the customer) make regular repeat purchases?.
Apart from the questions about the respon-dents‟ demographics, which were measured by categorical scales, all the other constructs were measured using a five-point Likert‟s scale rang-ing from „strongly disagree (1)‟ to „strongly agree (5)‟.
3. Data Analysis
Another reason for using PLS was based on Abdi‟s suggestion (2007) stating that the aim of PLS was to predict the effects of a set of inde-pendent variables on a set of deinde-pendent variables. He explained that PLS was a multiva-riate technique to compare multiple response variables and multiple explanatory variables. Though it is similar to Principal Components Analysis (PCA), PLS is believed to be a better option than multiple linear regression and PCA regression techniques since it presents more vigorous model parameters that do not change with new calibration samples from the popula-tion (Falk and Miller, 1992; Geladi and Kowalski, 1986).
RESULTS
Following PLS‟s rule of thumb, the evalua-tion of the outer and inner models were per-formed to ensure that the proposed model was robust. For this study, the outer model was evaluated by using some tests, namely the convergent validity, discriminant validity, and reliability. The inner model was evaluated by using the score of coefficient determinant and goodness of fit. The following section discusses the evaluation of the outer and inner models.
1. The Evaluation of the Outer Model
The assessment of the outer model was accomplished in three steps: examinations of the convergent validity, discriminant validity, and reliability. The investigation of these problems was essential since these problems had the potential to affect the outcome of the statistical test.
The first assessment was the convergent validity. In this study, the evaluation of conver-gent validity was determined by the score of the factor loadings and Average Variance Extracted (AVE). The score of the factor loadings for this study varied between 0.610 and 0.910 which were above the recommended threshold of 0.50 as proposed by Fornell and Larcker (1981). As the loading score was greater than 0.50, the score indicates that all measurement indicators have sufficient convergent validity, meaning that each indicator has a high level of connection
with its corresponding variable. In this study, the score of AVE ranged from 0.610 to 0.795. Fornell and Larcker (1981) suggested that a score of 0.50 for AVE indicated an acceptable level of validity for the measures. Therefore, all constructs used in this study can be used to explain the measurement variance. Table 2 summarizes the result of the convergent validity.
The last outer model evaluation was uni-dimensionality. The composite reliability score for each construct ranged from 0.824 to 0.953, which were beyond the cut-off value (0.70) (Nunnally, 1978). Based on these uni-dimensio-nality tests, all constructs used in this study have an acceptable degree of consistency and thus are considered reliable. Table 3 summarizes the score of composite reliability and AVE.
The discriminant validity was assessed using an approach proposed by Chin (2010). This ap-proach suggested that none of the items should load more highly on another construct than they do on the construct they intend to measure. In other words, the value of the factor loading should be higher than the cross loading. For this study, the value of the factor loading for each construct was higher than the cross loading. Therefore, it can be said that there is no discri-minant validity. See Appendix 1 for the cross loading calculation.
2. The Evaluation of the Inner Model
After determining the robustness of the measures, the next phase was to provide confir-mation that supports the theoretical model as demonstrated by the structural model (Chin, 2010). The structural model was evaluated through the score of the coefficient of determi-nation ( and the Goodness of Fit Index (GoF).
Table 2. Convergent Validity
Code Questions Factor
Loadings AVE Code Questions AVE
Factor Loadings
PQ1 Bank offices are
visually appealing 0.816
0.610
CI_1
The Bank had high inte-grity in providing services demanded by customers.
0.795
0.919
PQ3
Bank employees are suitably dressed and neat, considering the work they perform
0.776 CI_2
The Bank showed good innovation in providing the services
0.857
PQ4 Easy to find the ATMs
and office of this bank 0.749 CI_3
The employees of bank are very friendly in pro-viding service especially during the transaction.
0.884
OQ1
The Bank performs a service exactly as promised
0.867
0.770
CI_4
The employees of bank know the information needed by customers in relation to services of-fered.
0.897
OQ2
Information provided by bank employees was clear and
understandable.
0.876 CI_5
Bank Bukopin Malang branch has a good repu-tation
0.899
OQ3 I feel safe in my
trans-actions with the Bank. 0.898 CL_1
Make regular repeat purchase
0.648
0.674
OQ4 The Bank considers my
wishes and needs. 0.868 CL_2
Not switch to another
bank 0.749
IQ1 The Bank performs its
services without errors 0.776
0.709
CL_3 Purchases across product
and service lines 0.825
IQ2
Bank employees quickly respond to my requests.
0.87 CL_4 Positive word-of- mouth
about the bank 0.849
IQ3 Bank employees are
always willing to help. 0.844 CL_5
Recommend the bank to
other consumers 0.867
IQ4
Bank employees are quick to eliminate potential errors
0.858 CL_6
I considers the bank is my only choice when purchasing this type of service
0.846
IQ5 Bank employees are
trustworthy 0.871
IQ6
Bank employees know to advise me what would be the most appropriate service for my specific needs.
Table 3. Composite Reliability and AVE
Composite reliability AVE
CI 0.951 0.795
CL 0.916 0.648
IQ 0.935 0.709
OQ 0.93 0.77
PQ 0.824 0.61
SQ 0.953 0.615
Table 4. The Values
R Square
CI 0.669
CL 0.547
IQ 0.943
OQ 0.917
PQ 0.644
To ensure the robustness of the inner model, this study also evaluated the Goodness of Fit (GoF) index. Since PLS is a variance based SEM, it does not have a formal GoF. Therefore, the calculation of GoF refers to Tenenhaus et al‟s. (2004) suggestion. Derived from Tenenhaus et al. (2004), Daryanto et al. (2009) proposed that the baselines for GoF were small = 0.1, medium = 0.25 and large = 0.36. The calculation of GoF yielded a score of 0.716. Since the GoF index of the model tested in this study exceeded 0.36, the model proposed in this study is robust. See Appendix 2 for the calculation of the GoF
The outcomes of the inner model evaluation indicated that the model tested for this study is robust. Therefore, hypotheses testing can pro-ceed.
3. Hypotheses Testing
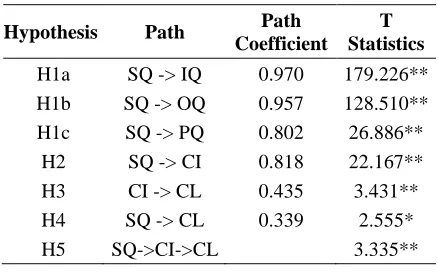
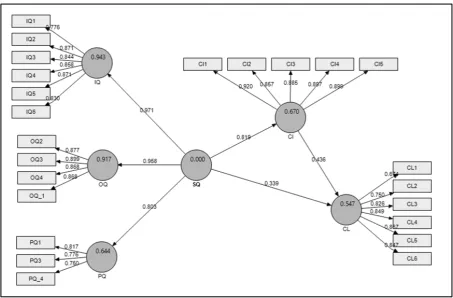
The first research objective was to assess the dimensions of service quality perceived by the bank‟s customers. The outcomes of the second-order confirmatory factor analysis showed that interaction quality (t = 179.226; β = 0.970), out -come quality (t = 128.510; β = 0.957), and physical quality (t = 26.886; β = 0.802) were the dimensions of the service quality. Therefore,
hypothesis 1a, 1b, and 1c were confirmed. Among these dimensions, interaction quality was considered as the most important dimension, as the results found that interaction quality had the most significant effect in the formation of service quality.
The second research objective was to eva-luate the relationships among service quality, corporate image, and customer loyalty. The result of the hypotheses testing showed that ser-vice quality had a significant positive effect on corporate image (t = 22.167; β = 0.818). It means hypothesis 2 is supported; further, it implies that the higher the quality of service, as perceived by a bank‟s customers, will result in a more positive image of the bank.
This study indicated that corporate image had a positive effect on customer loyalty (t = 3.431; β = 0.435); thus, hypothesis 3 is sup -ported. This significant relationship means the more positive the image is of a corporation, as perceived by its customers, the more loyal the customers will be to the corporation. This study also found that customer loyalty was signifi-cantly affected by service quality (t = 2.555; β = 0.339); hence, it supports hypothesis 4. This relationship indicates that customers will be more loyal to the bank when they perceive high quality in the offered services.
Table 5. Hypotheses Testing
Hypothesis Path Path Coefficient
T Statistics
H1a SQ -> IQ 0.970 179.226**
H1b SQ -> OQ 0.957 128.510**
H1c SQ -> PQ 0.802 26.886**
H2 SQ -> CI 0.818 22.167**
H3 CI -> CL 0.435 3.431**
H4 SQ -> CL 0.339 2.555*
H5 SQ->CI->CL 3.335**
*significant at p <0.01
Figure 2. Structural Equation Model
DISCUSSION
This study determined the dimensions of service quality in the Indonesian banking service and evaluated the relationships among service quality, corporate image, and customer loyalty. This study proposed that the interaction quality, outcome quality, and physical quality are the dimensions of service quality.
This study found that these three dimensions – interaction quality, physical quality, and out-come quality – were the dimensions of service quality in the banking service. This finding sup-ports previous studies which employed a hierar-chical model of service quality (Brady and Cronin Jr 2001; and Dagger et al., 2007)
Employees are an essential capital asset for service companies, especially in the banking sector. Employees are important since they assist the company to deliver the product to customers. Employees, as the service providers, need appropriate skills such as interpersonal skills, professional skills, and problem solving skills to ensure the operational success of the organiza-tion.
Bitner (1992) contended that the surrounding physical environment, in which the process of a service encounter takes place, played an impor-tant role in influencing customers‟ overall perceptions of service quality. Researchers state that a physical or “built” environment affects customer service evaluations, as the quality of the physical environment is an important aspect of the service assessment by customers (Baker, 1987; Bitner, 1992; Gustafsson et al., 2006; Rust & Oliver, 1994; Wakefield & Blodgett, 1996). The importance of the physical quality proposed in this hierarchical model is similar to tangible aspects of the SERVQUAL proposed by Parasuraman et al. (1985). However, the concept of physical quality has a broader meaning than just its tangible aspect (Lai et al., 2007). Reflect-ing on this findReflect-ing, the bankReflect-ing sector should provide a good physical environment in order to support the process of service delivery.
Gronroos (1984), Czepiel et al. (1985) explained that the outcome quality referred to the technical outcome as the "actual" service, and posits that it is a determinant in assessing the quality of a ser-vice encounter. In determining the outcome quality in the banking service, several dimen-sions should be considered. Since customers are involved in the service production, the waiting time is one of the important dimensions in determining service quality. Parasuraman et al. (1985) contended that customers identified the service promptness as an integral part of service quality. Similar to SERVQUAL‟s proposition that the reliability of service would influence the perceived service quality, in a hierarchical model, the reliability aspect is also considered as an essential aspect in defining outcome quality (Shu, 2010).
As proposed in this study, service quality has a positive significant effect on corporate image. This finding supports the study of Alfin et al. (2013) and Huei and Easvaralingam (2011) as they found that service quality had a positive influence on corporate image. These findings prove that a higher service quality results in a better image for the company. On the other hand, a lower quality of service causes a poorer image of the company.
Corporate image is the perception that dif-ferent audiences have of an organization and results from the audiences‟ interpretation of the cues presented by an organization. For example, if the employees are willing to help customers and provide a prompt service, then the customers will think that the company has high integrity in serving and delivering the customers‟ needs and in providing their services.
As an important construct in the marketing field, corporate image is found to have a signifi-cant role in influencing customer loyalty. This study finds that the more positive the image is, as perceived by customers, then this results in greater loyalty by the customers to the bank. This finding is similar to several previous studies which also revealed the significant effect of cor-porate image on customer loyalty (Shu, 2010). Since there is an essential effect of image on loyalty, banking companies should be able to
create positive corporate images. This is plausi-ble since the banking sector is a business sector which needs to gain the trust of its customers. Customers would feel more secure having trans-actions with a bank if the bank has a positive image in running its business.
The other important finding of this study is the indirect effect of service quality on customer loyalty. While several studies indicate a direct relationship of service quality on customer loyalty, this study shows that the corporate image mediates this relationship. In brief, this study finds that, as a central construct in the service marketing field, service quality influ-ences customer bank loyalty both directly and indirectly through the corporate image. Hence, service providers should show some concern to the quality of their offered services.
CONCLUSIONS, LIMITATIONS, AND RECOMMENDATIONS
This current study found that a banking company needs to pay attention to its interaction quality, physical quality, and outcome quality in order to provide an excellent service quality for its customers. In the Indonesian banking sector, providing a high quality service is proven to be a way to enhance corporate image and customer loyalty.
quality and corporate image. Theoretically, there are several other factors that have been identified as affecting loyalty; therefore, further studies may include other factors to predict customer loyalty when arranging a more comprehensive study.
REFERENCES
Abdi, H. (2007). Partial least squares regression. In N. Salkind (Ed.), Encyclopedia of Measurement and Statistics. Thousand Oaks: Sage.
Aibinu, A. A., & Al-Lawati, A. M. (2010). Using PLS-SEM technique to model construction organizations' willingness to participate in e-bidding. Automation in Construction, 19(6), 714-724.
Alfin, R., Alhabsji, T., Nimran, U., & Suharyono. (2013). Effect of Service Quality and Product Quality to Corporate Image, Customer‟s Satisfaction and Customer‟s Trust. IOSR Journal of Business and Management,
Amin, M., & Isa, Z. (2008). An examination of the relationship between service quality perception and customer satisfaction: a SEM approach towards Malaysian Islamic banking. International Journal of Islamic and Middle Eastern Finance and Manage-ment, 1(3), 191-209.
Andreassen, T. W., & Lindestad, B. (1998). Customer loyalty and complex services: the impact of corporate image on quality, customer satisfaction and loyalty for customers with varying degrees of service expertise. International Journal of Service Industry Management, 9(1), 7-23.
Babakus, E., & Boller, G. W. (1992). An empirical assessment of the SERVQUAL scale. Journal of Business research, 24(3), 253-268.
Baker, J. A. (1987). The role of the environment in marketing services: The consumer perspective. In J. A. Czepiel, C. Congram & J. Shanahan (Eds.), The Service Challenge: Integrating for Competitive Advantage (pp. 79-84). Chicago: American Marketing Association.
Baker, J. A., Grewal, D., & Parasuraman, A. (1994). The influences of store environment on quality inferences and store image.
Journal of the Academy of Marketing Science, 22(4), 328-339.
Bank Indonesia. (2011). Banking Overview. Retrieved 9th November 2013, 2013, from http://www.bi.go.id/web/en/Perbankan/Ikhti sar+Perbankan/Lembaga+Perbankan/ Barroso, C., Carrión, G. C., & Roldán, J. L.
(2010). Applying maximum likelihood and PLS on different sample sizes: studies on SERVQUAL model and employee behavior model. In Handbook of partial least squares (pp. 427-447): Springer.
Bitner, M. J. (1992). Servicescapes: The impact of physical surroundings on customers and employees. Journal of Marketing, 56(2), 57-71.
Bontis, N., Booker, L. D., & Serenko, A. (2007). The mediating effect of organizational reputation on customer loyalty and service recommendation in the banking industry. Management Decision, 45(9), 1426-1445. Brady, M. K., & Cronin Jr, J. J. (2001). Some
new thoughts on conceptualizing perceived service quality: a hierarchical approach. Journal of marketing, 65(3), 34-49.
Carman, J. M. (1990). Consumer perceptions of service quality: An assessment of the SERVQUAL dimensions. Journal of Retailing,
Cham, T. H., & Easvaralingam, Y. (2012). Service quality, image and loyalty towards Malaysian hotels. International Journal of Services, Economics and Management, 4(4), 267-281.
Cheng, B.-L., & Rashid, M. Z. A. (2013). Service Quality and the Mediating Effect of Corporate Image on the Relationship between Customer Satisfaction and Customer Loyalty in the Malaysian Hotel Industry. Gadjah Mada International Journal of Business, 15(2)
Chin, W. W. (2010). How to write up and report PLS analyses. In V. Esposito-Vinzi, W. W. chin, J. Henseler & H. Wang (Eds.), Handbook of partial least squares (pp. 655-690): Springer.
An Empirical Analysis. Journal of Hospi-tality & Tourism Research, 35(4), 530-568. Clemes, M. D., Shu, X., & Gan, C. (2014).
Mobile communications: a comprehensive hierarchical modelling approach. Asia Pacific Journal of Marketing and Logistics, 26(1), 114-146.
Clemes, M. D., Wu, H.-C., J, Hu, B.-D., & Gan, C. (2009). An empirical study of behavioural intentions in the Taiwan hotel industry. Innovative Marketing, 5(3)
Clemes, M. D., Xu, S., & Gan, C. (2013). Mobile Communications: A Comprehensive Hierarchical Modelling Approach. Asia Pacific Journal of Marketing and Logistics, 26(1), 8-8.
Cronin, J. J. J., & Taylor, S. A. (1994). SERVPERF versus SERVQUAL: recon-colling performance-based and perception-minus-expectations measurement of service quality. Journal of Marketing, 58(1), 125. Czepiel, J. A., Solomon, M. R., Surprenant, C.
F., & Gutman, E. G. (1985). Service encounters: an overview. The service encounter, 3-5.
Dabholkar, P. A., Thorpe, D. I., & Rentz, J. O. (1995). A measure of service quality for retail stores: scale development and validation. Journal of the Academy of Marketing Science, 24(1), 3-16.
Dagger, T. S., Sweeney, J. C., & Johnson, L. W. (2007). A hierarchical model of health service quality scale development and investigation of an integrated model. Journal of Service Research, 10(2), 123-142.
Daryanto, A., de Ruyter, K., & Wetzels, M. (2009). Getting a discount or sharing the cost: the influence of regulatory fit on consumer response to service pricing schemes. Journal of Service Research, Falk, R. F., & Miller, N. B. (1992). A primer for
soft modeling: University of Akron Press. Fornell, C., & Larcker, D. F. (1981). Evaluating
structural equation models with unobser-vable variables and measurement error. Journal of Marketing Research (JMR), 18(1)
Geladi, P., & Kowalski, B. R. (1986). Partial least-squares regression: a tutorial. Analy-tica chimica acta, 185, 1-17.
Gremler, D. D., & Brown, S. W. (1996). Service loyalty; Its Nature, Importance and Implications. In E. B. Brown, S. W. Johnston & E. Scheuing (Eds.), Advancing Service Quality. New York: ISQA Inc. Gronroos, C. (1984). A service quality model
and its marketing implications. European Journal of Marketing, 18(4), 36-44.
Gustafsson, I.-B., Öström, Å., Johansson, J., & Mossberg, L. (2006). The five aspects meal model: A tool for developing meal services in restaurants. Journal of Foodservice, 17(2), 84-93.
Hart, A. E., & Rosenberger III, P. J. (2004). The effect of corporate image in the formation of customer loyalty: An Australian replication. Australasian Marketing Journal (AMJ), 12(3), 88-96.
Hayes, B. E. (2008). The true test of loyalty. Quality Progress, 41(6), 20.
Huang, Y.-K. (2010). The Effect of Airline Service Quality on Passengers‟ Behavioural Intentions Using SERVQUAL Scores: A TAIWAN Case Study. Journal of the Eastern Asia Society for Transportation Studies, 8, 2330-2343.
Huei, C. T., & Easvaralingam, Y. (2011). Perceptions of service quality, corporate image, and customer loyalty in the hotel industry of Malaysia. Paper presented at the The 2nd International Research Symposium in Service Management. Yogyakarta, INDONESIA.
Jones, T., & Taylor, S. F. (2007). The conceptual domain of service loyalty: how many dimensions? Journal of Services Marketing, 21(1), 36-51.
Kotler, P., & Amstrong, G. (2009). Marketing, an introduction. New Jersey: Pearson International.
Kotler, P., & Keller, K. L. (2006). Marketing Managemen (12 ed.). New Jersey Prentice Hall.
Lovelock, C. H., & Wirtz, J. (2011). Service marketing: people, technology, Strategy (7 ed.). New Jersey: Prentice Hall.
Mardalis, A. (2005). Meraih loyalitas pelanggan. Jurnal Manajemen dan Bisnis BENEFIT, 9(2)
Mohi, Z. (2012). An analysis of restaurant patrons' experiences in Malaysia: a com-prehensive hierarchical modelling approach. Lincoln University.
Nguyen, N., & LeBlanc, G. (1998). The mediatin role of corporate image on cus-tomer's retention decision: An investigation in financial services. International Journal of Bank Marketing, 16(2), 52-65.
Nunnally, J. (1978). Pyschometric Theory. New York: McGraw-Hill.
Oliver, R. L. (1997). Satisfaction: A Behavioral Perspective on the Consumer. New York: McGraw Hill.
Ostrowski, P. L., O'Brien, T. V., & Gordon, G. L. (1993). Service quality and customer loyalty in the commercial airline industry. Journal of Travel Research, 32(2), 16-24. Parasuraman, A., Zeithaml, V., & Berry, L. L.
(1988). SERVQUAL: A Multiple-Item Scale for Measuring Consumer percepcions of Service Quality. Journal of Retailing, 64, 41-50.
Parasuraman, A., Zeithaml, V. A., & Berry, L. L. (1985). A conceptual model of service quality and its implications for future research. The Journal of Marketing, 41-50. Pollack, B. L. (2009). Linking the hierarchical
service quality model to customer satisfaction and loyalty. Journal of Services Marketing, 23(1), 42-50.
Rust, R. T., & Oliver, R. L. (1994). Service quality: New directions in theory and practice. Thousand Oaks, Calif.: Sage Publications.
Saleem, H., & Raja, N. S. (2014). The Impact of Service Quality on Customer Satisfaction, Customer Loyalty and Brand Image: Evidence from Hotel Industry of Pakistan. Middle-East Journal of Scientific Research, 19(5), 706-711.
Shu, X. (2010). A Hierarchical model of the Chinese mobile communications market: an empirical analysis.
Tenenhaus, M., Amato, S., & Esposito Vinzi, V. (2004). A global goodness-of-fit index for PLS structural equation modelling. Paper presented at the Proceedings of the XLII SIS scientific meeting.
Wakefield, K. L., & Blodgett, J. G. (1996). The effect of the servicescape on customers' behavioural intentions in leisure service settings. Journal of Services Marketing, 10(6), 45-61.
Wold, H. (1982). Soft modelling: the basic design and some extensions. Systems Under Indirect Observation, PartII, 36-37.
Wong, A., & Sohal, A. (2003). Service quality and customer loyalty perspectives on two levels of retail relationships. Journal of Services Marketing, 17(5), 495-513.
Wu, H.-C. (2009). An empirical study of behavioural intentions in the Taiwan hotel industry. Lincoln University.