167 Gadjah Mada International Journal of Business - May-August, Vol. 16, No. 2, 2014
Gadjah Mada International Journal of Business
Vol. 16, No. 2 (May-August 2014): 167-183
* Corresponding author’s e-mail: jooyhong@skku.edu
ISSN: 1141-1128
http://www.gamaijb.mmugm.ac.id/
Fraud Firms and the Matching Principle:
Evidence from Korea
#Jooyeon Hong,
a*and
Wonsun Paek
aa) School of Business, Sungkyunkwan University, Korea
Abstract: This paper examines whether the degree of matching for poor-performing fraud firms varies depending on the strength of the causal relation between expenses and revenues. A stronger causal rela-tion exists between revenues and operating expenses than between revenues and total expenses that include non-operating expenses as well as operating expenses. Fraud firms have stronger incentives for managing earnings. Given that managing earnings is easier when using non-operating items than when using operating items, the degree of matching is (not) lower for fraud firms than for non-fraud firms at the strong (weak) level of the causal relation between revenues and expenses. Empirical results suggest that the degrees of matching are different between fraud and non-fraud firms only at the strong level of the causal relation between revenues and expenses. This result implies that the investigation of the match-ing model at a strong level of the causal relation between revenues and expenses is more effective than that at a weak level of the causal relation, with regard to examining the degree of matching for fraud firms. This study contributes to the literature by providing evidence on the importance of the level of the causal relation when examining the degree of matching.
Abstrak: Makalah ini membahas tentang apakah tingkat ketepatan untuk fraud firms berkinerja buruk bervariasi dan bergantung pada kekuatan hubungan kausal antara biaya dan pendapatan. Ada hubungan kausal yang lebih kuat antara pendapatan dan beban usaha dibandingkan dengan antara pendapatan dan yang biaya totalnya meliputi biaya nonoperasional serta biaya operasional. Fraud firms memiliki dorongan kuat untuk mengelola labanya. Mengingat bahwa pengelolaan laba lebih mudah jika menggunakan item nonoperasional dibandingkan saat menggunakan item operasional, tingkat ketepatan/tidak tepat lebih rendah untuk fraud firms dibandingkan non-fraud firms yang kuat/lemah tingkat hubungan kausal antara pendapatan dan beban. Hasil empiris menunjukkan bahwa tingkat ketepatan yang berbeda antara fraud firms dan non-fraud firms hanya terjadi pada tingkat yang kuat dari hubungan kausal antara pendapatan dan beban. Hasil ini menunjukkan bahwa investigasi dari model kausal ketepatan pada tingkat yang kuat dari hubungan kausal antara pendapatan dan beban lebih efektif daripada penelitian pada tingkat lemah dari hubungan kausal, yang berkaitan dengan meneliti tingkat ketepatan untuk fraud firms. Penelitian ini memberikan kontribusi literatur dengan memberikan bukti tentang pentingnya tingkat hubungan kausal ketika meneliti tingkat ketepatan.
Keywords: causal relationship; fraud firms; matching
# We appreciate the helpful comments from workshop participants at the International Joint Conference on
Hong and Paek
168
Introduction
This paper examines whether the degree of matching for fraud firms varies, depend-ing on the strength of the causal relationship between expenses and revenues. It is known that fraud firms manipulate special items more frequently than operating items (Albrecht et al. 2008; Beneish 1999; Choi and Paek 1998). When we examine the degree of the matching between revenues and expenses for fraud firms, it is more effective to con-sider the level of the causal relation between revenues and expenses.
In general, the matching is stronger be-tween sales and operating expenses or costs of goods sold than it is between revenues and total expenses. That is, to the extent that the matching with a strong causal relation is ef-fective to that with a weak causal relation, the degree of the matching for fraud firms should be examined by considering the strength of the causal relation.
We focus on the different degree of the matching for fraud vis-à-vis non-fraud firms. Fraud firms have incentives to hide their poor performance by manipulating non-operating items (e.g., special items). As a result, the degree of the matching for fraud firms will differ from that for non-fraud firms depend-ing on the level of a causal relation with ex-penses and revenues. In particular, at a weak level of the causal relation (such as revenues and total expenses), it is less likely that the degrees of the matching differ between fraud and non-fraud firms while at a strong level of the causal relation (such as revenues and operating expense or cost of goods sold), it is more likely to identify a difference of the degree of the matching between fraud and non-fraud firms. This study aims to provide evidence that the matching of expenses with
revenues is distinguishable, depending on the strength of the causal relation between ex-penses and revenues.
The sample consists of 166 fraud firm-years and 6,467 fraud firm-firm-years in non-banking industries that are traded over the Korea Exchange from 1997 to 2009. The fraud firms consist of firms against which enforcement actions are taken by the Korea Financial Supervisory Service. We document that the degree of the matching for fraud firms is (not) different from that for non-fraud firms when there is a strong (weak) level of the causal relation between revenues and ex-penses. Therefore, the matching at the level of the strong causal relation is more effec-tive than that at the level of the weak causal relation when we compare the different de-grees of the matching between fraud and non-fraud firms.
This study is different from prior stud-ies in that we consider the causal relation between expenses and revenues in examin-ing the matchexamin-ing. The examination of an over-all matching between total revenues and to-tal expenses is not helpful in distinguishing the degree of the matching between fraud and non-fraud firms.
The remainder of the paper is organized as follows. Section 2 discusses the prior lit-erature and develops the hypothesis. Section 3 describes the sample selection and research design. Section 4 presents the empirical re-sults, and Section 5 concludes.
Prior Literature and
Hypothesis
rec-169 Gadjah Mada International Journal of Business - May-August, Vol. 16, No. 2, 2014
ognized that such a review contributes to the improvement of the overall accounting qual-ity. The FSS selects “suspect firms” based on their financial ratios, discretionary accruals, and other financial data; it also reviews fi-nancial statements of suspect firms. The FSS also enforces penalties on firms, managers, and auditors per the review results.
The matching principle, which is a key concept in determining net income under the accrual basis together with the revenue rec-ognition principle, requires that expenses in-curred should be charged in the same period in which the corresponding revenues are earned. The Framework for the Preparation and Presentation of Financial Statements by the International Accounting Standards Board states the following:
“Expenses are recognized in the income state-ment on the basis of a direct association be-tween the costs incurred and the earning of spe-cific items of income. This process, commonly referred to as the matching of costs with rev-enues, involves the simultaneous or combined recognition of revenues and expenses that re-sult directly and jointly from the same transac-tions or other events; for example, the various components of expense making up the cost of goods sold are recognized at the same time as the income derived from the sale of the goods. However, the application of the matching con-cept under this Framework does not allow the recognition of items in the balance sheet which do not meet the definition of assets or liabili-ties” (para. 95).
When applying the matching principle, we face a serious problem of how to identify a causal relation between expenses and cor-responding revenues. Most expenses, except for costs of goods sold and some other oper-ating expenses, cannot be linked directly to revenues; hence, they are recorded during the
period in which cash is paid or liabilities are recognized. For non-current assets whose benefits are expected over several periods, the expenses should be systematically allocated over those periods. When assets are impaired, the expenses should be recognized immedi-ately. It is evident that these items do not fit in the framework of the traditional matching principle. Consequently, they cause a dete-rioration of proper matching and more im-portantly, the degree of the matching varies depending on the nature of expenses in rela-tion to revenues.
One stream of prior research documents that the matching between expenses and rev-enues has deteriorated over time (Dichev and Tang 2008; Donelson et al. 2011; Paek 2011a; Collins et al. 1997; Francis and Schipper 1999). Dichev and Tang (2008) present a trend of the matching between ex-penses and revenues over the last 40 years and reveal that the degree of matching has been decreasing. They also observe that earn-ings volatility increases and earnearn-ings persis-tence decreases over the same period. Paek (2011a) observes a similar trend in Korea. These studies have identified special items reflecting economic events, losses, deprecia-tion and discredeprecia-tionary accruals as primary causes for the decreasing pattern of the matching (Donelson et al. 2011; Paek 2011a). It is also documented that proper-matching firms have higher earnings qualities than poor-matching firms; moreover, the degree of matching varies systematically depending on a firm’s lifecycle stages (Paek 2011b; Paek and Park 2013; Park and Paek 2013).
Hong and Paek
170
Brazel et al. 2009). When a firm shifts oper-ating expenses into special items so as to hide its poor operating performance, the match-ing between revenues and total expenses is not likely to be affected; rather, the match-ing between revenues and operatmatch-ing expenses will be affected. This suggests that a differ-ent pattern of the matching between fraud and non-fraud firms can be identified at the level of the causal relation between revenues and specific categories of expenses.
Note that fraud firms manipulate earn-ings through more non-operating items (e.g., special items) than operating items (Marquardt and Wiedman 2004; Elliott and Hanna 1996). This leads us to believe that the degree of the matching above operating income (i.e., revenues and operating ex-penses) will be different from below operat-ing income (i.e., revenues and total expenses) between fraud and non-fraud firms. Thus, our hypothesis is as follows:
H: The revenue-expense matching is (not) less proper for fraud firms than for non-fraud firms at the strong (weak) level of causal relation between revenues and expenses.
Sample Selection and Research
Design
Sample selection
The initial sample is identified from the KIS-VALUE database. The sample is re-stricted to firm-years in order to include com-plete data for all variables in the empirical analysis. In order to synchronize the period of the fraud firms, the sample periods starts in 1997 and ends in 2009. To enhance ho-mogeneity of the sample, only non-banking firms are included. To mitigate the influence of extreme observations, we delete the top and bottom 1 percent of all variables. The final sample consists of 6,633 firm-year ob-servations from 1997 to 2009. Fraud firms are firms against which enforcement actions are taken by the Korean Financial Supervi-sory Service. The final numbers of non-fraud and fraud firm-years are 6,467 and 166, re-spectively. Table 1 summarizes the sample se-lection procedure.
Table 1. Sample Selection
Sample Selection Criteria Firm-years
Initial sample traded over the Korea Exchange for 1997-2009 with
December fiscal year end and operating in non-banking industries 9,548 Firm-years with missing values for all variables (2,200) Firm-years outside the most extreme 1 percentiles (715)
Final sample 6,633
Fraud sample that is enforced by the Korean Financial Supervisory Service
for 1997-2009 166
171 Gadjah Mada International Journal of Business - May-August, Vol. 16, No. 2, 2014
Research Models
We adopt Dichev and Tang’s (2008) model, which regresses the current-period revenues on previous-period, current-period, and next-period expenses. In this model, a large coefficient on current-period expenses implies proper matching between contempo-raneous revenues and expenses. We use the following three versions of Dichev and Tang model: (i) total expenses and total revenues, (ii) operating expenses and net sales, and (iii) cost of goods sold and net sales.
REVt= 0 + 1 EXPt-1 + 2 EXPt + culated as the sum of sales and non-operat-ing income, EXPt is total expenses for year t, calculated as the difference between revenues and net income for year t, Salest is net sales for year t, OPEREXPtis operating expenses for year t, calculated as the difference between sales and operating income, COGStis cost of goods sold for year t; all are deflated by aver-age assets.
We consider Equation (1) as a weak causal relation, and Equations (2) and (3) as strong causal relations.
To test the hypothesis, we modify Mod-els (1)-(3) by adding an indicator variable for fraud firms (Fraudt) and its interaction with expenses. Thus, we estimate the following models: the Korean Financial Supervisory Service in year t, and 0 otherwise; all other variables are as defined in the below Equation (3).
If the matching is indistinguishable be-tween fraud and non-fraud firms at the weak level of the causal relation, we predict the coefficients on Fraudt*EXPt (16) to be insig-nificantly different from zero. On the other hand, if the matching becomes less proper for fraud firms than non-fraud firms at the strong level of the causal relation, we pre-dict the coefficients on Fraudt*OPEREXPt
Hong and Paek
172
Results
Descriptive Statistics and
Correlation
Descriptive statistics for the main vari-ables are presented in Table 2. For non-fraud firm years in panel A, the mean and median of total revenue (REVt) are 100.3 percent and 93.7 percent of the average total assets, respectively. The mean and median of net sales (Salest) are 94.8 percent and 88.5 per-cent of the average total assets, respectively. The mean (median) of total expenses (EXPt) is 99.2 percent (92.3%) of the average total assets, and the mean (median) of operating expenses (OPEREXPt) is 90.3 percent (83.3%) of the average total assets. The mean (median) of cost of goods sold (COGSt) is 78.0 percent (71.7%) of the average total assets.
For fraud firm years in Panel B, the fraud firm-years’ mean (median) of EXPt,
OPEREXPt, and COGSt are, respectively, 88.3 percent (79.8%), 75.6 percent (68.5%), and 65.0 percent (58.4%) of the average to-tal assets. It is not unusual that fraud firms show poorer performance than non-fraud firms in almost every aspect (Kirkos et al. 2007, Persons 1995, Choi and Choe 2003).
Table 3 shows the correlation among the main variables. Pearson correlations are be-low the diagonal and Spearman correlations are above the diagonal. Spearman correlation between total revenues (REVt) and total
ex-penses (EXPt) is 0.958, whereas the correla-tion between net sales (Salest) and total ex-penses (EXPt), operating expenses (OPEREXPt), and cost of goods sold (COGSt) is 0.950, 0.982, and 0.934, respec-tively. Not surprisingly, the correlation be-tween net sales and operating expenses is larger than the correlation between net sales and total expenses. However, the correlation between net sales and cost of goods sold is smaller than that between net sales and op-erating expenses or total expenses.
Trend of the Matching between
Revenues and Expenses
In Table 4, we report the results of the trend of the matching. Panel A of Table 4 presents the trend of the matching between revenues and expenses over the sample pe-riod. The coefficients on EXPt in Equation (1) show a slightly increasing trend over time. However, the coefficients on OPEREXPt and
COGStin Equations (2) and (3) do not show a noticeable trend over time. Mean (median) coefficients on EXPt, OPEREXPt and COGSt
are 0.974, 1.035, and 1.083, respectively. The result indicates that the means of the three coefficients are significantly different from each other in the decreasing order of COGSt,
173 Gadjah Mada International Journal of Business - May-August, Vol. 16, No. 2, 2014
Table 2. Descriptive Statistics Panel A: Non-fraud sample
Variables N Mean Std Dev. Median Min Max
REVt 6,467 1.003 0.435 0.937 0.138 3.269
Salest 6,467 0.948 0.431 0.885 0.097 3.088
EXPt 6,467 0.992 0.419 0.923 0.175 3.203
OPEREXPt 6,467 0.903 0.414 0.833 0.124 3.020
COGSt 6,467 0.780 0.398 0.717 0.049 2.854
Et 6,467 0.010 0.103 0.025 -0.687 0.280
Panel B: Fraud sample
Variables N Mean Std Dev. Median Min Max
REVt 166 0.837 0.366 0.760 0.215 2.543
Salest 166 0.778 0.372 0.711 0.173 2.480
EXPt 166 0.883 0.352 0.798 0.367 2.615
OPEREXPt 166 0.756 0.356 0.685 0.263 2.455
COGSt 166 0.650 0.351 0.584 0.091 2.339
Et 166 -0.046 0.139 0.003 -0.645 0.111
This table reports descriptive statistics for non-fraud and fraud samples.
Variable definitions:
REVtis total revenues for year t, calculated as the sum of sales and non-operating income, EXPt is total expenses for year
t, calculated as the difference between revenues and net income for year t, Salestis net sales for year t, OPEREXPtis
operating expenses for year t, calculated as the difference between sales and operating income, COGStis cost of goods
sold for year t, Et is net income for year t, and all deflated by average assets.
Table 3. Correlations
Variables REVt Salest EXPt OPEREXPt COGSt Et
REVt 0.989*** 0.958*** 0.976*** 0.931*** 0.337***
Salest 0.992*** 0.950*** 0.982*** 0.934*** 0.318***
EXPt 0.971*** 0.965*** 0.975*** 0.930*** 0.130***
OPEREXPt 0.983*** 0.987*** 0.983*** 0.956*** 0.211***
COGSt 0.953*** 0.956*** 0.953*** 0.970*** 0.178***
Et 0.274*** 0.265*** 0.037*** 0.156*** 0.153***
This table reports Pearson (Spearman) correlation below (above) the diagonal. Two-tailed t-test, *** indicate significance at the 1 percent levels.
Ho
ng
and
Pa
ek
174
Table 4. Matching between Revenues and Expenses Over Time
Panel A. Trend of matching between revenue and expense
Year N 1 1 1 2 2 2 3 3 3
1997 554 0.007 -0.020 -0.012 0.922*** 0.978*** 0.997*** 0.084*** 0.067*** 0.078***
1998 532 -0.140*** -0.131*** -0.170 0.974*** 1.093*** 1.202*** 0.190*** 0.086*** 0.042
1999 517 -0.024 -0.031 -0.017 0.858*** 1.007*** 1.075*** 0.150*** 0.053*** 0.012
2000 519 -0.034 -0.016 -0.016 0.897*** 0.951*** 0.983*** 0.114*** 0.087*** 0.075
2001 493 -0.078*** -0.066*** -0.155*** 0.991*** 1.036*** 1.223*** 0.084*** 0.049*** -0.036
2002 481 -0.058 -0.094*** -0.062 0.958*** 1.077*** 1.095*** 0.086*** 0.031 -0.007
2003 499 -0.099*** -0.080*** -0.121*** 1.002*** 1.042*** 1.169*** 0.068*** 0.033 -0.037
2004 501 -0.098*** -0.090 -0.059 1.000*** 1.054*** 1.068*** 0.073*** 0.032 -0.001
2005 510 -0.085 -0.091 -0.033 1.043*** 1.070*** 1.002*** 0.040*** 0.029 0.021
2006 507 -0.030 -0.052 -0.085 0.956*** 1.004*** 1.042*** 0.075*** 0.062 0.028
2007 510 -0.061 -0.066 -0.049 1.061*** 1.056*** 1.095*** 0.010 0.034 -0.040
2008 503 -0.065 -0.092 -0.048 0.973*** 1.057*** 0.958*** 0.090 0.057 0.103
2009 507 -0.022 -0.031 -0.015 1.032*** 1.035*** 1.164*** 0.017*** 0.022 -0.015
Pooled 6633 -0.053 -0.065 -0.073 0.966 1.037 1.082 0.088 0.045 0.014
175
Ga
dja
h Mad
a In
ter
natio
nal
Jou
rnal
of Bu
sines
s
- May
-Au
gust
, Vol
. 16,
No
. 2, 20
14
Panel B. Test of trend
Dependent Variables
1 1 1 2 2 2 3 3 3
Pooled
Intercept (d0) -0.18 1.75 -5.61 -18.7** -5.15 5.81 18.6*** 6.71** 5.32
Yeart (d1) 0.00 -0.00 0.00 0.01** 0.00 -0.00 -0.01*** -0.01** -0.00
R² 0.00 0.01 0.04 0.44 0.09 0.01 0.54 0.36 0.05
Fraud firms
Intercept (d0) -49.9 78.8* 327.6** 48.2 -130.4* -273.3** 18.2 61.1 -41.4
Yeart (d1) 0.02 -0.04* -0.16** -0.02 0.07* 0.14** -0.01 -0.03 0.02
R² 0.08 0.23 0.33 0.04 0.30 0.36 0.02 0.18 0.02
Non-fraud firms
Intercept (d0) 0.00 0.84 1.40 -18.2** -4.50 6.10 18.1*** 7.09** 5.10
Yeart (d1) -0.00 -0.00 -0.00 0.01** 0.003 -0.003 -0.01*** -0.003** -0.00
R² 0.000 0.002 0.003 0.44 0.07 0.01 0.52 0.37 0.04
Panel A shows the trend of matching between revenues and expenses using the following equations:
REVt= 0 + 1 EXPt-1 + 2 EXPt + 3 EXPt+1 + t... (1)
Salest= 0 + 1 OPEREXPt-1 + 2 OPEREXPt + 3 OPEREXPt+1 + t... (2)
Salest= 0 + 1 COGSt-1 + 2 COGSt + 3 COGSt+1 + vt... (3)
Panel B shows the results of the trend test using the following equation: cit = d0 + d1 Yeart + et... (7)
Two-tailed t-test with t-statistics adjusted for clustering of standard errors by industry and year. ***, **, and * denote significance at the 1 percent, 5 percent, and 10 percent levels, respectively.
Variable definitions:
cit is ith coefficient for year t from Equations (1)-(3), and Yeart is the sample period (1997, . . . , 2009), and other variables as defined in Table 2.
Variables
Hong and Paek
176
Panel B in Table 4 shows the results of the following regression in which the coeffi-cient estimates from Equations (1)-(3) are re-gressed on the sample period (Yeart):
cit = d0 + d1 Yeart + eit ...(7)
where cit is the ith coefficient for year t from Equations (1)-(3), and Yeart is the sample pe-riod (1997, . . . , 2009).
In Equation (7), a positive (negative) coefficient on Yeart indicates an increasing (decreasing) trend of the degree of the match-ing between sales and expenses.
Panel B in Table 4 presents that the trend of the matching for the pooled sample is dominated by the non-fraud sample. Also, the contemporaneous matching between rev-enue and total expenses 2) is significantly positive only for the non-fraud sample, im-plying that for the non-fraud sample, the matching between revenues and total ex-penses is enhanced over time; yet, the con-temporaneous matching between sales and operating expenses or cost of goods sold (2, 2) is significantly positive only for the fraud sample, showing that for the fraud sample, the matching between revenues and operat-ing expenses or cost of goods sold is improved over time. Further, the lagged matching (1, 1) shows a more decreasing trend for the fraud sample than the non-fraud sample. The lead matching (3, 3, 3) does not show a noticeable difference in the trend between fraud and non-fraud samples.
Though not consistent with prior stud-ies, this suggests that there’s a difference of the matching patterns between fraud and non-fraud samples. The inconsistent evidence on the enhanced contemporaneous matching between revenues and total expenses might result from a shorter sample period in this
study compared to prior studies. Further, firms experience several economic crises dur-ing this period so that the trend of the match-ing reported in Table 4 might not be typical.
The Matching between Revenues
and Expenses for Fraud and
Non-fraud Firms
Table 5 presents the regression results of estimating Equations (4)-(6). We investi-gate whether the degree of the matching for fraud firms is different from the degree of matching for non-fraud firms.
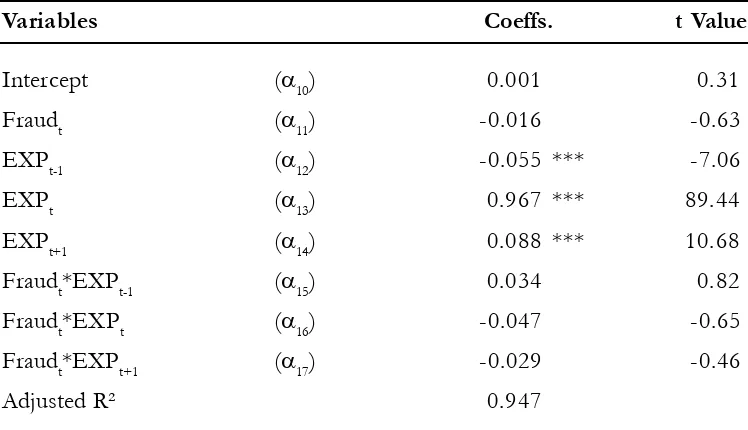
In panel A, we present the result of the matching between total expenses and total revenues. The coefficient on current-period total expenses (EXPt) for non-fraud firms is significantly positive (0.967). The incremen-tal coefficient on current-period toincremen-tal expense for fraud firms is insignificantly different from zero. This result suggests that the degree of the matching between total expenses and to-tal revenues for fraud firms is not different from that for non-fraud firms at the weak level of the causal relationship.
Panel B presents the result of the matching between operating expenses and net sales. The coefficient on current-period op-erating expenses (OPEREXPt) is significantly positive (1.038), while the incremental coef-ficient on operating expenses for fraud firms is insignificant. This suggests that the match-ing of fraud firms is again not different from that of the non-fraud firms at the level of operating expenses.
177 Gadjah Mada International Journal of Business - May-August, Vol. 16, No. 2, 2014
than for non-fraud firms. Overall, the result in Table 5 provides evidence that the level of the causal relation between revenues and
Table 5. Matching between Revenues and Expenses
Panel A. Matching between total revenues and total expenses
Variables Coeffs. t Value
Intercept (10) 0.001 0.31
Fraudt (11) -0.016 -0.63
EXPt-1 (12) -0.055 *** -7.06
EXPt (13) 0.967 *** 89.44
EXPt+1 (14) 0.088 *** 10.68
Fraudt*EXPt-1 (15) 0.034 0.82 Fraudt*EXPt (16) -0.047 -0.65 Fraudt*EXPt+1 (17) -0.029 -0.46
Adjusted R² 0.947
Panel B. Matching between sales and operating expenses
Intercept (10) 0.025 *** 6.40
Fraudt (11) -0.015 -1.02
OPEREXPt-1 (12) -0.066 *** -10.02
OPEREXPt (13) 1.038 *** 132.12
OPEREXPt +1 (14) 0.044 *** 7.72 Fraudt*OPEREXPt -1 (15) 0.013 0.40 Fraudt*OPEREXPt (16) -0.074 -1.26 Fraudt*OPEREXPt+1 (17) 0.058 1.26
Adjusted R² 0.975
Hong and Paek
178
Table 5 (Continued)
Panel C. Matching between sales and cost of goods sold
Variables Coeffs. t Value
Intercept (10) 0.147 *** 13.46
Fraudt (11) -0.026 -1.06
COGSt-1 (12) -0.074 *** -7.04
COGSt (13) 1.085 *** 116.50
COGSt+1 (14) 0.012 * 1.78
Fraudt*COGSt-1 (15) 0.070 * 1.75 Fraudt*COGSt (16) -0.210 *** -3.12 Fraudt*COGSt+1 (17) 0.129 ** 2.36
Adjusted R² 0.915
Panel A presents the different matching between revenues and total expenses for the fraud and non-fraud samples using the following equation:
REVt=10 + 11 Fraudt + 12 EXPt-1 +13 EXPt + 14 EXPt+1 + 15 Fraudt*EXPt-1 + 16 Fraudt*EXPt +17 Fraudt*EXPt+1 + t... (4) Panel B presents the different matching between revenues and operating expenses for the fraud and non-fraud samples using the following equation:
Salest= 10 + 11 Fraudt +12 OPEREXPt-1 + 13 OPEREXPt + 14 OPEREXPt+1 + 15 Fraudt*OPEREXPt-1 + 16 Fraudt*OPEREXPt + 17 Fraudt*OPEREXPt+1 +
ut.... (5)
And Panel C presents the different matching between revenues and cost of goods sold for the fraud and non-fraud samples using the following equation:
Salest= 10 + 11 Fraudt + 12 COGSt-1 + 13 COGSt + 14 COGSt+1 + 15 Fraudt*COGSt-1 + 16 Fraudt*COGSt + 17 Fraudt*COGSt+1 + vt... (6)
Two-tailed t-test with t-statistics adjusted for clustering of standard errors by industry and year. ***, **, and * denote significance at the 1 percent, 5 percent, and 10 percent levels, respectively.
Variable definitions:
179 Gadjah Mada International Journal of Business - May-August, Vol. 16, No. 2, 2014
Prior literature documents that loss firms show different characteristics from profit firms (Hayn 1995; Altman 1968). As a robustness check, we re-perform the analy-sis after excluding loss firms and present the results in Table 6. Panel A shows the results of the matching of total cost with total rev-enue for profit samples. The coefficient of fraud firms’ current-period expenses is insig-nificantly different from the coefficient of non-fraud firms’ current-period expenses, consistent with the results in Table 5.
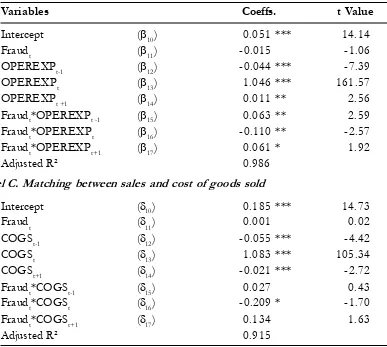
Panel B presents the result of the matching between net sales and operating expenses. The incremental coefficient on fraud firms’ current-period operating ex-penses is significantly negative (-0.110), sug-gesting that the degree of the matching is lower for fraud firms than for non-fraud firms at the level of operating expenses.
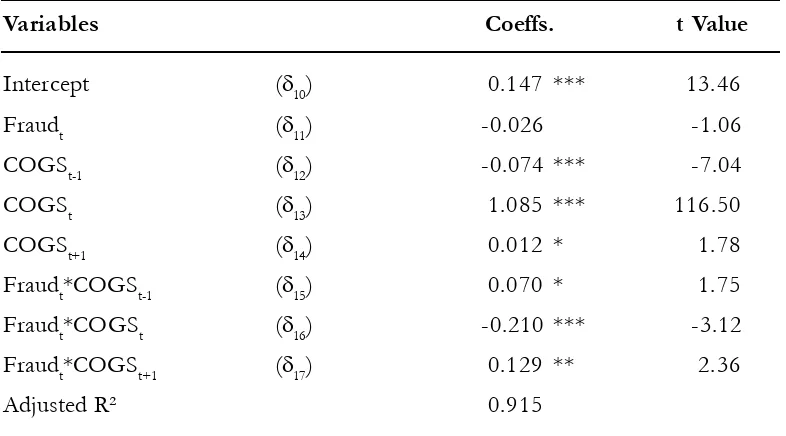
Panel C shows the results of the match-ing between net sales and cost of goods sold. The incremental coefficient for fraud firms’ current-period cost of goods sold is signifi-cantly negative, indicating that the matching is less proper for fraud firms than for non-fraud firms at the level of cost of goods sold. In conclusion, when the causal relation between revenues and expenses is weak (i.e., total revenues and total expenses), it is diffi-cult to distinguish the degree of the match-ing between fraud firms and non-fraud firms. However, when the causal relation between revenues and expenses is strong (i.e., net sales and cost of goods sold), we are able to effec-tively distinguish the degree of the matching between fraud and non-fraud firms.
Table 6. Matching between Total Revenues and Total Expenses, Excluding Loss Firms Panel A. Matching between total revenues and total expenses
Variables Coeffs. t Value
Intercept (10) 0.037 *** 12.95
Fraudt (11) -0.021 ** -1.98
EXPt-1 (12) -0.006 -1.25
EXPt (13) 1.015 *** 200.26
EXPt+1 (14) 0.003 1.03
Fraudt*EXPt-1 (15) 0.016 0.80 Fraudt*EXPt (16) -0.025 -0.76 Fraudt*EXPt+1 (17) 0.016 0.75
Hong and Paek
180
Table 6 (Continued)
Panel B. Matching between sales and operating expenses
Variables Coeffs. t Value
Intercept (10) 0.051 *** 14.14
Fraudt (11) -0.015 -1.06
OPEREXPt-1 (12) -0.044 *** -7.39
OPEREXPt (13) 1.046 *** 161.57
OPEREXPt +1 (14) 0.011 ** 2.56
Fraudt*OPEREXPt -1 (15) 0.063 ** 2.59 Fraudt*OPEREXPt (16) -0.110 ** -2.57 Fraudt*OPEREXPt+1 (17) 0.061 * 1.92
Adjusted R² 0.986
Panel C. Matching between sales and cost of goods sold
Intercept (10) 0.185 *** 14.73
Fraudt (11) 0.001 0.02
COGSt-1 (12) -0.055 *** -4.42
COGSt (13) 1.083 *** 105.34
COGSt+1 (14) -0.021 *** -2.72
Fraudt*COGSt-1 (15) 0.027 0.43 Fraudt*COGSt (16) -0.209 * -1.70 Fraudt*COGSt+1 (17) 0.134 1.63
Adjusted R² 0.915
This table presents the different matching between revenues and expenses for the fraud and non-fraud samples, after excluding loss firms. Panel A presents the different matching between revenues and total expenses for the fraud and non-fraud samples using the following equation:
REVt=10 + 11 Fraudt + 12 EXPt-1 +13 EXPt + 14 EXPt+1 + 15 Fraudt*EXPt-1 + 16 Fraudt*EXPt +17 Fraudt*EXPt+1 + t... (4) Panel B presents the different matching between revenues and operating expenses for the fraud and non-fraud samples using the following equation:
Salest= 10 + 11 Fraudt +12 OPEREXPt-1 + 13 OPEREXPt + 14 OPEREXPt+1 + 15 Fraudt*OPEREXPt-1 + 16 Fraudt*OPEREXPt + 17 Fraudt*OPEREXPt+1 +
ut.... (5)
And Panel C presents the different matching between revenues and cost of goods sold for the fraud and non-fraud samples using the following equation:
Salest= 10 + 11 Fraudt + 12 COGSt-1 + 13 COGSt + 14 COGSt+1 + 15 Fraudt*COGSt-1 + 16 Fraudt*COGSt + 17 Fraudt*COGSt+1 + vt... (6)
Two-tailed t-test with t-statistics adjusted for clustering of standard errors by industry and year. ***, **, and * denote significance at the 1 percent, 5 percent, and 10 percent levels, respectively.
181 Gadjah Mada International Journal of Business - May-August, Vol. 16, No. 2, 2014
Conclusion
Expenses are recognized by applying the matching principle on the basis of a causal relation between expenses incurred and rev-enue earned. Expenses are also recognized when a decrease of economic benefits, re-lated to a decrease in an asset or an increase of a liability, can be measured reliably. The matching principle should be cautiously ap-plied when we compare between fraud and non-fraud firms, given that fraud firms con-vey a different recognition of expenses in order to manipulate earnings. This study ex-amines whether the degree of matching for fraud firms is different from that for non-fraud firms depending on the level of a causal rela-tionship between expenses and revenues. Note that fraud firms are known to mask their economic performance to manipulate earn-ings by mostly using non-operating items. We expect that the degree of matching for fraud firms is different from that for non-fraud firms at the strong level of the causal relation be-tween expenses and revenues, while there is no difference of the matching between fraud and non-fraud firms at the weak causal rela-tion.
Empirical results indicate that the de-gree of matching for fraud firms is different from that for non-fraud firms when the causal relation is strong (e.g., between cost of goods sold and sales or between operating expenses and sales); however, the degree of the match-ing for fraud firms does not differ from that for non-fraud firms when the causal relation is weak (e.g., between total expenses and
to-tal revenues). This result implies that the dif-ferent degrees of the matching between ex-penses and revenues exist at the varying lev-els of the causal relation between expenses and revenues.
An innovative aspect of this study is that we use actual fraud firms against which the Korean Financial Supervisory Service took enforcement actions. This study contrib-utes to the literature by emphasizing the im-portance of the level of the causal relation with respect to the matching between ex-penses and revenues. Thus, when comparing fraud firms to non-fraud firms, investors should pay attention to the causal relation between expenses and revenues.
Hong and Paek
182
References
Albrecht, W. S., C. C. Albrecht, C. O. Albrecht, and M. F. Zimbelman. 2008. Fraud Examination. Mason, Ohio: Thompson-Southwestern.
Altman, E. I. 1968. Financial ratio, discriminant analysis, and the prediction of corporate bankruptcy. The Journal of Finance 23 (4): 589-609.
Beneish, M. D. 1999. The detection of earnings manipulation. Financial Analysts Journal 55(5): 24-36. Brazel, J. F., K. L. Jones, and M. F. Zimbelman. 2009. Using nonfinancial measures to assess fraud risk.
Journal of Accounting Research 47(5): 1135-1166.
Collins, D., E. Maydew, and I. Weiss. 1997. Changes in the value relevance of earnings and book values over the past forty years. Journal of Accounting and Economics 24: 39-67.
Choi, K. and K. Choe. 2003. An analysis of the corporate characteristics of companies reporting aggres-sive accounting. Korean Accounting Review 28(2): 211-245.
Choi, K. and W. Paek. 1998. Empirical study about the earning manipulation of enforcement firms.
Korean Accounting Review 23(2): 133-161.
Dichev, I. and V. Tang. 2008. Matching and the changing properties of accounting earnings over the last 40 years. The Accounting Review 83(6): 1425-1460.
Donelson, D., R. Jennings, and J. McInnis. 2011. Changes over time in the revenue-expense relation: Accounting or economics? The Accounting Review 86(3): 945-974.
Elliott, J., and D. Hanna. 1996. Repeated accounting write-offs and the information content of earnings.
Journal of Accounting Research 34(Supplement): 135-155.
Francis, J. and K. Schipper. 1999. Have financial statements lost their relevance? Journal of Accounting Research 37(2): 319-352.
Fan, Y., A. Barua, W. Cready, and W. Thomas. 2010. Managing earnings using classification shifting: Evi-dence from quarterly special item. The Accounting Review 85 (4): 1303-1323.
Hayn, C. 1995. The information content of losses. Journal of Accounting and Economics 20: 125-153 International Accounting Standards Board (IASB). 2001. Framework for the Preparation and Presentation of
Financial Statements.
Kirkos, Efstathios, C. Spathis, and Y. Manolopoulos. 2007. Data mining techniques for the detection of fraudulent financial statements. Expert Systems with Applications 32: 995-1003.
Marquardt, C. A., and C. I. Wiedman. 2004. How are earnings managed? An examination of specific accruals. Contemporary Accounting Research 21: 461-489.
McVay, S. 2006. Earnings management using classification shifting: An examination of core and special items. The Accounting Review 81: 501-531.
Paek, W. 2011a. The change in accounting environment and the matching principle. Korean Management Review 40(1): 29-49.
Paek, W. 2011b. The matching principle and earnings quality. Korean Accounting Review 36(2): 101-127. Paek, W., and S. Park. 2013. Firm life-cycle stages, revenue-expense matching, and the differential patterns
183 Gadjah Mada International Journal of Business - May-August, Vol. 16, No. 2, 2014
Park, S., and W. Paek. 2013. The effects of matching principle on incremental value relevance and relative pricing multiples between accounting information. Korean Accounting Review 38(1): 173-208. Persons, O. S. 1995. Using financial statement data to identify factors associated with fraudulent factors