Ilmu Pertanian (Agricultural Science)
Vol. 1 No.1 April, 2016 : 037-046
Available online at http://journal.ugm.ac.id/jip
DOI: doi.org/10.22146/ipas.9295
How to Mitigate The Production Risks on Coastal Red Chilli Farming in
Kulon Progo Regency
Azmi Basyarahil, Irham, Lestari Rahayu
Magister Management of Agribusiness, Faculty of Agriculture, Universitas Gadjah Mada Jln. Flora no. 1, Bulaksumur, Sleman, Yogyakarta 55281
*Corresponding email: [email protected]
ABSTRACT
The southern part of the Special Province of Yogyakarta consists of a coastline spanning over 113 km, under the administrations of Bantul, Gunung Kidul and Kulon Progo regencies, that can become an asset and resource of an important economy. Cabe Merah (red chilli) is one of the commodities that show high numbers of productivity in Kulon Progo Regency. Activities of red chilli farming on the coastal land of this regency have been growing, especially since the establishment of commodity auction market to help farmers sell their harvests. The study was conducted to (1) find out the size of production in red chilli agribusiness on coastal land, (2) to analyze the risk levels of production faced by the farmers, and (3) how to mitigate the production risks on coastal red chilli farming. There were 40 participating farmers from Banaran Village, Galur Sub-district, Kulon Progo Regency. The location was intentionally chosen by using multistage area sampling method. The data used were collected from the production and income of three growing seasons. Data analyses were performed using production risk and The House of Risk methods. Based on the variance coefficient, the production risks level was at 0.03 with the production lower limit of 9,596 Kg/Ha, which showed a low level of risk. The various risk mitigation strategies have been performed by the farmers to lessen the risks that can causes losses in the process of coastal red chilli productions.
Received: 20
thFebruary 2016; Revised: 18
thMarch 2017; Accepted: 2
ndJuly 2017
INTRODUCTION
The southern border of Provinsi Daerah Istimewa Yogyakarta (DIY – The Special Region of Yogyakarta) consists of a 113 km Indian Ocean coastline as parts of Gunung Kidul, Bantul, and Kulon Progo regencies that can become important assets and economic resources. In 2004, a research team from Faculty of Agriculture, Universitas Gadjah Mada (UGM) were able to show that many commodities thrived on coastal lands after some soil manipulation. Those commodities were egg plant, shallot, melon, watermelon, corn, papaya, mustard green, and red chilli. This breakthrough was heartily embraced by the farmers. Based on quality, the developments of irrigation and fertilizer application methods on coastal farm lands produce better harvests and increased productivity.
On the coastal farming areas in Kulon Progo Regency, red chilli is one of the main commodities and its production increases significantly every year. In 2014 this regency
is the top red chilli producing region in the province with the highest production of 12.51 thousand tons, the largest area with 1.53 thousand hectares, and the highest productivity with 8.16 tons per hectare (National Statistics Agency, 2015). To protect the farmers, the government established an auction market to anticipate the price drop caused by bountiful harvests. The base auction price for red chilli of IDR 15,000.00 to IDR 20,000.00 per kg at the market has helped the farmers (Kusumaningrum et. al., 2015). This market model is more profitable than the direct sale to traders. The daily auctions are attended by buyers from all over the place, such Semarang, Temanggung, Muntilan, Wonosobo, and Purwokerto. With a closed auction system, farmers can get prices comparable to those in Jakarta's market, and sometimes higher.
on other plots. The average chilli farming productivity in Kulon Progo is 9 ton/ha, but it reaches 14-15 ton/ha on coastal lands. This agricultural productivity will reach the optimal point when red chilli farming receives organic inputs with correct doses, timing and nutrients. However, since coastal farming of red chilli is a relatively new practice, the technical and operational managements might not have been optimal. It is, therefore, important to further study the risk levels that the farmers face.
The biggest risk facing red chilli farming on coastal lands comes from natural factors, such as climate, weather, flooding, and pest infestation. These factors can become obstacles in fulfilling the market demands for red chilli. The production risks in red chilli agribusiness should be analyzed because they affect the productivity and pose a potential for losses that the farmers have to be responsible for. This study is to find out the size of production in red chilli agribusiness on coastal land, to analyze the risk levels of production faced by the farmers, and also how to mitigate the production risks on red chilli coastal farming in Kulon Progo Regency.
MATERIALS AND METHODS
Method of Collecting Data
The basic method chosen to analyze the data was descriptive analysis. This study used multistage sampling area method, ie. area sampling based on a predetermined population size which is determined from chosen criteria after thoroughly considering the stratification aspects (Schaeffer et al., 1990). Several sub-districts were chosen for sampling, and then one village in each sub-district that met the criteria and had sufficient data was chosen randomly. One farmers' group that had the highest chilli farming productivity was chosen on purposive for the study. This distinction fell on to “Sido Dadi” farmers group that had 40 members and was located in Banaran Village, Galur Sub-district. These farmers planted red chilli on the coastal land of Trisik Beach. Each farmer was considered as one Agribusiness Unit (UT = usahatani). The primary data were collected from the farmers in December 2015 to January 2016, consisting of three growing periods or planting season (MT = musim tanam) which were MT 1 (August – November 2014), MT II (April – July 2015), and MT III (August – November 2015).
Analitical Method
The data analyses used in this study were quantitative and qualitative analyses. The quantitative
analyses were employed to analyzed risks by calculating the expected values, standard deviations, coefficient of variation, lower-upper values, production, price, and revenue. According to Kadarsan (1995), risk coefficient was the comparison between the risk that the farmers are responsible for and the profits they gain. Subsequently, the larger the risk coefficient, the larger the risk that the farmers face. The relation between the lower limit of highest income (L) with coefficient of variation (CV) is: if CV > 0.5 then L < 0, which means that losses may be experienced by farmers; and if CV < 0.5 then L > 0, which means that farmers will not experience losses.
According to the available literature (Anderson
et al., 1977; Elton and Gruber, 1995; and Fariyanti, 2008), the risk parameters can be obtained from variance, standard deviation, and coefficient of variation. This method has been used to analyze risks in agribusiness ventures such as tobacco production in Magelang, Central Java (Ihsanudin, 2010), subsistent rice farming in Impenso, Central Sulawesi (Lamusa, 2010), rice production in Pinrang (Arifin, 2013), tomato production in Tanggamus (Heriani et al., 2013), and mangrove crab fishing in Pontianak, West Kalimantan (Imelda, 2012).
Whereas the qualitative analyses were performed descriptively through The House of Risk method. Data were collected from questionaires, observations, in-depth interviews, and focus group discussions. The House of Risk method was used to analyzed these data for identifying risk events and risk agents, determining the correlation between them, mapping risks, determining effectiveness and difficulty level of the mitigation strategies, and prioritizing the mitigation strategies for the Sido Dadi farmers' group in managing coastal red chilli farming. There were two phases in this model (SCRLC, 2011): 1. Risk Mapping Phase (House of Risk1):
This phase comprised identifying risks and determining risk agents that should be prioritized for mitigation or prevention steps. This risk mapping method was described by Curtis (2008) to classify risks in five aspects, ie: raw and supporting materials, seasons, productions, growing methods and technologies, and labor. This phase was undertaken in several steps:
a. Identifying risk events that occured based on production risk classification, and listing those risks on a table (House of Risk 1 Table).
Institute, 2007). The impact values of the risk events are recorded on the right most column of the table, represented by Si.
c. Identifying risk agents and scoring the frequency (likelihood or probability) that a particular risk agent might occur, in a 1-5 scale with 1 representing an unlikelihood and 5 representing an almost certainty. Risk agents (A) are listed on the top of the table, whereas the event frequencies (Pj) are
listed on the bottom row.
d. Making a relationship matrix, Rij, between every
risk agent and risk event using a {0, 1, 3, 9} scale. Zero value means that there is no correlation, while 1, 3, and 9 indicate that the correlation is low, moderate and high.
e. Calculating aggregate risk potensial (ARP), that was determined from the frequency that risk agent joccured, and aggregate impact resulting from risk events caused by agent j, with the formula below:
f. Ranking the risk agents based on ARP from the highest to the lowest.
2. Risk Mitigation Phase (House of Risk2) This phase was to determine the priority of effectiveness of mitigation steps based on the resources availability and difficulty level of their implementations. This phase was performed in the following steps: a. Determining several risk agents with the highest
priorities, using Pareto analyses from ARPj. On the House of Risk 2 Table, the chosen risk agents are placed on the left side and the ARPjvalues are on the right side.
b. Identifying relevant mitigating actions to prevent the risk agents from taking place. One risk agent can be overcome with more than one mitigating action, and one mitigating action can simultaneously reduce more than one risk agent from happening. Mitigating actions are placed on the top most row.
c. Determining the relationships between mitigating actions and every risk agent, Ejk, using a {0, 1, 3, 9} scale. Zero value means that there is no correlation, while 1, 3, and 9 indicate that the correlation between mitigating action (k) and risk agent (j) is low, moderate and high. Ejkcorrelation
is the degree of effectiveness from the mitigating action (k) in reducing the probability of a partic-ular risk agent (j) to occur.
d. Calculating the total effectiveness of every mitigating action with the following formula:
TEk= ∑ (ARPj.Ejk)
e. Scoring the difficulty levels for every mitigating action (Dk), and placing them on the column on the right of the total effectiveness values. Difficulty levels are presented with the Likert scale that show the resource and financial abilities needed to perform the particular mitigating action. f. Calculating the ratio between the total effectiveness
(TEk) and difficulty (Dk) with the following formula: ETDk= TEk/ Dk
g. Ranking the priorities of every mitigating action (Rk) based on the highest ETDK.
RESULT AND DISCUSSION
Farmer Characteristics
Based on the interviews, the ages of red chilli farmers at the location of the study ranged from 18 to 60 years old (yo), with the average of 42.725 years. This range is considered within the limit of productive age. Mubyarto (1989) study showed that productive age ranges from 15–65 yo. Farmers in the productive age range will produce maximal harvests compared to those outside the range, because usually they are more competent to perform the tasks. Farmers' good performance can ensure high productivity because strong physique can influence the skills in red chilli agribusiness on coastal land.
Education level usually influences the way one manages his business. The higher the education one has, the wider his view becomes and the more open he is to advances in technology. The data showed that most farmers (29 farmers, 72.5%) in the group had 9 to 13 years of school. This indicated that these farmers' education level is good. This high level of education was expected to positively influence the farmers' attitude in adopting new innovations in farming practices. They should be able to take in information on red chilli farming on coastal land through radio, television, newspapers, as well as many other sources.
In addition to age and education level, years of farming experience is another important factor in determining the farmer's performance in agribusiness. The data showed that 20 farmers (50%) had more than ten years of farming experience. This amount of experience would help these farmers to manage their business from upstream to downstream, because ...(1)
...(2)
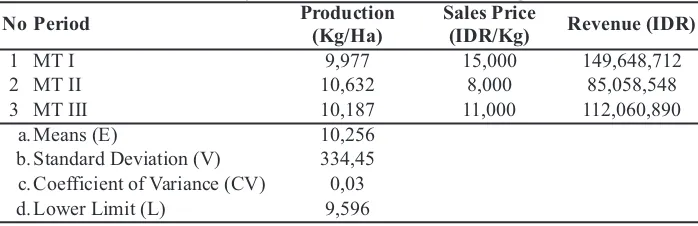
the expected value and two times the standard deviation. The calculated value turned out to be 9,596 Kg/Ha. This value indicates the lower limit for future coastal red chilli productions. Based on the relationship criteria between CV and L, farmers face a risk of production losses if CV > 0.5 and L < 0, but do not if CV < 0.5 and L > 0. The data from the red chilli farmers on the coast showed the latter.
The study results also showed that the gross revenue from coastal red chilli production reached the highest during MT I at IDR 149,648,712/Ha at the sale price of IDR 15,000/Kg. Price was highest during MT I, even though yield was the lowest. The differences in price and production influenced the revenue for the farmers. The higher the price and production, the higher the revenue for these coastal farmers. Based on the macro-economic condition in 2014, especially the last quarter, red chilli prices increased dramatically through out the regions. However, the prices started to go down entering 2015. The high production from MT II was caused by the favorable weather pattern during the growing season. Per account of Sido Dadi's chairman, the low precipitation suppressed the pest populations and ensured a bountiful harvest through out the six month period.
In red chilli agribusiness, the harvest time is called petik (pick). Red chillis grown on coastal land reach harvest time faster, at day 70, than those planted more inland. Red chilli is harvested every five (5) days for up to 25 times. The pick usually starts at two to four kilograms of harvest but keeps increasing until the 12thto 16thtime with yields that
can reach around 100 kg. This time is usually called Panen Raya (the great harvest). Production starts to slow down afterwards but farmers keep picking until it reaches around two kilograms again.
The variety of red chilli, which is widely grown in the area, is called Helix and has the potency to produce 14 tons per hectare. However, the average yield from the coastal land of Banaran Village only reached 10 tons per hectare during MT II. The harvests were even lower for MT I and MT III. This showed that the productivity was not optimal. On average, Table 1.Production Risk Analyses of Coastal Red Chilli Farming
No Period Production
(Kg/Ha)
Sales Price
(IDR/Kg) Revenue (IDR)
1 MT I 9,977 15,000 149,648,712
2 MT II 10,632 8,000 85,058,548
3 MT III 10,187 11,000 112,060,890
a. Means (E) 10,256
b. Standard Deviation (V) 334,45 c. Coefficient of Variance (CV) 0,03 d. Lower Limit (L) 9,596
the knowledge of on-farm as well as off-farm mechanisms is one of the factors that can increase their farming performance. Armed with this knowledge, farmers can also react wisely to any change that happens, whether it causes losses or additional profits. This wisdom can help farmers to decide on the effort to put in the next growing period.
The average size of the farm lands is 0.2135 ha. Farmers with more than 2.5 ha of lands occupied the highest number (12 farmers, 30%). The next significant group managed 0.21 – 0.25 ha, consisting of nine (9) farmers (22.5%). The size differences were the result of the differences in capital, which determined their ability to buy or lease lands on Trisik Beach. Most farmers worked on their own lands, and there were 30 (75%) of them. There were six (15%), who leased, and four (10%), who were sharecroppers.
Production Risk Analyses
Risk analyses are very important for farmers to make decisions before they start farming. The approach for these risk analyses was based on the production and income data provided by coastal red chilli farmers for a certain time interval, three growing periods.
Table 1 contains the information on production, sales price and gross revenue. Production was higher for MT II than those for MT I and MT III. This result was caused by the season. MT I and MT III took place during the rain season when pests, especially fungus, were abundant and rain knocked many flowers off the plants. These phenomena caused the decrease in the harvests.
the sales price of the harvest was the same from all producers because it went through the same channel which was the auction market. This trade took place at the facilities of the farmers group, which also owned a warehouse to store the harvest. These venues had cut down on the roles of middlemen, who often manipulated the prices for their own
profits, and thus given the farmers the power to set their own competitive pricing. The auction market, in short, had increased the farmers' bargaining power.
Identification of Risk Events
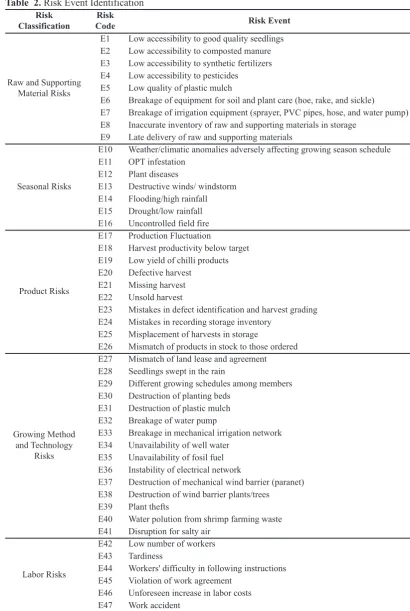
The risk mapping model used in this study was based on the work of Curtis (2008) who classified Table 2. Risk Event Identification
Risk Classification
Risk
Code Risk Event
Raw and Supporting Material Risks
E1 Low accessibility to good quality seedlings E2 Low accessibility to composted manure E3 Low accessibility to synthetic fertilizers E4 Low accessibility to pesticides E5 Low quality of plastic mulch
E6 Breakage of equipment for soil and plant care (hoe, rake, and sickle)
E7 Breakage of irrigation equipment (sprayer, PVC pipes, hose, and water pump) E8 Inaccurate inventory of raw and supporting materials in storage
E9 Late delivery of raw and supporting materials
Seasonal Risks
E10 Weather/climatic anomalies adversely affecting growing season schedule
E11 OPT infestation
E12 Plant diseases
E13 Destructive winds/ windstorm E14 Flooding/high rainfall
E15 Drought/low rainfall
E16 Uncontrolled field fire
Product Risks
E17 Production Fluctuation
E18 Harvest productivity below target E19 Low yield of chilli products
E20 Defective harvest
E21 Missing harvest
E22 Unsold harvest
E23 Mistakes in defect identification and harvest grading E24 Mistakes in recording storage inventory
E25 Misplacement of harvests in storage
E26 Mismatch of products in stock to those ordered
Growing Method and Technology
Risks
E27 Mismatch of land lease and agreement E28 Seedlings swept in the rain
E29 Different growing schedules among members E30 Destruction of planting beds
E31 Destruction of plastic mulch
E32 Breakage of water pump
E33 Breakage in mechanical irrigation network E34 Unavailability of well water
E35 Unavailability of fosil fuel E36 Instability of electrical network
E37 Destruction of mechanical wind barrier (paranet) E38 Destruction of wind barrier plants/trees
E39 Plant thefts
E40 Water polution from shrimp farming waste E41 Disruption for salty air
Labor Risks
E42 Low number of workers
E43 Tardiness
E44 Workers' difficulty in following instructions
E45 Violation of work agreement
E46 Unforeseen increase in labor costs
risks in five aspects, which were risks from raw and supporting materials, seasons, products, growing methods and technologies, and labor.
That model provides the framework to identify risks, the events as well as the agents. Compiled data from the field studies, literature research, and verification process as previously described, were used to identify the production risks that are faced by the members of Sido Dadi farmers' group, which are described in the Table 2.
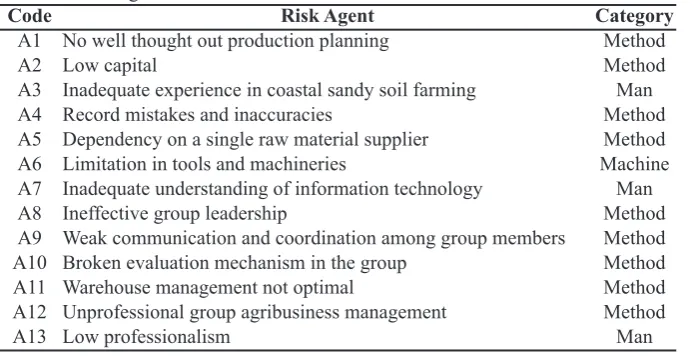
Identification of Risk Agents
The identification of risk agents was performed in a similar process as that of risk events and involved the risk owners. The data were collected from questionaires, in-depth interviews and focus group discussions with the members of Sido Dadi farmers' group to determine the risk agents are shown in Table 3.
Risk Priority Analyses
The risks were identified by mapping the supply chain then assessed with questionairs as well as
in-depth interviews with several members of the farmers' group as representatives for risk owners on coastal red chilli farming. Verification process was done through focus group discussions involving the risk owners when there was a need for scoring that required group verification.
House of Risk1 (Risk Mapping Phase)
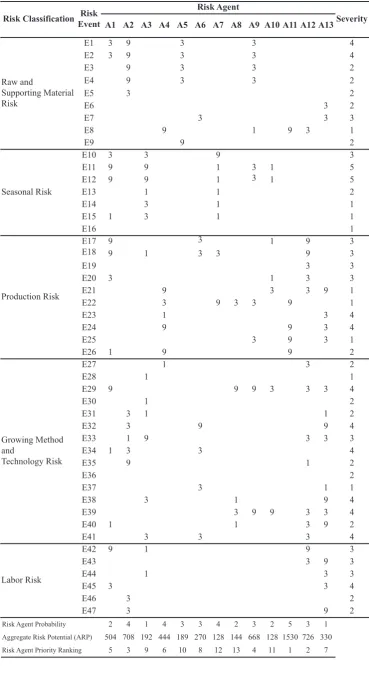
House of Risk 1 is a stage in risk analyses to determine risk priorities from a chosen risk agent. Analyses were conducted by assigning scores on the severity of risk events and probability on the occurence of risk agents, as well as evaluating the risk events and risk agents. The House of Riskmatrix (Table 4) is developed to present the correlation results between risk events and risk agents, in which the data were collected from the questionaires filled out by risk owners.
In Table 4, the calculation process for aggregate risk potentials (ARP) was conducted to obtain the score ranking as the bases to sort out the priority of the chosen risk agents. The highest scoring risk agent
Code Risk Agent Category
A1 No well thought out production planning Method
A2 Low capital Method
A3 Inadequate experience in coastal sandy soil farming Man A4 Record mistakes and inaccuracies Method A5 Dependency on a single raw material supplier Method A6 Limitation in tools and machineries Machine A7 Inadequate understanding of information technology Man
A8 Ineffective group leadership Method
A9 Weak communication and coordination among group members Method A10 Broken evaluation mechanism in the group Method
A11 Warehouse management not optimal Method
A12 Unprofessional group agribusiness management Method
A13 Low professionalism Man
Table 3. Risk Agent Identification
Code Mitigation Strategy
PM1 Improvements on productivity through effective production scheduling PM2 Implementation of integrated warehouse management system
PM3 Improvements on on-farm management through Good Agricultural Practices PM4 Commodity diversification in a professionally managed agribusiness
PM5 Improvements on supply procedure and process for raw and supporting materials PM6 Innovations on mechanical irrigation system by installing pipes and drip lines PM7 Improvement on quality and capacity of machineries
PM8 Agreement on periodic performance evaluations
PM9 Improvement on discipline, behavior, knowledge, and skills on coastal sandy soil farming PM10 Implementation of “SMS Call” with distributors for harvest sales at the auction market PM11 Innovation on contract-marketing with red-chilli processing industry
PM12 Tree planting to create a coastal green-belt for wind-barrier PM13 Formation of an independent unit to create a bankable agribusiness PM14 Youth education activity through on-farm practices
Risk Classification Risk Event
Risk Agent
Severity A1 A2 A3 A4 A5 A6 A7 A8 A9 A10 A11 A12 A13
Raw and
Supporting Material Risk
E1 3 9 3 3 4
E2 3 9 3 3 4
E3 9 3 3 2
E4 9 3 3 2
E5 3 2
E6 3 2
E7 3 3 3
E8 9 1 9 3 1
E9 9 2
Seasonal Risk
E10 3 3 9 3
E11 9 9 1 3 1 5
E12 9 9 1 3 1 5
E13 1 1 2
E14 3 1 1
E15 1 3 1 1
E16 1
Production Risk
E17 9 3 1 9 3
E18 9 1 3 3 9 3
E19 3 3
E20 3 1 3 3
E21 9 3 3 9 1
E22 3 9 3 3 9 1
E23 1 3 4
E24 9 9 3 4
E25 3 9 3 1
E26 1 9 9 2
Growing Method and
Technology Risk
E27 1 3 2
E28 1 1
E29 9 9 9 3 3 3 4
E30 1 2
E31 3 1 1 2
E32 3 9 9 4
E33 1 9 3 3 3
E34 1 3 3 4
E35 9 1 2
E36 2
E37 3 1 1
E38 3 1 9 4
E39 3 9 9 3 3 4
E40 1 1 3 9 2
E41 3 3 3 4
Labor Risk
E42 9 1 9 3
E43 3 9 3
E44 1 3 3
E45 3 3 4
E46 3 2
E47 3 9 2
Risk Agent Probability 2 4 1 4 3 3 4 2 3 2 5 3 1
Aggregate Risk Potential (ARP) 504 708 192 444 189 270 128 144 668 128 1530 726 330
Risk Agent Priority Ranking 5 3 9 6 10 8 12 13 4 11 1 2 7
is placed at the top followed by the lower scoring risk agents. ARP values were obtained to rank the priority of the risk agents. Using 80/20 Pareto principle, we determined 20% of the risk agents that contributed to 80% of the risk events, which are listed in Figure 1.
Risk Management Strategies
After determining six risk agents designated in Class A (the cumulative percentage under 80%) in Figure 1, the next step was to identify the risk mitigation strategies. This process was carried out by having in-depth
interviews. These activities were further verified in focus group discussions with the risk owners. Questionaires were given to the risk owners to grade the difficulty scores for the implementation of the mitigating actions. The above processes resulted in the mitigating actions to handle the risk agents, as explained in Table 5.
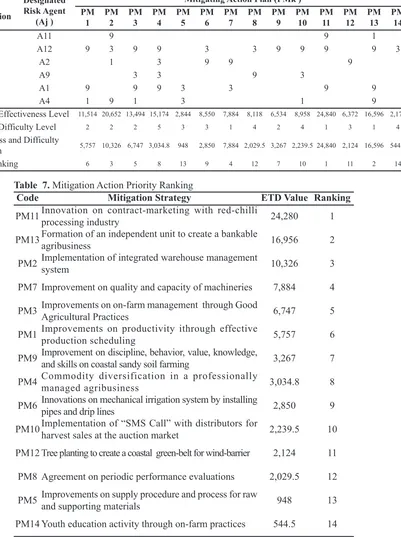
House of Risk2 (Risk Mitigation Phase)
House of Risk 2 is the stage to determine the priorities of the effectiveness of mitigating actions based on the availability of resource capabilities and
ABC Classification
Designated Risk Agent
(Aj )
Mitigating Action Plan (PMk ) PM
Mitigation Effectiveness Level 11,514 20,652 13,494 15,174 2,844 8,550 7,884 8,118 6,534 8,958 24,840 6,372 16,596 2,178
Mitigation Difficulty Level 2 2 2 5 3 3 1 4 2 4 1 3 1 4
Effectiveness and Difficulty
Comparison 5,757 10,326 6,747 3,034.8 948 2,850 7,884 2,029.5 3,267 2,239.5 24,840 2,124 16,596 544.5
Priority Ranking 6 3 5 8 13 9 4 12 7 10 1 11 2 14
Table 6. House of Risk 2 Matrix of Mitigation Strategy Effectiveness
Code Mitigation Strategy ETD Value Ranking
PM11Innovation on contract-marketing with red-chilli
processing industry 24,280 1
PM13Formation of an independent unit to create a bankable
agribusiness 16,956 2
PM2 Implementation of integrated warehouse management
system 10,326 3
PM7 Improvement on quality and capacity of machineries 7,884 4
PM3 Improvements on on-farm management through Good
Agricultural Practices 6,747 5
PM1 Improvements on productivity ithrough effective
production scheduling 5,757 6
PM9 Improvement on discipline, behavior, value, knowledge,
and skills on coastal sandy soil farming 3,267 7
PM4 Commodity diversification in a professionally
managed agribusiness 3,034.8 8
PM6 Innovations on mechanical irrigation system by installing
pipes and drip lines 2,850 9
PM10Implementation of “SMS Call” with distributors for
harvest sales at the auction market 2,239.5 10
PM12 Tree planting to create a coastal green-belt for wind-barrier 2,124 11
PM8 Agreement on periodic performance evaluations 2,029.5 12
PM5 Improvements on supply procedure and process for raw
and supporting materials 948 13
PM14 Youth education activity through on-farm practices 544.5 14
difficulty in the implementations. The data analyses resulted in the comparisons between the mitigating actions and risk agents, effectiveness of mitigating actions and difficulty level of the mitigating action implementations as represented in Table 6.
Based the comparisons between effectiveness and difficulty level of mitigating actions, the priorities are ranked as shown in Table 7.
CONCLUSION
Based on the calculations of variance coefficient, the production risks level was at 0.03 with the production lower limit of 9,596 Kg/Ha, which showed a low level of production risk. It can be concluded that coastal red chilli farming in Kulon Progo Regency is a viable venture to be sustainably practiced. Risk management analyses showed all the production risks related to coastal red chilli farming for the members of Sido Dadi farmers' group. There are 13 identifiable risk agents and also 47 identifiable risk events consisted of nine risks in raw and supporting materials, seven in season, ten in products, 15 in growing methods and technologies, and six in labor. We found 14 mitigating actions are interconnected and will not only solve the risk agents in Class A, but also the risk agents of the rest. Those various risk mitigation strategies can be performed by the farmers to lessen the risks that can causes losses in the process of red chilli productions.
REFERENCES
Anderson, J.R., J.L. Dillon and J.B. Hardaker. 1977. Agricultural Decision Analysis. The Iowa State University Press.
Anonym. 2004. Pengembangan Tanaman Sayuran Lahan Pasir Pantai Model Bimbingan dan In-tensisfikasi Massa Terpadu. Dirjen Bina
Pro-duksi Hortikultura. Fakultas Pertanian UGM. Yogyakarta.
Arifin. 2013. Risiko Produksi dan Pendapatan Kepemilikan Lahan Daerah Sentra Produksi Padi di Kabupaten Pinrang. Jurnal Vegeta 7 (1) : 1-14.
Curtis, Kynda. 2008. Agribusiness Risk and Risk Management Strategies. University of Ne-vada, Reno. Virginia.
Elton E.J., M. J. Gruber. 1995. Risk Reduction and Portfolio Size: An Analytical Solution. Jour-nal of Business 50 : 415-37.
Fariyanti, A. 2008. Perilaku Ekonomi Rumah Tangga Petani Sayuran dalam Menghadapi Risiko Produksi dan Harga Produk di Keca-matan Pangalengan Kabupaten Bandung. Dis-ertasi Program Doktor. Sekolah Pascasarjana, Institut Pertanian Bogor.
Heriani, dkk. 2013. Analisis Keuntungan dan Risiko Usahatani Tomat di Kecamatan Sumberejo Kabupaten Tanggamus. Jurnal IIA. 1 (2) : 169-173.
Ihsanudin. 2010. Risiko Usahatani Tembakau di Kabupaten Magelang. Jurnal Embrio. 7 (1) : 21-28.
Imelda. 2012. Analisis Risiko Pada Usaha Penangkapan Kepiting Bakau Di Kecamatan Sungai Kunyit Kabupaten Pontianak. Jurnal Sosial Ekonomi Pertanian. 1 (1) : 75-95. Kadarsan, H.W. 1995. Keuangan Pertanian dan
Pem-biayaan Perusahaan Agribisnis. Cetakan Kedua. PT. Gramedia Pustaka Utama. Jakarta. Kusumaningrum, Juliman Foor Z, dan Dalvi Mustafa. 2015. Social Quality Masyarakat Lahan Pasir pada Aspek Social Empowerment di Kecamatan Panjatan Kabupaten Kulon Progo. Jurnal Agriekonomika, 4 (1) : 1-9. Mubyarto. 1989. Pengantar Ekonomi Pertanian.
National Statistics Agency. 2015. Data Produksi Cabai Besar, Cabai Rawit, Dan Bawang Merah Tahun 2014. BPS DIY.
Lamusa A. 2010. Risiko Usahatani Padi Sawah Rumah Tangga Di Daerah Impenso Provinsi Sulawesi Tengah. Jurnal Agroland. 17(3):226-232.
Scheaffer, L. Richard, William Mendenhall, Lyman Ott. 1990. Elementary Survey Sampling. PWS – Kent Publishing Company.
Massachu-setts. Boston.
SCRLC. 2011. Supply Chain Risk Management: A Compilation of Best Practices. Supply Chain Leadership Council.