REFORMING POLICIES FOR
SMALL AND MEDIUM-SIZED
ENTERPRISES IN INDONESIA
his work is a product of the staf of the RAND Corporation. he indings, interpretations, and conclusions herein are those of the authors and do not necessarily relect the views of the Tim Nasional Percepatan Penanggulangan Kemiskinan (TNP2K), the Government of Indonesia or the Government of Australia.
Attribution:
Burger, N., C. Chazali, A. Gaduh, A.D. Rothenberg, I. Tjandraningsih and S. Weilant. 2015. Reforming Policies for Small and Medium Enterprises in Indonesia, Jakarta, Indonesia, RAND Corporation in collaboration with Tim Nasional Percepatan Penanggulangan Kemiskinan (TNP2K), Jakarta, Indonesia.
Support for this publication was provided by the Australian Government through the Poverty Reduction Support Facility (PRSF).
You are free to copy, distribute and transmit this work for non-commercial purposes.
To request copies of the report or for more information on the report, please contact the TNP2K - Knowledge Management Unit ([email protected]). he reports are also available at the TNP2K website.
TNP2K
Grand Kebon Sirih Lt.4, Jl.Kebon Sirih Raya No.35, Jakarta Pusat, 10110
Tel: +62 (0) 21 3912812 Fax: +62 (0) 21 3912513 www.tnp2k.go.id
Cover Image: RAND Corporation
Nicholas Burger, Charina Chazali, Arya Gaduh, Alexander D. Rothenberg,
Indrasari Tjandraningsih and Sarah Weilant
iii
Preface
Preface
Abstract
v
Contents
Contents
List of Figures ... x
List of Tables ... xi
List of Boxes ... xii
Acknowledgements ... xiii
Acronyms and Abbreviations ... xiv
Summary ... xv
Introduction ...1
Brief summary of the literature on policies to promote SMEs ...3
Deinition: What is an SME? ...5
Organisation of the report ...6
Micro, Small and Medium-sized Enterprises in Indonesia ...7
Most irms in Indonesia are small ...8
Many SMEs pay low wages ...10
SMEs have relatively low labour productivity ...12
Managers of SMEs have limited formal education ...13
Many SMEs serve local markets and do not expand their businesses...17
Implications for our research ...18
Qualitative Interviews with Small and Medium-sized Firms ...19
Analytical framework ...20
Research focus: larger, growth-oriented SMEs ...22
Survey questionnaire development ...22
Industry selection ...23
Geographic selection ...25
Description of ieldwork and selection of irms...26
Sample characteristics ...27
Food processing ...27
Garments ...32
Furniture ...35
Services (restaurants and motor repair shops) ...37
High-value-added ICT ...38
Major Constraints Faced by Micro, Small and Medium-sized Enterprises ...41
Self-reported constraints faced by MSMEs ...42
Access to inance and credit constraints ...45
Access to markets and demand ...50
Other important constraints ...53
Growth orientation of irms ...55
Policies to Reduce Informality in Indonesia ...57
heories of the informal sector ...58
Business licensing as a constraint ...59
Need for transparent information ...61
Evidence on policies to promote registration ...62
Recommended policy actions ...63
Recommendations for Improving Policies to Support Small and Medium-sized Enterprises ...65
How policymakers design and implement SME support programmes ...66
Improving access to information about SME support programmes ...68
Improving the quality of SME support programmes ...69
Credit programmes and access to inance ...70
Market access ...73
Uncertain costs of complying with regulations ...74
Raw materials, labour and human capital ...75
Conclusion ...77
Appendix A: Interview questionnaire ...82
Appendix B: Interview debrieing form ...103
Appendix C: Interview ieldwork logistics ...104
Appendix D: Literature review: laws, policies and deinitions ...111
vii
Contents
List of Figures
Figure 1 Firm size distribution, measured by number of workers ...9
Figure 2 Number of workers, micro and small irms ...10
Figure 3 Monthly wages per worker, micro and small irms ...11
Figure 4 Value added, micro and small irms ...12
Figure 5 Gender of micro, small and medium-sized irm managers and operators ...14
Figure 6 Educational attainment of micro, small and medium-sized irm managers and operators ...15
Figure 7 Educational attainment of micro and small irm managers and operators, by age group ...15
Figure 8 Educational attainment of small and medium-sized irm managers and operators, by registration status ...16
Figure 9 A simple model of SME production and growth ...21
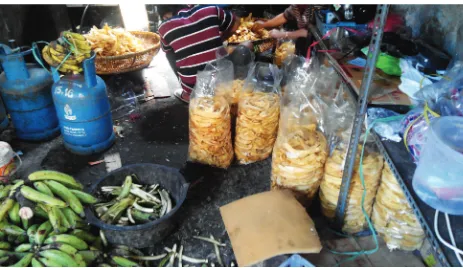
Figure 10 Banana chips (kripik pisang) SME, Bandung, West Java ...28
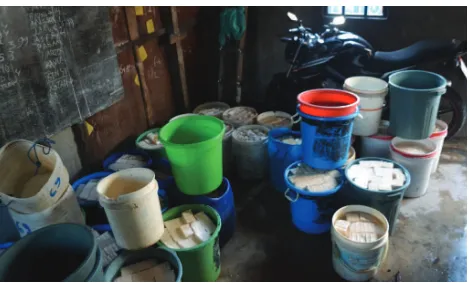
Figure 11 Tofu processing SME, Makassar, South Sulawesi ...29
Figure 12 Unroasted beans from a cofee-producing SME, South Sulawesi ...30
Figure 13 Batik shop, Pekalongan, Central Java ...33
Figure 14 Muslim fashion design SME, Bogor, West Java ...34
Figure 15 Teak furniture from a SME showroom in Central Java...36
Figure 16 Knowledge economy index, Asia ...39
Figure 17 Diferences in constraints by industry, micro and small irms ...44
Figure 18 Diferences in constraints by province, micro and small irms ...45
Figure 19 Firm experience selling products electronically ...51
Figure 20 Percentage of irms that maintain inancial records ...53
List of Tables
Table 1 Deinitions of irm sizes used in this report ...5
Table 2 Distribution of monthly wages per worker, micro, small and medium-sized irms ...11
Table 3 Relative labour productivity of micro, small and medium-sized irms compared with large irms (percentage) ...13
Table 4 Distribution of year started for micro, small and medium-sized irms ...17
Table 5 SMEs taking steps to expand (percentage) ...18
Table 6 Questionnaire sections ...23
Table 7 Primary industries for qualitative interviews ...23
Table 8 Micro and small enterprises, by industry ...24
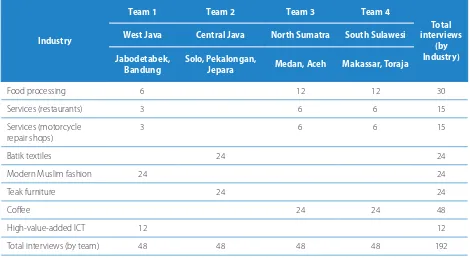
Table 9: Field research teams, industries and sample sizes ...25
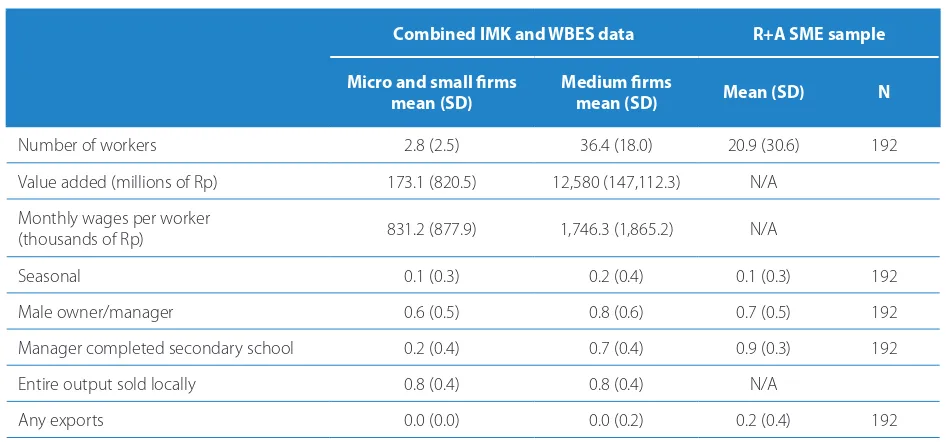
Table 10 Summary statistics: RAND and AKATIGA Survey sample vs nationally-representative data ...27
Table 11 Summary statistics for food-processing micro, small and medium-sized irms ...31
Table 12 Summary statistics for garment-producing micro, small and medium-sized irms ...35
Table 13 Summary statistics for furniture micro small, and medium-sized irms...37
Table 14 Summary statistics for services irms ...38
Table 15 Summary statistics for high-value-added ICT irms ...39
Table 16 Most important constraint to doing business, universe of irms (by percentage) ...42
Table 17 Most important constraint to doing business, R+A SME survey ...43
Table 18 Summary of procedures for starting a business, Jakarta ...60
Table C.1 Field research teams, industries and Intended sample sizes ...104
Table C.2 West Java data collection timeline ...105
ix
List of Tables
Table C.4 North Sumatra data collection timeline ...107
Table C.5 South Sulawesi data collection timeline...108
Table C.6 Overall ieldwork timeline ...109
Table C.7 SME data collection wrap-up workshop attendees ...110
Table C.8 SME data collection wrap-up workshop agenda ...110
Table D.1 General SME policies in Indonesia ...111
List of Boxes
Box 1. Stories of batik-producing irms with credit constraints ...47
Box 2. Stories of irms with raw material constraints ...49
Box 3 Stories of irms with market access constraints ...52
Box 4 Stories of irms overcoming growth constraints ...56
Box 5 Story of an SME with the one-stop shop programme ...62
Box 6 Stories of policymakers’ experiences with SME support programmes ...67
Box 7 Stories of irms and their access to SME support programmes...68
Box 8 Recounts one irm’s interactions with industry associations in trying to meet its capital needs. ...71
Box 9 Presents a case study of an SME participating in a privately and publicly run trade fair. ...73
xi
Acknowledgements
Acknowledgements
Connor Spreng, Kaitlin Shilling, Peter van Diermen and Nurul Widyaningrum provided invaluable advice and guidance throughout the project. he authors also thank the research and administrative staf of the social analysis irm AKATIGA for their invaluable contributions to the study design, data collection, implementation and data analysis. We also thank Rini P. Radikun and Latif Adam of TNP2K who provided comprehensive direction and actively participated in the research and management activities involved in this study.
We thank Robert Stewart and Cole Sutera for their vital support and research assistance, and we want to acknowledge support from the World Bank and TNP2K throughout the data collection process. Staf at both organisations were instrumental in shaping and carrying out the data collection for this study.
Acronyms and Abbreviations
BPS Statistics Indonesia (Badan Pusat Statistik)
DEPKOP Ministry of SMEs and Cooperatives, Indonesia (Kementerian Koperasi dan Usaha Kecil dan Menengah)
ICT information and communication technologies
IMK Statistics Indonesia survey of micro and small enterprises (Survei Industri Mikro Dan Kecil)
KEI knowledge economy index
KUK Small Enterprise Credit programme (Kredit Usaha Kecil)
KUR People’s Business Credit programme (Kredit Usaha Rakyat)
MSME micro, small and medium-sized enterprise
OSS one-stop shop (programme to simplify irm registration)
PPP purchasing power parity
R+A RAND Corporation and AKATIGA research institute
Rp Indonesian rupiah
SME small and medium-sized enterprise
SVLK Timber legality veriication system (Sistem Veriikasi Legalitas Kayu)
TNP2K National Team for the Acceleration of Poverty Reduction (Tim Nasional Percepatan Penanggulangan Kemiskinan)
UMKM micro, small and medium-sized enterprises (usaha menengah kecil mikro)
USD United States dollars
xiii
Summary
Summary
Small and medium-sized enterprises (SMEs) are critical for emerging economies like Indonesia but simultaneously challenging for policymakers looking to support their growth. Including micro irms (companies with fewer than ive employees), SMEs are responsible for more than 97 percent of total employment in Indonesia and represent 99 percent of all irms (Mourougane 2012). Small irms tend to be labour intensive and relatively unproductive, typically using outdated or less sophisticated technologies to produce goods. As a consequence, SMEs produce only 57 percent of Indonesia’s total value-added output (Mourougane 2012). A central challenge for the Indonesian government is how to encourage SMEs to grow so that they and the industries they operate in can beneit from the dynamics of economies of scale, contribute to national economic growth and provide more employment opportunities for Indonesians. his report addresses the basic but diicult question of what limits growth for Indonesian SMEs and what role the government should play in fostering their growth. Using nationally-representative surveys collected by the Government of Indonesia and the World Bank, we conirm ive key points about Indonesia’s micro irms and SMEs:
1. Most irms in Indonesia are micro irms and SMEs represent a considerable portion of Indonesia’s economy and employment.
2. SMEs in Indonesia tend to pay low wages. 3. SMEs tend to be less productive than large irms.
4. he owners and operators of SMEs tend to lack formal education and those owners with higher education levels are more likely to operate larger SMEs and to formally register their irms.
5. Many SMEs serve local markets and have not taken steps to expand their businesses.
To guide our data collection and subsequent analysis, we developed a basic analytical framework for understanding the various decisions that SMEs make. his framework borrows from the economic theory of the irm and involves a precise formulation of the objectives that SMEs are trying to achieve and the constraints they face when making decisions that afect their business operations.1 he framework is built around owners of
a small irm who are trying to operate the business, maximise proits and determine how to expand. he owners combine basic inputs to production – labour, production technologies and physical capital – with their inancial capacity and management ability to produce output. To be successful, they must identify intermediate or inal consumers who demand their products and conduct their production and sales activities within the broader business environment, driven by rules, regulations, and institutional norms determined by the Indonesian government and the market environment.
Despite the variety of constraints that irms could face in doing business, two problems emerged as most important: (1) credit constraints and (2) access to information. Credit constraints were the most frequently cited challenge for doing business, preventing irms from expanding and investing in new technologies that would lead to growth. Many of the irms we interviewed felt that the terms of credit ofered to them by banks were too expensive, with exorbitant interest rates and diicult collateral requirements, and this was why they decided not to pursue formal sources of inancial capital.
Inadequate access to various forms of information was also a pervasive problem for SMEs. his prevented them from learning about programmes sponsored by government or non-governmental organisations, including trade fairs that could help them access markets and worker-training programmes that could improve their productivity. We found that the government also lacks information and an accurate national registry of SMEs would enable policymakers to improve the design of SME support programmes and target these programmes more efectively. Moreover, while it may not be feasible to eliminate the overlap between government oices responsible for supporting SMEs, policies could be introduced to encourage communication and coordination across oices at both local and national levels and reduce the barriers for irms trying to navigate government policies and programmes.
Access to information also afected the issue of formality. While concerns about the informal sector are common in many developing countries, we know less about why irms remain informal. To explore the informal sector in Indonesia, we reviewed economic theories of why informal irms exist and compared those theories with what we learnt from our analysis of quantitative and qualitative data on Indonesian SMEs. Some results were surprising. Firms lamented the high cost of registration although some licensing procedures are free in Indonesia and many irms said that they remained informal because they found the process too complicated or because the costs of complying with formal business regulations would be prohibitive. In view of this, we recommend that the government focuses on promoting the beneits of registration, rather than just trying to reduce the costs. his may require better access to information through mechanisms that explain the beneits of registration and how to navigate the process. he literature on formality suggests that making the beneits clearer, along with increasing enforcement, may lead to higher rates of formality, which is consistent with stronger growth and greater productivity for irms. General strategies to encourage poverty reduction and economic growth may lead to irms exiting the informal sector, entering the formal sector and reallocating workers to the formal sector.
xv
Summary
Small and medium-sized enterprises (SMEs) are critical for emerging economies like Indonesia but simultaneously challenging for policymakers looking to support their growth. Including micro irms (companies with fewer than ive employees), SMEs are responsible for more than 97 percent of total employment in Indonesia and represent 99 percent of all irms (Mourougane 2012). Small irms also tend to be labour intensive and relatively unproductive, typically using outdated or less advanced technologies to produce goods. Indonesia’s SMEs produce only 57 percent of total value-added output (Mourougane 2012). A central challenge for the Indonesian government is how to encourage SMEs to grow so that they and the industries they operate in can beneit from the dynamics of economies of scale, contribute to Indonesian economic growth and provide more employment opportunities for Indonesians. his report addresses the basic but diicult question of what limits growth for Indonesian SMEs and what the role of government should be in fostering their growth.
SMEs face many challenges to growth. Small irms may have diiculty accessing sources of credit or, if they have access, they may not have the collateral required to borrow or may be charged prohibitively high interest rates. hese irms must confront a range of labour-market challenges, including inding skilled workers, complying with minimum wage laws and avoiding employee turnover. Access to steady sources of raw materials can be problematic, particularly for certain industries. For example, there may be supply bottlenecks, some internationally-produced raw materials may luctuate in price and SMEs can face unfavourable competition for raw materials with large irms. In addition, small irms struggle to market their products and compete with larger irms on quality and price. hey also have problems obtaining licences to formally operate and many who should formalise their business and can aford to pay taxes, still do not do so.
Recognising the importance of encouraging SMEs to grow and expand, the Indonesian government has allocated considerable resources to addressing the challenges that these enterprises face. Major national SME support programmes include one-stop shops for business licences, which reduce the red tape involved in obtaining licences, and People’s Business Credit (KUR), a scheme to subsidise lending to smaller irms. hese programmes and others attempt to alleviate the constraints that SMEs face as they struggle to grow. However, there is a sense that existing SME support programmes do not reach potential recipients and, even when they do, they may not be efective in changing outcomes. his could be because the programmes are not well designed or properly implemented, or it could be because government programmes are targeting constraints best solved by other actors.
In 2014, the RAND Corporation, in collaboration with AKATIGA Pusat Analisis Sosial, a social policy research institution in Bandung, Indonesia, conducted research to assess the constraints facing Indonesian SMEs as well as the current support policies, and make recommendations to the government and other stakeholders about reforms. RAND and AKATIGA carried out the analytical part of this study which included analysing existing, nationally-representative survey data on SMEs and collecting primary data from almost 200 Indonesian irms across a number of provinces and industries. We aimed to answer the following research and policy questions:
• What SME support policies seem to be working? What policies do not? • What do SMEs need from government and what are they actually getting? • What can we learn about SMEs from the diversity of their experiences?
• How do the incentives and constraints faced by policymakers afect the delivery of SME policies? • What are the appropriate roles for local and national governments in supporting SMEs, and how
3
Introduction
his report summarises the RAND team’s research approach, data collection, results and recommendations to the government of Indonesia on its policies geared toward SMEs. We describe the results of a new mixed-methods data collection survey conducted to help identify and describe the constraints that Indonesian SMEs face and provide insights into the efectiveness of existing policy measures used to alleviate those constraints. In the remainder of this chapter, we briely review the existing literature on constraints to SME growth and provide the deinition of a small irm that we will use throughout the report.
Brief summary of the literature on policies to promote SMEs
he literature on constraints to growth for SMEs and on policy and programme solutions is vast so we do not attempt to summarise that literature in its entirety here. However, to develop the methodology and analytical framework to guide this research study, we drew on the wealth of studies that have been done on SMEs in Indonesia and other regions. We assessed what the government of Indonesia, other researchers, organisations and the media have said or written in recent decades about the composition of SMEs in the country and the challenges they face. We also reviewed the laws and policies designed to support SMEs in Indonesia, taking care to understand the historical context in which those policies were established. We reviewed experiences and lessons learnt from eforts to support SME growth in other countries. Evidence from recent policy evaluations that used randomised experiments on irms in developing countries inluenced and shaped our understanding of which policies are likely to succeed and which are not (Dulo, Glennerster and Kremer 2007).
We also sought to summarise the Indonesian laws, policies and programmes that are designed to promote SMEs. hese strategies are varied and diicult to track due to a lack of easily accessible information but we have included a detailed list in appendix D.
Evidence of constraints
here is well-documented evidence that irms in developing countries are often credit-constrained (Tambunan 2009; Banerjee and Dulo 2004) and that the average returns to capital for small irms in credit-constrained environments tend to be high (de Mel, McKenzie and Woodruf 2008; Anagol and Udry 2006; Kremer et al. 2013). Nevertheless, the question of the signiicance of credit constraints is not completely settled. For instance, Hsieh and Olken (2014) argue that larger irms tend to have higher returns to capital than smaller irms in developing countries, suggesting that greater lending to small irms would not enhance growth as much as greater lending to large irms. Administering high-quality credit programmes is diicult and their levels of success are mixed. his is true in Indonesia where McPherson and Rous (2010) found that irms in East Java were not responsive to programmes designed to increase access to credit. Overall, although credit constraints are thought to be a major impediment to growth, it is not easy to develop and administer efective policies to address these constraints.
Small irms often rely on outdated or ineicient technologies and production processes. Directly promoting technology is diicult and evidence from the literature suggests that even well-targeted policies can be surprisingly inefective. Atkin et al. (2014) provided better technology for football manufacturers in Pakistan but found low rates of technology adoption. his was at least partly due to the wage structure of irms participating in the experiment because many irms used incentive systems that led to reductions in average wages under the new technology (therefore workers did not adopt the technology). Berry, Rodriguez and Sandee (2001) found that subcontracting can be an efective mechanism to support technology adoption but work by Tambunan (2006, 2007) in Indonesia found that the “foster parent” programme, which actively created links between large and small irms, had limited efectiveness due to its heavy-handed implementation.
he evidence on the efects of managerial training is mixed (McKenzie and Woodruf 2014). For example, personalised management consulting may be efective but it is also expensive. Bloom et al. (2013) conducted an experiment where they provided individualised, high-quality consulting services to large textile irms in India. Although this training resulted in large improvements in productivity, it was expensive and was unlikely to be a cost-efective solution for better management in SMEs. Business training courses appear to be more efective for new businesses. For example, de Mel, McKenzie and Woodruf (2013) found that training increased rates of entry for new irms but for established irms, training had no resulting efect on desirable outcomes, such as productivity. Research on the Indonesian context found that government-sponsored technical assistance programmes often result in a pattern of one-shot services with little follow-up or long-term beneits (Berry, Rodriguez and Sandee 2001).
here is abundant evidence that access to markets is important for irm growth. Regarding infrastructure, a long-standing body of work documents the beneits of road and transport networks (Jacoby 2000; Casaburi, Glennerster and Suri 2012; Faber 2013; Rothenberg 2013). One challenge is that this literature is not speciic to SMEs and there is less evidence about speciic market access programmes, such as trade fairs or night markets, that are not standard government service provision programmes (such as roads).
he literature on SME programmes
Evidence on speciic programmes and policies designed to improve the general business environment in Indonesia is limited. he United Nations produced a guidebook for SMEs in Asia and the Paciic (Abe et al. 2012) but it applies blanket recommendations to several countries, despite each country’s unique circumstances. Firm registration and formality has received signiicant attention in the literature but SME formality is typically characterised by a binary approach of formal versus informal, with little middle ground (for example, see Arnold 2012). High registration costs are often thought to drive irms to remain informal but reducing the costs of registration may not be enough to encourage them to formalise. Arnold (2012) reviews policy recommendations for broad tax reforms and recommends reforming policies and their administration. For example, he argues that the government should “allocate more tax audits on the basis of risk assessments and eliminate automatic audit requirements.”
5
Introduction
Deinition: What is an SME?
We deine an SME as any organised production unit that specialises in producing something or providing a service and adds value.2 Production involves transforming basic goods or raw materials into semi-inished or
inished products and, in the process, adding value for consumers. Information is one possible raw material which is why businesses in the service sector are also considered to be irms. Moreover, middlemen who collect products from one location and sell it to another are also adding value which is why they are considered irms as well. Firms are often but not always located in a single building or production facility and one or more individuals are responsible for managing the business. Firms are established, according to Coase (1937) and Williamson (1979, 1985), in order to reduce transaction costs which can arise from the time and efort required to search for raw materials, acquire capital, use production technologies and ind trading partners who serve as markets for their products.
When considering small irms, the many diferent ways of deining what it means to be an SME are a source of confusion and policymakers and researchers have not reached consensus on the most appropriate deinition. For example, Indonesia’s Ministry of SMEs and Cooperatives (DEPKOP) and Bank Indonesia use net asset or total sales thresholds to determine whether a irm is an SME.3 his deinition is useful for the purposes of corporate
taxation but it is diicult to obtain accurate measures of these statistics for many small irms because many do not keep detailed business records. It is far easier to observe employment sizes. Indonesia’s statistical agency, Statistics Indonesia (BPS) and the World Bank Enterprise Survey (WBES 2009) deine SMEs based on the total number of employees: small irms have 5–19 employees, while medium-sized irms have 20–99 employees. Micro irms have 1–4 employees.
For this report, we deine SMEs based on employment size, primarily because this is easier to measure. Our deinitions for diferent sizes of irms, which conform to the deinitions used by Statistics Indonesia, are shown in table 1. In doing ield research, we found it diicult to access igures for sales or net assets and many irms did not know or refused to answer questions about their total sales or proitability. Nevertheless, we recognise that this deinition has its limitations, for example, a large manufacturing plant may employ only ten people or a small information technology company may have only 20 employees, even when both are large in terms of proits. here are also many SMEs that employ seasonal labour and, even though an SME is run by a core set of employees, its employment size could luctuate substantially, which could inluence annual outputs and revenue.
Table 1 Deinitions of irm sizes used in this report
Type of irm Number of employees
Micro 1–4
Small 5–19
Medium 20–99
Large 100+
2 Note that this broad deinition is used by Statistics Indonesia (BPS) to determine whether an organisation qualiies as a irm and to design its surveys. We adopt this consistent deinition here.
Organisation of the report
he rest of this report is organised as follows.
Chapter 2 gives a concise background to SMEs in Indonesia to set the context for our work, reviewing evidence from nationally-representative survey data.
Chapter 3 presents an analytical framework for understanding how SMEs operate and make decisions. In addition, we describe the data collection process for our qualitative interviews with irms, conducted to gain a better understanding of the constraints that SMEs face. We designed a mixed-methods survey and administered it to 192 irms in 21 districts in Indonesia in August 2014. We describe the design of the survey, sample selection, organisation of data collection and other implementation details in this chapter.
Chapter 4 analyses the main constraints and reviews a concise list of the most important challenges facing small irms in Indonesia. We summarise irms’ experiences using quantitative and qualitative analyses, supported by detailed accounts from a selection of irms.
In Chapter 5, we discuss issues surrounding formalising the informal sector in Indonesia, and make policy recommendations to encourage greater formality.
2
Micro, Small and
Medium-sized
In this chapter, we describe the characteristics of micro, small and medium-sized enterprises (MSMEs) in Indonesia. his preliminary analysis uses representative samples to help provide the context for our subsequent targeted data collection and analysis. We used two data sources: the Statistics Indonesia 2013 survey of micro and small enterprises (Survei Industri Mikro Dan Kecil – IMK 2013) and the World Bank 2009 Indonesia Enterprise Survey (WBES 2009). he IMK 2013 survey was a 1 percent sample survey of micro and small irms, representative at the province level. he survey asked more than 40,000 irms about their production, output, value-added, capital, labour and production technologies, among other topics.
Although the IMK 2013 survey contained rich quantitative information about micro and small irms and their factors of production, it did not collect data on medium-sized irms or ask many detailed questions about the business environment or challenges to doing business. It also did not include good measures of informality and business registration. For these reasons, we supplement data from the IMK 2013 survey with data from the WBES 2009.
he WBES 2009 was a random sample of small, medium and large irms in Indonesia, stratiied by industry, size and region. In addition to questions about employment, output, total sales and compensation, the survey asked irms about the challenges they faced associated with the business environment, registration, taxes, informal payments and access to inance. Although it was more detailed than the IMK 2013 survey, less than 1,000 irms were interviewed, resulting in a much smaller sample from which to draw inferences.4 In the absence
of a comprehensive survey of SMEs in Indonesia, we combined these two data sources to provide a more comprehensive description of the SME environment. Although our study focused on small and medium-sized irms and not on microenterprises, most irms in Indonesia are micro irms, so they are important to discuss. Our description of SMEs is organised around ive key stylised points:
1. Most irms in Indonesia are micro irms and SMEs represent a considerable portion of Indonesia’s economy and employment.
2. SMEs in Indonesia tend to pay low wages. 3. SMEs tend to be less productive than large irms.
4. he owners and operators of SMEs tend to lack formal education, and those owners with higher education levels are more likely to operate larger SMEs and to formally register their irms.
5. Many SMEs serve local markets and have not taken steps to expand their businesses.
Most irms in Indonesia are small
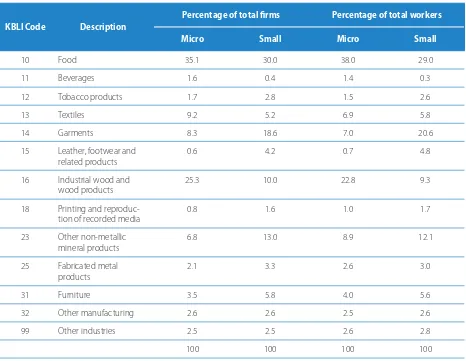
SMEs account for a signiicant portion of Indonesia’s economic activity. Including micro irms, SMEs represent more than 99 percent of total irms in Indonesia and are responsible for approximately 97 percent of total national employment (Mourougane 2012). In igure 1, we report the distribution of irm sizes in Indonesia in 2006, where the size of a irm is measured by the total number of workers it employs. he left panel in igure 1 features a histogram showing the percentage of total irms that employ diferent numbers of workers. Although separate bars are drawn at ten-worker intervals, only the irst two bars are distinguishable. his histogram depicts a highly skewed distribution and the percentage of irms with fewer than ten workers is diicult to distinguish visually from 100 percent.
9
Micro, Small and Medium-sized Enterprises in Indonesia
Figure 1 Firm size distribution, measured by number of workers
SOURCE: Adapted from Hsieh and Olken (2014) who use firm-level data from the 2006 Economic Census
In the centre panel of igure 1, the histogram is redrawn after dropping micro irms from the dataset. his panel restricts the range to between ten and 200 employees and rescales the y-axis, efectively plotting the size distribution for many SMEs, as well as larger irms. A similar skewed irm-size distribution appears in this graph. Notice that the irst bar, depicting the share of irms with between ten and 20 employees, is less than 2 percent of the total. In the right panel, we plot the histogram only for irms with 20 or more employees (medium and large irms). Contrary to widely held notions about irms in developing countries (for example, see Tybout 2000), these three graphs depict no evidence of a “missing middle” in Indonesia’s irm-size distribution. If anything, medium and large irms are both missing from the distribution.5
Using data from the IMK 2013 survey, we focus more closely on micro and small irms, examining the distribution of irm sizes for irms with no more than 20 employees. Figure 2 shows that even when we focus on just the micro and small irms, the distribution of employment sizes remains highly skewed. More than two-thirds of micro and small irms had no more than two employees. If we focus only on small irms, with more than four but less than 20 employees, more than 45 percent of those irms employed only ive or six employees and almost 75 percent had fewer than ten employees.
In the centre panel of igure 1, the histogram is redrawn after dropping micro irms from the dataset. his panel restricts the range to between ten and 200 employees and rescales the y-axis, efectively plotting the size distribution for many SMEs, as well as larger irms. A similar skewed irm-size distribution appears in this graph. Notice that the irst bar, depicting the share of irms with between ten and 20 employees, is less than 2 percent of the total. In the right panel, we plot the histogram only for irms with 20 or more employees (medium and large irms). Contrary to widely held notions about irms in developing countries (for example, see Tybout 2000), these three graphs depict no evidence of a “missing middle” in Indonesia’s irm-size distribution. If anything, medium and large irms are both missing from the distribution.
Using data from the IMK 2013 survey, we focus more closely on micro and small irms, examining the distribution of irm sizes for irms with no more than 20 employees. Figure 2 shows that even when we focus on just the micro and small irms, the distribution of employment sizes remains highly skewed. More than two-thirds of micro and small irms had no more than two employees. If we focus only on small irms, with more than four but less than 20 employees, more than 45 percent of those irms employed only ive or six employees and almost 75 percent had fewer than ten employees.
5 Columns 1 and 2 of table 2 show that many micro and small irms in Indonesia pay low wages to their workers. he median micro or small irm paid a monthly salary of Rp800,000 in 2013 which is only USD215.92 in PPP-adjusted current dollars. he bottom 25 percent of micro or small irms paid wages of less than Rp420,000 per month, which is only USD113.36 in PPP-adjusted current dollars and the bottom 5 percent paid wages that would amount to living on slightly more than USD1 per day.
10 0 10 20 30 40
50 100 150 200
10 < Employment < 200
P
er
cen
tage of F
ir ms 10 0 20 40 60 80
50 100 150 200 20
0 .1 .2 .3 .4
50 100 150 200
100
0 < Employment < 200 20 < Employment < 200
Figure 2 Number of workers, micro and small irms
SOURCE: Authors’ calculations using IMK 2013 data
NOTE: Separate bars are drawn for each integer of the number of workers, using the total of production and non-production workers in each firm.
Figures 1 and 2 show that the irm-size distribution in Indonesia is highly skewed and small irms tend to be very small. A considerable amount of theoretical and empirical work in economics has been devoted to supporting the proposition that economies of scale can play a crucial role in promoting economic growth. As economies develop, irm-size distributions become less skewed and more workers tend to work in larger irms, where they are employed more productively. Larger irms tend to produce goods at a lower per-unit cost and they are often better able to invest in and use capital equipment, allowing production to be less expensive, more sophisticated and of higher quality. For these reasons, a central challenge in private-sector development in Indonesia is to promote the creation and growth of large irms.
Many SMEs pay low wages
SMEs are responsible for employing a large share of Indonesia’s workers therefore, it is important to examine the wages they pay. Wage income is typically highly correlated with an individual’s actual income and relects standards of living for workers. In perfectly competitive environments with a large number of irms, wages will also equal the value of the additional product that a particular worker produces. In this way, examining wage distributions also allows us to examine the relative productivities of diferent SMEs.
Figure 3 presents a histogram of monthly wages paid by micro and small irms to their workers, using data from the IMK 2013 survey.6 he histogram is drawn with wages reported using nominal Indonesian rupiah
(Rp). As with irm-size distribution, the distribution of wages is skewed but it tends to vary more. We report the percentiles of the distribution of wages for micro, small and medium-sized irms in table 2 and convert Indonesian rupiah wage igures into US dollars (USD) using purchasing power parity (PPP) adjusted exchange rates.7
6 Wages per worker are calculated as the irm’s total wage bill divided by the number of workers employed. Note that wage data were only available for roughly 65 percent of irms and the data we worked with were trimmed at the top 1 percent. For many irms, particularly small irms, wages are hard to measure. here may be a number of reasons for this: small irms do not always keep good records; they may employ family workers and not pay them wages; and irms may be reluctant to share this information with survey enumerators.
7 Using market exchange rates can sometimes result in misleading international comparisons because market exchange rates luctuate rapidly, while the purchasing power of local currency is often stable. PPP adjustments are used to estimate what exchange rate between two currencies would equalise the purchasing power of the two countries’ currencies.
0 0 10 20 30 40
5 10 15 20
Total production and non-production workers
P
er
cen
11
Micro, Small and Medium-sized Enterprises in Indonesia
Figure 3 Monthly wages per worker, micro and small irms
SOURCE: Authors’ calculations using IMK 2013 data.
Columns 1 and 2 of table 2 show that many micro and small irms in Indonesia pay low wages to their workers. he median micro or small irm paid a monthly salary of Rp800,000 in 2013 which is only USD215.92 in PPP-adjusted current dollars. he bottom 25 percent of micro or small irms paid wages of less than Rp420,000 per month, which is only USD113.36 in PPP-adjusted current dollars and the bottom 5 percent paid wages that would amount to living on slightly more than USD1 per day.
Table 2 Distribution of monthly wages per worker, micro, small and medium-sized irms
Percentile
Micro and small irms Medium-sized irms
Rp USD
(PPP-adjusted exchange rates) Rp
USD
(PPP-adjusted exchange rates)
1% 45,499.96 12.28 21,935.27 5.92 5% 125,000.00 33.74 102,492.60 27.66 10% 200,000.00 53.98 340,082.40 91.78 25% 419,999.72 113.36 718,599.50 193.94 50% 800,000.02 215.92 1,269,379.00 342.59 75% 1,499,999.11 404.85 1,934,691.00 522.15 90% 2,640,000.44 712.54 3,290,291.00 888.02 95% 3,791,665.35 1,023.38 5,264,466.00 1,420.83 99% 7,488,002.83 2,021.03 10,700,000.00 2,887.82
SOURCE: Authors’ calculations using IMK 2013 data and WBES 2009 data
NOTE: The Indonesian rupiah figures from the WBES 2009 were converted to 2013 dollars using nominal and PPP exchange rates, taken from the World Bank’s International Comparison Project.
However, some micro and small irms pay decent wages, with the top ifth percentile paying employees more than Rp3.7 million per month (approximately USD1,023 in PPP-adjusted current dollars).
0 0 5 10
2000 4000 6000 8000
Monthly wages per worker, 2013 (Rp, thousands)
P
er
cen
Medium-sized irms tend to pay higher wages than micro and small irms, presumably relecting their larger productivity, although some also pay lower wages than micro or small irms. he median medium-sized irms paid a monthly salary of Rp1.2 million which was USD342.59 in PPP-adjusted current dollars. his represents almost 60 percent more than the wages paid by the median micro or small irm.
SMEs have relatively low labour productivity
Although SMEs employ a large portion of Indonesia’s workforce, they tend to be less productive than larger irms (Berry, Rodriguez and Sandee 2001). Small irms tend to be more labour intensive and they often use outdated technologies and run less eiciently than larger irms. Despite being responsible for over 97 percent of total employment in Indonesia, SMEs produce only 57 percent of the nation’s total value added.
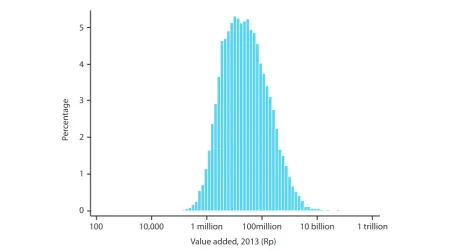
[image:30.595.59.527.375.626.2]Figure 4 plots a histogram of the distribution of value added across micro and small irms, using data from the IMK 2013 survey. he x-axis in the histogram is plotted in logarithmic scale and, in logs, the data appear to follow a normal distribution or bell curve. Most of the irms in the data (97.9 percent) had a total annual value in 2013 of between Rp1 million (USD269.89 in PPP-adjusted current dollars) and Rp10 billion (USD2.6 million in PPP-adjusted current dollars).
Figure 4 Value added, micro and small irms
SOURCE: Authors’ calculations using IMK 2013 data. NOTE: Value added on the x-axis is plotted in a log scale.
To measure the relative productivity of SMEs compared with larger irms, we irst constructed a measure of the value added per worker for each irm in the IMK 2013 and total sales per worker in the WBES 2009 data sets. hese igures represent estimates of average labour productivity. We then divided each irm’s labour productivity by the average labour productivity of large irms in Indonesia, deined as irms with 100 or more employees. his created a relative productivity ratio which we express in percentage terms.8
8 Average labour productivity of large irms in 2013 was approximately Rp266 billion, according to Statistics Indonesia (2013). 100
0 1 2 4 5
10,000 1 million 100million 10 billion
Value added, 2013 (Rp)
P
er
cen
tage
13
Micro, Small and Medium-sized Enterprises in Indonesia
Table 3 gives percentiles of the distribution of relative productivity. hese igures show that micro and small irms in Indonesia are extremely unproductive when compared with large irms. he median micro irm has a value added per worker measure that is less than 4 percent of the average value added per worker of large irms and the median small irm has a value added per worker that is only 13.8 percent of the average value added per worker of large irms. Even the 95th percentile of small irms and the 99th percentile of micro irms are less productive than Indonesia’s largest irms. Only the top 1 percentile of small irms employs a workforce that is more productive than the average large irm.
Although most medium-sized irms are considerably less productive than large irms, some are as or more productive than large irms. he top 5 percent of medium-sized irms are more than 50 percent more productive than the average large irm. However, productivity and irm size are not perfectly correlated. he bottom 25th percentile of medium-sized irms has only 7 percent of the value added per worker as the average large irm and looks similar to the bottom 25th percentile of small irms.
Table 3 Relative labour productivity of micro, small and medium-sized irms compared with large irms (per-centage)
Percentile Micro irms Small irms Medium-sized irms
1% 0.16 0.26 0.13 5% 0.38 1.75 1.58 10% 0.59 3.09 2.74 25% 1.31 6.57 6.98 50% 3.51 13.84 13.66 75% 9.47 29.02 34.16 90% 21.00 56.09 101.51 95% 32.80 89.19 153.27 99% 87.79 215.29 761.29
SOURCE: Authors’ calculations using IMK 2013 data, WBES 2009 data and Statistics Indonesia 2013 data.
NOTE: Columns show the percentage of value added per worker (for micro and small firms) or total sales per worker (medium firms) compared with the average value added (total sales) per worker for large firms.
Managers of SMEs have limited formal education
Managing and operating an SME is diicult and involves making hundreds of complex decisions, some of them almost constantly. One reason why SMEs may sufer from relatively low labour productivity is that they may not be well managed (Bloom et al. 2010). While owners may abound in initiative and drive, they may not be making optimal decisions about how to invest, manage inances, hire workers, access capital or market their products. Although it is diicult to measure managerial ability, the IMK 2013 and WBES 2009 surveys allow us to understand diferences in managers’ gender, age and educational attainment. Nearly 60 percent of micro and small irms were operated by men and 40 percent were operated by women. However, as we show in igure 5, women were more likely to operate the smallest micro irms. More than 46 percent of micro irms were operated by women, while only 16.1 percent of small irms were operated by women and even fewer medium-sized irms were operated by women.9 Men were more likely to be operating larger SMEs.
Some of the variation by gender is explained by variation in industries. For instance, women managed 82 percent of micro and small textile producers and 51 percent of micro and small garment irms. However, less than 4 percent of micro and small irms producing furniture were managed by women.
Figure 5 Gender of micro, small and medium-sized irm managers and operators
SOURCE: Authors’ calculations using IMK 2013 data.
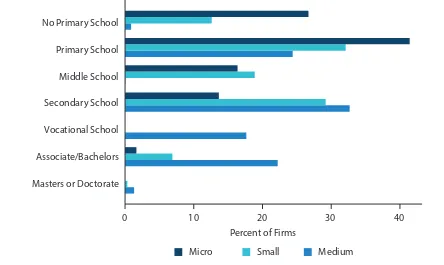
here were no signiicant diferences between the ages of managers of micro irms, small irms and medium-sized irms. However, micro and small irms tended to be operated by managers with relatively low levels of formal education, while medium-sized irms tended to be operated by people with higher levels of education (igure 6). More than 84 percent of micro irm managers and 63.5 percent of small irm managers did not complete secondary school. Only 25.4 percent of medium-sized irm managers did not complete secondary school. Few micro irm managers had attained higher levels of education. Less than 5 percent had acquired a bachelor degree or higher. For small irm managers, these igures were better but less than 8 percent had at least a bachelor’s or associate’s degree. However, almost one-quarter of medium-sized irm managers had a bachelor’s degree or higher.
One possible explanation for these trends in educational attainment is that individuals started irms because they were forced to leave school to make ends meet (Margolis 2014). If this is the case, such individuals should not be considered entrepreneurs per se; they started irms because they were severely constrained. Continuing education was either not possible because they could not aford to continue or not desirable because available opportunities to use acquired skills were limited. Although our survey data are limited in their ability to shed light on this hypothesis, evidence on the distribution of education by age provides some insight.
Figure 7 plots data on the relationship between educational attainment and age, using IMK 2013 data. Each bar reports the percentage of managers of micro and small irms with diferent levels of educational attainment; within an age bracket, the bars sum up to 100 percent. his graph shows that the highest rates of uncompleted primary school are concentrated in the older age groups, particularly the 51–60 and 61+ age brackets. Furthermore, older entrepreneurs were less likely to have completed high school than younger entrepreneurs. his suggests that when older entrepreneurs were making educational decisions, they may have been severely constrained and started their businesses out of necessity rather than by choice. It could also relect that when older individuals made educational decisions, they had limited opportunities for schooling. For example, Dulo (2001) describes a massive school construction programme in Indonesia in the 1970s; individuals making their decisions before this programme was implemented may not have had as much access to education as they would have today.
Female 0
20 40 60 80
P
er
cen
t of F
ir
ms
Small
Micro Medium
15
[image:33.595.74.518.103.368.2]Micro, Small and Medium-sized Enterprises in Indonesia
Figure 6 Educational attainment of micro, small and medium-sized irm managers and operators
SOURCE: Authors’ calculations using IMK 2013 and WBES 2009 data
NOTE: The education codes between these surveys were slightly different; the IMK 2013 survey does not ask about vocational school.
However, younger age cohorts have higher education levels and more than 30 percent of those aged 21–30 had inished high school. his could suggest that in recent years, people are more likely to have started irms by choice rather than out of necessity. However, it could also relect the changes in government education policy, such as the introduction of mandatory primary education and increased school construction which could be changing educational attainment over time.
Figure 7 Educational attainment of micro and small irm managers and operators, by age group
SOURCE: Authors’ calculations using IMK 2013 data.
NOTE: All micro and small firms are used in the analysis. We include the 16-20 age group to capture older youth who have started a business. Primary School
No Primary School
Middle School
Secondary School
Vocational School
Associate/Bachelors
Masters or Doctorate
Percent of Firms
Small Medium
0 10 20 30 40
Micro
P
er
cen
tage of F
ir
ms
Primary School No Primary School
16-20 21-30 31-40 41-50 51-60 61+
0 20 40 60
Higher Education Secondary School
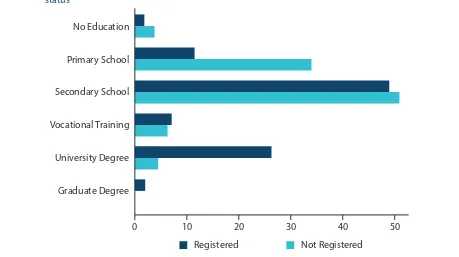
[image:33.595.71.527.498.742.2]Figure 8 uses WBES 2009 data to plot the highest level of education obtained by irm managers against the registration status of the irm; this igure is plotted only for SMEs. In this survey, respondents were asked in what year, if ever, the irm formally registered. If the respondent gave a year, we deined the irm as registered. his igure shows that managers of registered irms had higher educational levels than managers of unregistered irms. Nearly 30 percent of registered irms were managed by people with a university degree and 2.7 percent of registered irms were managed by people with a postgraduate degree. However, only 3.7 percent of unregistered irms were managed by people who had a university degree and no unregistered irms had managers who had attained a postgraduate degree. At the same time, 36.4 percent of unregistered irms were managed by people who had completed only primary school while for registered irm owners this was only 10.4 percent. hese diferences in educational attainment suggest that entrepreneurs with higher education levels are more likely to register their irms.
Figure 8 Educational attainment of small and medium-sized irm managers and operators, by registration status
SOURCE: Authors’ calculations using WBES 2009 data
Another way to assess the ability of managers is to examine their years of experience. Table 4 reports the distribution of the year that SMEs began operation. his table shows that a substantial percentage of SMEs are new to doing business. Approximately 8.5 percent of micro and small irms began operations in the past three years and 36 percent of micro and small irms began operations in 2004 or later, so they have less than 10 years of experience. In any given year, the distribution of experience relects irm entry, survival and exit so it is diicult to interpret this on its own. hat said, the signiicant portion of SMEs that began operation in the past three years suggests that many SMEs may enter and exit within a short time frame. Such patterns of entry and exit are normal, even in developed countries. For instance, using establishment-level panel data from the United States, Kerr and Nanda (2009) report that between 1977 and 1998, 42 percent of irms created survived for three years or less. Nearly 95 percent of these short-lived, churning entrants are small irms with fewer than 20 employees.10
10 Existing data sources do not allow researchers to track the performance of Indonesian SMEs over time, so it is hard to describe patterns of entry and exit and to understand the survival probabilities of SMEs.
Primary School No Education
Secondary School
Vocational Training
University Degree
Graduate Degree
Not Registered Registered
17
Micro, Small and Medium-sized Enterprises in Indonesia
Table 4 Distribution of year started for micro, small and medium-sized irms
Year started
Micro and small irms Medium-sized irms
Number Percent Number Percent
1970 or earlier 108,925 3.2 991 4.9 1971–1980 251,932 7.4 921 4.55 1981–1990 512,116 15.1 5,050 24.96 1991–2000 962,233 28.3 9,378 46.35 2001–2010 1,274,740 37.5 3,895 19.25 2011–2013 289,379 8.5
Total 3,399,325 100.0 20,325 100.0
SOURCE: Authors’ calculations using IMK 2013 and WBES 2009 data
Many SMEs serve local markets and do not expand their businesses
Most SMEs have a narrowly-focused demand market. According to the IMK survey, nearly 75 percent of micro and small irms sold their entire output of goods locally, in the same district where the goods were produced. Less than 6 percent of micro and small irms sold output to markets outside of the same province and less than 0.5 percent of micro and small irms exported any goods.11 However, as expected, larger irms were more likely
to be outward-oriented than smaller, micro irms. While 82 percent of micro irms sold their entire output in their same province, only 50 percent of small irms sold their entire output in their same province. Small irms were also more likely to export goods than micro irms but less than 3 percent of small irms exported any of their output, compared with less than 0.5 percent of micro irms.
Some of the variation in the tendency to serve a local or export market can be explained by diferences across industries. According to the IMK 2013 survey, more than 80 percent of food-processing micro and small irms sold their entire output in the same local district. In contrast, only 56 percent of micro and small garment manufacturers sold their entire output in the same district. Furniture-making micro and small irms were also considerably more likely to export some of their products than food-processing irms although the absolute rates of participation in export markets were both small (0.6 percent of furniture-making irms and 0.2 percent of food-processing irms).
Although it is diicult to measure the extent to which managers of SMEs want to grow or expand their businesses, the WBES 2009 asked small, medium-sized and large irms several questions that relected whether they had made signiicant attempts to grow their businesses. hese questions asked owners whether their irms had applied for electrical connections or construction permits over the previous two years and whether over the previous iscal year, their establishments had made any investments by purchasing ixed assets or applying for a loan. Note that these questions address the actual behaviour of irms. A crucial question is whether many SMEs would like to grow but cannot due to issues relating to credit constraints, business regulations or a diicult operating environment. In chapter 3, we describe a new qualitative survey that investigates this question more directly.
Table 5 summarises the results of the WBES 2009. In the 12 months before the survey, only 28 percent of SMEs had made investments by purchasing ixed assets and only 17 percent had applied for a loan. In the previous two years, only 5 percent of SMEs had applied for a construction permit and only 13 percent had applied for an electrical connection. his suggests that many SMEs have not taken steps to expand their businesses.
Table 5 SMEs taking steps to expand (percentage)
Applied for a construction permit in past two years?
Applied for an electrical connection in the past two years?
No Yes No Yes
All SMEs 95 5 87 13 Medium-sized firms 83 17 59 41 Small firms 96 4 90 10 Formal firms 93 7 89 11 Informal firms 98 2 90 10
SOURCE: Authors’ calculations using WBES 2009 data
In general, whether irms took steps to grow their businesses seemed to be positively correlated with irm size. Medium-sized irms were more likely than small irms to purchase ixed assets, apply for construction permits, apply for loans and apply for electrical connections. Only 16 percent of small irms in the survey reported applying for a loan in the previous year and only 24 percent had purchased any ixed assets. However, more than one-quarter of medium-sized irms had applied for a loan in the previous year and nearly two-thirds had purchased ixed assets.
Implications for our research
his chapter provided an overview of micro, small and medium-sized irms in Indonesia, drawing on two representative data sets collected between 2009 and 2013. he IMK and WBES data show that while SMEs are abundant in Indonesia, they are typically less productive, pay lower wages and take fewer steps to expand their businesses than larger irms. hey also lack managerial capacity, based on the basic characteristics of their owners. his is the background against which we present our research in the remaining chapters.
3
Qualitative Interviews
with Small and
Existing data sources on SMEs in Indonesia do not give researchers and policymakers a detailed understanding of the challenges that these enterprises face. his is because many aspects of SME decision-making, their business environment and their production functions are diicult to measure quantitatively. To provide an in-depth understanding of the constraints that SMEs face and to evaluate the efectiveness of existing policies that attempt to alleviate those constraints, we designed and ielded a new mixed-methods survey, the 2014 RAND and AKATIGA SME Survey (R+A SME Survey), which we administered to 192 Indonesian SMEs in August 2014. Our goal with this survey was to develop a more comprehensive understanding of SMEs in Indonesia and how these irms interact with the existing policy environment. Instead of surveying the smallest and most vulnerable irms, our focus was on the challenges faced by slightly larger small and medium-sized irms that tend to be more growth-oriented. We also opted for a data collection strategy that involved administering a longer, more detailed questionnaire to a small number of irms, choosing depth over breadth, unlike many existing surveys, which tend to administer a shorter survey to a larger number of irms.
In this chapter, we outline the theory-driven data collection process we developed and undertook for this project. We irst describe a basic analytical framework for understanding the diferent decisions that SMEs make. his framework borrows from the economic theory of the irm and involves a precise formulation of the objectives that SMEs are trying to achieve and the constraints they face when making decisions that afect their business operations.12 his analytical framework was used to structure and guide our data collection.
After describing the analytical framework and our research focus, we discuss our approach to data collection by geographic and industry selection. he survey we developed was a comprehensive, mixed-methods survey which predominantly focused on qualitative, open-ended interview questions, although some response items were quantitative in nature. We interviewed a small sample of irms that was not randomly selected from the population; instead, we focused on core sectors and regions of interest to policymakers. We conclude the chapter by discussing questionnaire development, irm sample selection and the site selection processes. More precise implementation details, such as the composition of data collection teams, timeline of the survey and ieldwork logistics can be found in appendix C.
Analytical framework
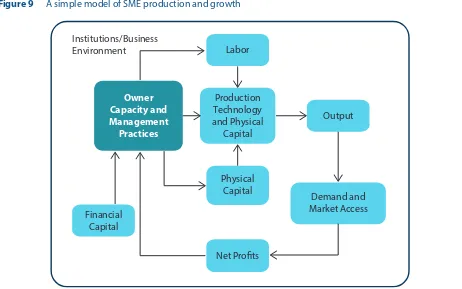
We begin by outlining a simple model of SME production and growth, depicted visually in igure 9. he blue box in this igure represents the SME owner and operator. his owner draws on a quantity of inancial capital and decides how to spend that capital on diferent factors of production, such as hiring labour, purchasing (or leasing) capital equipment, obtaining raw materials and determining what sort of production technology to use to produce the desired goods or services. he owner then determines how to combine those productive factors and the production technology to produce output. When output is produced, it is sold to the demand source. his demand source is often inal consumers who consume the inished products. However, if the irm is producing intermediate inputs or components of a larger product, the demand source may be other irms or middlemen.
he sale of goods produced by the irm generates revenue to cover the irm’s costs, including wages paid to workers and the costs of acquiring capital, renting land or retail space and complying with business regulations (taxes, registration permits and so on). If the irm is small and producing in a competitive environment, many prices that govern irm proits, such as the prices of inal goods that are delivered to consumers, wage rates or the cost of raw materials, may be determined nationally or internationally and are essentially outside the irm’s control. Over time, the net proits generated from a stream of sales revenue may be reinvested in the irm to
21
Qualitative Interviews with Small and Medium-sized Firms
[image:39.595.73.535.159.448.2]facilitate growth. A successful business may decide to use its proits to hire more workers or expand into a new location. It may also be able to use its proits to negotiate terms with a lender, so that it can borrow at more favourable rates to inance an expansion.
Figure 9 A simple model of SME production and growth
he entire production process operates within the business environment, represented by the large box that surrounds everything in the model. he business environment is an amalgamation of government institutions and market-driven conditions that afect the irm’s decision-making process. For example, a stringent regulatory environment could increase the cost of complying with tax regulations. Government policies that favour large irms or promote monopolies could create an environment that is averse to irm entry and competition. If contracts laws are inadequately enforced, it could make it diicult to secure a source of raw materials or make it easier for buyers to renege on a sale.
Importantly, this model of irm behaviour could potentially have multiple equilibria. Virtuous circles of growth occur when irms produce output and sell it for a substantial proit and that proit can be reinvested in the irm, allowing it to hire more workers, rent more capital or invest in new technologies. his leads to greater output and higher revenues. On the other hand, if irms cannot access sources of inance or more productive technologies, they may not be able to produce much to sell on the market and this reduces proits and limits further reinvestment in the irm. With policies designed to alleviate the constraints that SMEs face, the government endeavours to push those irms out of the vicious cycle, poverty-trap equilibrium and into the virtuous cycle, development and growth equilibrium.
SME policies can afect any of the nodes in the conceptual model in igure 9. Policies can have direct impacts, such as capacity-building programmes to improve a irm’s labour quality, or indirect impacts, such as a programme that promotes an Indonesian sector abroad, increasing demand for every irm that is part of that sector. In the next sections of this chapter, we describe how we used this analytical framework to design a survey that focused on SMEs that are struggling to overcome their challenges to growth.
Labor
Production Technology and Physical
Capital
Physical Capital
Net Proits
Output
Demand and Market Access Financial
Capital
Owner Capacity and Management
Practices
Research focus: larger, growth-oriented SMEs
As discussed in chapter 2, many of Indonesia’s irms are extremely small, add little value when they produce goods and pay low wages to workers. La Porta and Shleifer (2014) argue that developing economies often exhibit characteristics of a dual economy, characterised by the simultaneous presence of a sector with high value added and a sector with low productivity and low value added. Many of the smallest irms in developing countries, most of which may be in the informal sector, are not likely to be major sources of economic growth, simply because they do not have the capacity to make the transition from the traditional sector to the more productive, modern sector. Entrepreneurs with little formal education manage these small, ineicient irms and they produce lower-quality goods for poorer consumers. Because of their market orientation, these irms have few incentives to grow and do not compete with the larger, more productive irms, which produce diferent products for more aluent consumers.
Instead of focusing on these extremely small, vulnerable and often poorly-managed irms, we sought to learn more about slightly larger irms with both the potential and the desire to be growth-oriented. hese irms are the most likely beneiciaries of SME support programmes because they show the most promise in terms of growth and we sought to understand the constraints and challenges they face in doing business.
Our research strategy was to conduct in-depth interviews with a small number of irms to better understand the choices they make and the environment in which they operate. Although the irms that we interviewed were not randomly sampled or selected using a probability sample, we covered many key industries and conducted interviews in four diferent provinces, so our survey attempted to be broadly representative.
In the following sections of this chapter, we set out our approach to interviewing these irms. We irst describe the survey questionnaire, then we discuss our industry and geographic selection and inally we explain how irms were recruited to participate in the survey.
Survey questionnaire development
Our research team designed a new survey questionnaire to elicit detailed information about how SMEs operate, the constraints they face, and the successes and failures of existing government programmes and policies in helping these irms to grow. he survey focused on open-ended questions and was designed as a guide for structured one-on-one interviews with owners of SMEs. Although the body of the survey was dedicated to ielding open-ended questions, we also included many quantitative response items which were more direct and speciic.
23
Qualitative Interviews with Small and Medium-sized Firms
Table 6 Questionnaire sections
Section Description
O Interview information
A Basic information (location, firm and respondent information, starting and operating the business) B Licensing
C Raw materials D Production
E Sales and distribution F Profits and growth G Access to markets H Managerial training
I Credit constraints J Labour and human capital K Production technology
L Cooperatives and industry associations M Taxation and informal payments N Other government policies
The full questionnaire can be found in appendix A.
Our in-depth interviews with SME owners or managers typically lasted between 60 and 90 minutes. he full questionnaire is reproduced in appendix A. After administering the questionnaire, enumerators were asked to ill in a debrieing form to summarise the irm’s responses to the major questions in the survey. he debrieing form is reproduced in appendix B.
Industry selection
[image:41.595.71.545.101.381.2]To determine the irms to be interviewed, we irst selected the industries that are currently major sources of employment for SMEs and focus sectors for Indonesia. hese industries are potential targets for policy changes to facilitate broad economic growth and poverty reduction. We also included industries that are more aspirational, innovative and dynamic that may be currently growing in importance. hese industries are also dispersed over several provinces, allowing us to highlight the diversity of experiences and challenges that diferent irms in Indonesia face in