and Promotion for Faculty in
the Humanities 1977–95
Donna K. Ginther
Kathy J. Hayes
a b s t r a c t
This study uses data from the Survey of Doctorate Recipients to evaluate gender differences in salaries and promotion for academics in the humani-ties. Over time, gender salary differences can largely be explained by aca-demic rank. Substantial gender differences in promotion to tenure exist after controlling for productivity and demographic characteristics. How-ever, we observe a slight decline in the gender promotion gap for the most recent cohort evaluated. On the basis of this evidence, we conclude that gender discrimination for academics in the humanities tends to oper-ate through differences in promotion, which in turn affects wages.
I. Introduction
In his examination of the salaries and appointments of men and women in academia, the Director of Research at the American Association of Univer-sity Professors (AAUP) observes: ‘‘Substantial disparities in salary, rank, and tenure between male and female faculty persist despite the increasing proportion of women
Donna K. Ginther is an associate professor of economics at the University of Kansas. Kathy J. Hayes is a professor of economics at Southern Methodist University. The authors thank the National Science Foundation for granting a site license to use the data and Kelly Kang of the NSF for providing techni-cal documentation. Robert Pollak, Barton Hamilton, Kenneth Troske, Peter Mueser, John Pencavel, Paula Stephan, Finis Welch, and seminar participants at the Southern Economic Association Meetings, the University of Missouri-Columbia, the American Economic Association Annual Meetings, the NBER Higher Education Conference, and the EALE/SOLE World Conference provided valuable comments on the paper. Sherry Okun assisted with constructing the tables in this paper. The opinions expressed are those of the authors and do not reflect those of the Federal Reserve Bank of Atlanta or the Federal Re-serve System. The authors take responsibility for any errors. The data used in this article can be ob-tained provided that requestors first obtain a site license from the National Science Foundation. The data may then be obtained beginning in August 2003 through July 2006. Donna Ginther, Department of Economics, University of Kansas, 1300 Sunnyside Drive, Lawrence, KS 66045-7585.
[Submitted September 1999; accepted July 2001]
ISSN 022-166X2003 by the Board of Regents of the University of Wisconsin System
Ginther and Hayes 35
in the academic profession’’ (Benjamin 1999). While the evidence presented by AAUP is striking, the gender comparisons of salaries do not control for characteris-tics that contribute to pay differentials such as academic field or publication record. Likewise, the AAUP combines part-time and full-time academics in its analysis of rank, implicitly assuming no gender differences in preferences for full-time employ-ment. Furthermore, characteristics that affect salaries including publications, field of study, and employer characteristics will likely affect both academic rank and salary. Disentangling the causes of gender disparities in salary and promotion re-quires an in-depth examination of the relationship between the two. In this paper we examine gender differences in employment outcomes for academics in the hu-manities. Our study finds negligible gender salary differences within rank and sub-stantial gender promotion differences.
Most studies of gender differences in academic employment outcomes consider only salaries. In a recent survey of that literature, Ransom and Megdal (1993) indi-cate that the salary gap has fallen considerably pre- and post-1972. Studies using national surveys and including publication information in the analysis (Ferber and Kordick 1978; Barbezat 1987, 1989a, 1989b; Ransom and Megdal 1993) find that the pre-1972 gap ranges from 12 to 17 percent. The post-1972 gap is narrower, 5 to 12 percent.
The literature contains far fewer studies of gender differences in academic promo-tion. Long, Allison, and McGinnis (1993) examine the promotion of biochemistry doctorates working in academia who received their Ph.D. between 1956 and 1967. Using a discrete time-proportional hazards model, they find that women are 10 per-cent less likely to be promoted than men. Kahn (1993, 1995) uses the Survey of Doctorate Recipients to compare promotion of academic economists by gender, finding that women take longer to be promoted than men. A study by Broder (1993) explicitly models the endogeneity of rank, department affiliation, and publications. Using data from National Science Foundation Economics Program grant proposal applications, she reports significant gender difference among older cohorts. The gen-der gap is not evident for her sample of assistant professors. McDowell, Singell, and Ziliak (1999, 2001) examine the promotion probabilities of academic econo-mists, finding that women are less likely to be promoted than comparable men. How-ever, they also find evidence that promotion probabilities for women are improving over time. Finally, Ginther and Hayes (1999) evaluate the career paths of academics in the humanities, showing the majority of the gender salary differential in 1993 can be explained by academic rank. Their analysis also shows significant differences in the duration to promotion to tenure by gender.
Recipi-ents contains detailed information on academic productivity (publications) in the humanities. These data are not consistently available for the sciences. Finally, the Survey of Doctorate Recipients contains detailed information on demographic and employer characteristics, along with measures of promotion and salaries, allowing the researcher to compare academic salary and promotion differentials.
Our study finds differences in salary and promotion outcomes by gender using three methods: A salary decomposition is used to examine gender pay differentials. Binary choice models and duration analysis are used to estimate the probability of promotion to tenure. Over time, gender salary differences can be explained by aca-demic rank: the gender salary gap is not significantly different from zero within all academic ranks in 1995. However, substantial gender differences in promotion to tenure exist after controlling for productivity and demographic characteristics. On the basis of this evidence, we conclude that gender discrimination for academics in the humanities tends to operate through differences in promotion. The remainder of the paper is organized as follows: Section II describes the data, Section III details the empirical methodology, Section IV evaluates the empirical results, and Section V concludes.
II. The Data
This study uses data from the 1977–95 waves of the Survey of Doc-torate Recipients (SDR). The SDR is a biennial, longitudinal survey of docDoc-torate recipients from U.S. institutions conducted by the National Research Council. The SDR collects detailed information on doctorate recipients including demographic characteristics, educational background, primary work activity, employer character-istics, and salary. The SDR has undergone substantial changes between the 1977 and 1993 waves (Mitchell, Moonesinge, and Cox 1998). Technical reports provided by National Science Foundation have allowed us to construct cross-sectional and longtudinal samples with consistent variable definition over time.1
We have selected two samples of doctorates in the humanities in order to examine salary and promotion differentials by gender. The first data we analyze, the cross-sectional samples, are repeated cross-sections of tenured individuals or those on the tenure track for each survey year from 1977 to 1995. To qualify as being tenured or on the tenure track, individuals in this sample must report consistent tenure status and rank (assistant, associate, or full professor).2In addition, these individuals must be employed at an institution classified as research, doctorate granting, comprehen-sive, or liberal arts by the Carnegie Foundation for the Advancement of Teaching. We also select individuals working full-time with salaries greater than $10,000. We impose these restrictions in order to evaluate changes in the gender salary gap for permanent academic employees.
Our second data set, the longitudinal sample, includes individuals who received
1. A data appendix available from the authors by request evaluates the impact of sample frame changes on the estimated results. The appendix also discusses variable definitions.
Ginther and Hayes 37
their Ph.D.s between the years of 1975 and 1989 and who meet additional restric-tions. This sample is restricted to individuals who at some point are observed on the tenure track while also being in the survey at least seven years after receiving their Ph.D. Individuals are excluded from the sample if they are not observed more than once in the SDR or if they skip more than three surveys and do not report the year they received tenure. This sample is used to evaluate promotion to tenure.
The sample selection criteria used in the longitudinal sample could potentially lead to selection and attrition biases. By selecting individuals who at some point have tenure track jobs, we only observe academic ‘‘success.’’ If there is gender discrimination in obtaining a tenure track job—where women need to have outstand-ing qualifications to receive an appointment—this could result in the average quality of women on the tenure track being higher than the average quality of men. In turn, this selected sample could lead to biased estimates that understate the true gender differences in promotion. In addition, it could be that those who leave the tenure track are more likely to leave the sample. However, the SDR follows individuals regardless of whether they are employed in academia.
Ideally, when using this sample we would estimate the duration until promotion conditional on starting with a tenure-track academic job. However, this is not possi-ble given the biennial design, changes in the survey questionnaire, changes in the sampling frame, changes that eliminate individuals from the survey, and the numer-ous individuals who skip survey years. We modify the data and analytical approach in order to account for these problems.
We construct the longitudinal sample using information from every year that an individual has a valid survey. Since we do not observe the exact year an individual enters the tenure track, we estimate the duration until promotion to tenure after re-ceiving the doctorate. Using the 1977 through 1991 surveys, we observe the exact tenure year. After 1991, we impute tenure year as the year an individual first reports being tenured in the subsequent surveys. Thus, for the most recent cohort, imputed duration until promotion may be longer than the actual duration. Even though we have to impute tenure year for the later surveys, this is a better measure of promotion than changes in rank because we can only observe rank changes every other year. Time-varying covariates such as employer characteristics, marital status, and primary work activities are measured as the proportion of time an individual is observed in the sample meeting a given condition. For example, the variable proportion of time employed at a top college is defined as the number of times we observe an individual working at a top-tier Carnegie ranked four year or liberal-arts college divided by the total years this person is observed in the survey.
Our study focuses on the humanities because the SDR contains detailed measures of professional productivity in these fields, and women with doctorates are more prevalent in the humanities than the sciences.3Academic disciplines in the humani-ties are grouped into the following fields: history, performing arts, philosophy, En-glish, languages, and other humanities.
Even though academic productivity is available for those in the humanities, it is measured with error for the purposes of the promotion estimates. When individuals
receive tenure, their cumulative publication record is evaluated. We do not observe an individual’s cumulative publication record because the SDR only began collecting productivity information for individuals in the humanities starting with the 1983 survey, allowing us to quantify productivity for individuals between 1981 and 1995.4 In order to estimate the effect of productivity on promotion, we use these limited observations on publications to create average measures of productivity over an indi-vidual’s career, obtained by dividing the sum of the observed productivity measure by years of experience in the last year observed. In doing so, we assume that an individual’s productivity is roughly constant over their career.5
These average measures of productivity are measured with error and will poten-tially bias estimates of the effect of productivity on promotion.6In addition, assuming constant productivity over an individual’s career is likely erroneous. In the humani-ties, books are weighted more heavily than articles in promotion decisions, and books are more likely to appear early in an academic’s career because of promotion consid-erations.7Furthermore, academics in the performing arts tend to exhibit or perform their work and this activity is included in a category for ‘‘other publications.’’ The other publications category is available starting with the 1987 survey. Although there are problems with the accurate measurement of productivity, omitting this informa-tion from promoinforma-tion estimates will also cause problems, resulting in omitted variable bias. Given the need to ‘‘publish or perish’’ in academia, controlling for publications and productivity is crucial to our understanding of the promotion process; thus aver-age productivity variables are included in these estimates.
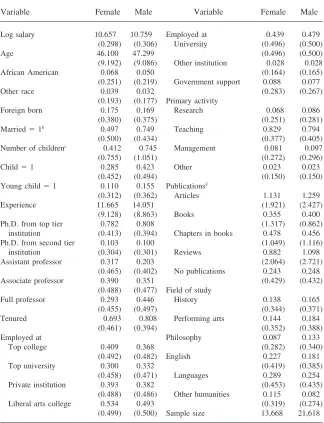
Table 1 lists the descriptive statistics for the variables used in the pooled cross-sectional Samples. Comparing the natural logarithm of real salaries, men earn 10 percent more on average than women.8Women are less likely to be married or have children; they have fewer children as well. Women have fewer years of experience and are more prevalent in the lower ranks; they are also likely to be tenured than men in the humanities. Women are less likely to be employed at universities while being more likely to receive government support. Both men and women report pri-mary work as teaching in the humanities. Men and women are evenly matched in terms of productivity with the exception of reviews, where men write more reviews than women. The three most prevalent fields for men and women are the same: English, languages, and performing arts.
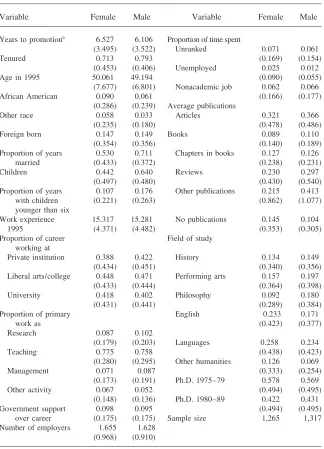
Table 2 contains descriptive statistics by gender for the longitudinal sample. Women in the sample take longer to be promoted and are less likely to be promoted than men in the sample, while having the same number of years’ experience. As mentioned previously, productivity is averaged over the individual’s career. We find 4. The SDR did not ask productivity questions in the 1985 survey.
5. Evidence on career productivity profiles is limited. McDowell (1982) uses data on the number of publi-cations over the careers of men and women in English and history. Although this is dated information, evidence from these two fields indicates no significant gender differences in productivity as a function of age. However, productivity is not constant over an individual’s career.
6. In OLS estimates, coefficients on productivity will be biased toward zero; the effect of measurement error on multivariate probit and duration model estimates is difficult to determine.
7. Evidence from McDowell (1982) shows that productivity for his sample of academics in English and history peaks around age 40.
Ginther and Hayes 39
Table 1
Descriptive Statistics: Means and Standard Deviations, 1977–95 Survey of Doctorate Recipients, Pooled Cross-Sectional Samplesa
Variable Female Male Variable Female Male
Log salary 10.657 10.759 Employed at 0.439 0.479
(0.298) (0.306) University (0.496) (0.500)
Age 46.100 47.299 (0.496) (0.500)
(9.192) (9.086) Other institution 0.028 0.028
African American 0.068 0.050 (0.164) (0.165)
(0.251) (0.219) Government support 0.088 0.077
Other race 0.039 0.032 (0.283) (0.267)
(0.193) (0.177) Primary activity
Foreign born 0.175 0.169 Research 0.068 0.086
(0.380) (0.375) (0.251) (0.281)
Married⫽1b 0.497 0.749 Teaching 0.829 0.794
(0.500) (0.434) (0.377) (0.405)
Number of childrenc 0.412 0.745 Management 0.081 0.097
(0.755) (1.051) (0.272) (0.296)
Child⫽1 0.285 0.423 Other 0.023 0.023
(0.452) (0.494) (0.150) (0.150)
Young child⫽1 0.110 0.155 Publicationsd
(0.312) (0.362) Articles 1.131 1.259
Experience 11.665 14.051 (1.921) (2.427)
(9.128) (8.863) Books 0.355 0.400
Ph.D. from top tier 0.782 0.808 (1.317) (0.862)
institution (0.413) (0.394) Chapters in books 0.478 0.456
Ph.D. from second tier 0.103 0.100 (1.049) (1.116)
institution (0.304) (0.301) Reviews 0.882 1.098
Assistant professor 0.317 0.203 (2.064) (2.721)
(0.465) (0.402) No publications 0.243 0.248
Associate professor 0.390 0.351 (0.429) (0.432)
(0.488) (0.477) Field of study
Full professor 0.293 0.446 History 0.138 0.165
(0.455) (0.497) (0.344) (0.371)
Tenured 0.693 0.808 Performing arts 0.144 0.184
(0.461) (0.394) (0.352) (0.388)
Employed at Philosophy 0.087 0.133
Top college 0.409 0.368 (0.282) (0.340)
(0.492) (0.482) English 0.227 0.181
Top university 0.300 0.332 (0.419) (0.385)
(0.458) (0.471) Languages 0.289 0.254
Private institution 0.393 0.382 (0.453) (0.435)
(0.488) (0.486) Other humanities 0.115 0.082
Liberal arts college 0.534 0.493 (0.319) (0.274)
(0.499) (0.500) Sample size 13,668 21,618
a. The cross-sectional samples include all individuals working full-time, earning at least $10,000 per year in 1992 dollars, with tenure or on the tenure track at an institution classified as research, doctorate granting, comprehensive, or liberal arts by the Carnegie Foundation for the Advancement of Teaching. b. 12,287 female observations; 18,106 male observations.
Table 2
Descriptive Statistics, 1977–95 Survey of Doctorate Recipients, Longitudinal Samplea
Variable Female Male Variable Female Male
Years to promotionb 6.527 6.106 Proportion of time spent
(3.495) (3.522) Unranked 0.071 0.061
Tenured 0.713 0.793 (0.169) (0.154)
(0.453) (0.406) Unemployed 0.025 0.012
Age in 1995 50.061 49.194 (0.090) (0.055)
(7.677) (6.801) Nonacademic job 0.062 0.066
African American 0.090 0.061 (0.166) (0.177)
(0.286) (0.239) Average publications
Other race 0.058 0.033 Articles 0.321 0.366
(0.235) (0.180) (0.478) (0.486)
Foreign born 0.147 0.149 Books 0.089 0.110
(0.354) (0.356) (0.140) (0.189)
Proportion of years 0.530 0.711 Chapters in books 0.127 0.126
married (0.433) (0.372) (0.238) (0.231)
Children 0.442 0.640 Reviews 0.230 0.297
(0.497) (0.480) (0.430) (0.540)
Proportion of years 0.107 0.176 Other publications 0.215 0.413
with children (0.221) (0.263) (0.862) (1.077)
younger than six
Work experience 15.317 15.281 No publications 0.145 0.104
1995 (4.371) (4.482) (0.353) (0.305)
Proportion of career Field of study working at
Private institution 0.388 0.422 History 0.134 0.149
(0.434) (0.451) (0.340) (0.356)
Liberal arts/college 0.448 0.471 Performing arts 0.157 0.197
(0.433) (0.444) (0.364) (0.398)
University 0.418 0.402 Philosophy 0.092 0.180
(0.431) (0.441) (0.289) (0.384)
Proportion of primary English 0.233 0.171
work as (0.423) (0.377)
Research 0.087 0.102
(0.179) (0.203) Languages 0.258 0.234
Teaching 0.775 0.758 (0.438) (0.423)
(0.280) (0.295) Other humanities 0.126 0.069
Management 0.071 0.087 (0.333) (0.254)
(0.173) (0.191) Ph.D. 1975–79 0.578 0.569
Other activity 0.067 0.052 (0.494) (0.495)
(0.148) (0.136) Ph.D. 1980–89 0.422 0.431
Government support 0.098 0.095 (0.494) (0.495)
over career (0.175) (0.175) Sample size 1,265 1,317 Number of employers 1.655 1.628
(0.968) (0.910)
Ginther and Hayes 41
a small gender gap in average productivity consistent with that reported recently in The Chronicle of Higher Education(Schneider 1998). In order to evaluate changes in promotion by gender over time, longitudinal sample is divided into two cohorts defined by the year an individual received their Ph.D.
III. Empirical Methodology
The study begins with an evaluation of the gender wage structure. Wage regressions are estimated as a function of demographic characteristics, aca-demic background, employer characteristics, and acaaca-demic productivity. The analy-sis continues by evaluating salary differentials using a salary decomposition devel-oped by Oaxaca (1973) where the salary gap can be characterized as follows: (1) ln(w¯m)⫺ln(w¯f)⫽∆X¯′βm⫹X¯′f∆β
Let ∆X¯ ⫽X¯
m⫺ X¯f be the difference in average endowments and∆β⫽βm⫺βf
be the differences in estimated coefficients (salary structure), the term that accounts for the effect of discrimination.
In order to interpret coefficient differences as discrimination researchers must make several assumptions. First, one assumes that in the absence of discrimination, the coefficients would be the same for men and women. Second, the model must contain all relevant explanatory variables. If some relevant variables are omitted, then one cannot definitively argue that coefficient differences are due to discrimina-tion. Third, researchers much choose the nondiscriminatory salary structure. In Equa-tion 1 we implicitly assume that the male coefficients represent the nondiscriminatory salary structure.9However, discrimination may operate by conferring unfair advan-tage in the form of nepotism to men and unfair disadvanadvan-tage in the form of discrimi-nation to women. Thus, the male salary structure may not represent the salary that would prevail in the absence of discrimination. Researchers including Neumark (1988) and Oaxaca and Ransom (1994) suggest using a weighted average of the male and female wage structure (a pooled method) to proxy for the unobserved nondiscriminatory wage.
Although using the pooled method may correct for the combined effects of nepo-tism and discrimination, it requires additional assumptions about the unobserved nondiscriminatory wage and the weighting mechanism used to obtain it. Even if the pooled approach provides an accurate estimate of the nondiscriminatory wage structure, it cannot account for the competitive wage structure that would have pre-vailed had discrimination never existed (Oaxaca and Ransom 1994). Finally, the pooled approach is not likely to be used in legal cases concerned with discrimination. Oaxaca and Ransom observe (1994, p. 18): ‘‘In effect U.S. law leans toward the adoption of the white or male wage structure as the norm.’’
the norm does not require estimation of the unobserved counterfactual wage struc-ture. Thus, the coefficient estimates attributable to discrimination in this study may reflect both male advantage and female disadvantage. As such, they may overstate the true effect of discrimination.
The study continues by evaluating gender differences in promotion using the lon-gitudinal sample and two empirical methods. First, we estimate probit models in order to determine whether significant differences exist in the probability of promo-tion by gender. Second, durapromo-tion models are used to estimate the condipromo-tional proba-bility of promotion to tenure given the individual has survived untenured.
Duration to tenure is modeled using the proportional hazards model. The hazard function gives the instantaneous risk that promotion to tenure will occur at yeart, where the hazard of promotionhi(t) is a function of the baseline hazardλo(t) and
covariates,xin Equation 2.
(2) hi(t)⫽λo(t)exp{β1xi1⫹⋅ ⋅ ⋅⫹βkxik}
The baseline hazard function is left unspecified and can be interpreted as the hazard function for an individual whose covariates all equal zero. The covariates in Equation 2 influence the scale of the hazard rate and are not a function of time. Additional covariates used in this analysis include demographic and employer characteristics, employment background, primary work activity, and productivity.
IV. Empirical Results
A. Estimates of the Gender Salary Structure in the Humanities
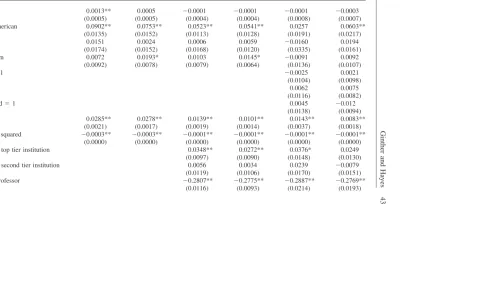
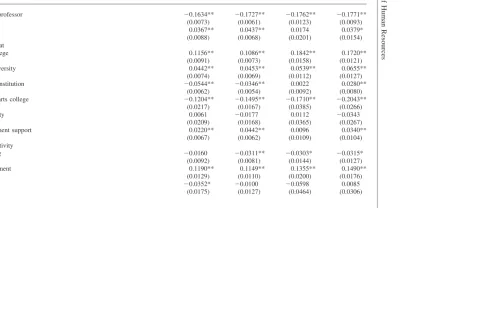
Our analysis begins by estimating the underlying gender salary structure in the hu-manities using the sectional samples. The data for each year of the cross-sectional samples are pooled in order to evaluate the effect of demographic and employer characteristics and academic productivity on wages. We estimate three specifications that progressively add more controls in order to evaluate whether sig-nificant gender differences in the coefficients exist, and the relative contribution of these coefficient differences to the pay gap. We take this approach in order to account for the various factors that influence academic salaries. By having a comprehensive list of controls in the salary regressions, we are better able to interpret differences in coefficient estimates by gender as resulting from discrimination. The parameters of interest are reported in Table 3.10
Ginther
and
Hayes
43
Table 3
Estimates of the Gender Wage Structure in the Humanities, 1977–95 Survey of Doctorate Recipients, Pooled Cross-Sectional Samplesa
Model 1 Model 2 Model 3
Variable Male Female Male Female Male Female
Age 0.0013** 0.0005 ⫺0.0001 ⫺0.0001 ⫺0.0001 ⫺0.0003
(0.0005) (0.0005) (0.0004) (0.0004) (0.0008) (0.0007)
African American 0.0902** 0.0753** 0.0523** 0.0541** 0.0257 0.0603**
(0.0135) (0.0152) (0.0113) (0.0128) (0.0191) (0.0217)
Other race 0.0151 0.0024 0.0006 0.0059 ⫺0.0160 0.0194
(0.0174) (0.0152) (0.0168) (0.0120) (0.0335) (0.0161)
Foreign born 0.0072 0.0193* 0.0103 0.0145* ⫺0.0091 0.0092
(0.0092) (0.0078) (0.0079) (0.0064) (0.0136) (0.0107)
Married⫽1 ⫺0.0025 0.0021
(0.0104) (0.0098)
Child⫽1 0.0062 0.0075
(0.0116) (0.0082)
Young child⫽1 0.0045 ⫺0.012
(0.0138) (0.0094)
Experience 0.0285** 0.0278** 0.0139** 0.0101** 0.0143** 0.0083**
(0.0021) (0.0017) (0.0019) (0.0014) (0.0037) (0.0018)
Experience squared ⫺0.0003** ⫺0.0003** ⫺0.0001** ⫺0.0001** ⫺0.0001** ⫺0.0001**
(0.0000) (0.0000) (0.0000) (0.0000) (0.0000) (0.0000)
Ph.D. from top tier institution 0.0348** 0.0272** 0.0376* 0.0249
(0.0097) (0.0090) (0.0148) (0.0130)
Ph.D. from second tier institution 0.0056 0.0034 0.0239 ⫺0.0079
(0.0119) (0.0106) (0.0170) (0.0151)
Assistant professor ⫺0.2807** ⫺0.2775** ⫺0.2887** ⫺0.2769**
The
Journal
of
Human
Resources
Table 3(continued)
Model 1 Model 2 Model 3
Variable Male Female Male Female Male Female
Associate professor ⫺0.1634** ⫺0.1727** ⫺0.1762** ⫺0.1771**
(0.0073) (0.0061) (0.0123) (0.0093)
Tenured 0.0367** 0.0437** 0.0174 0.0379*
(0.0088) (0.0068) (0.0201) (0.0154)
Employed at
Top college 0.1156** 0.1086** 0.1842** 0.1720**
(0.0091) (0.0073) (0.0158) (0.0121)
Top university 0.0442** 0.0453** 0.0539** 0.0655**
(0.0074) (0.0069) (0.0112) (0.0127)
Private institution ⫺0.0544** ⫺0.0346** 0.0022 0.0280**
(0.0062) (0.0054) (0.0092) (0.0080)
Liberal arts college ⫺0.1204** ⫺0.1495** ⫺0.1710** ⫺0.2043**
(0.0217) (0.0167) (0.0385) (0.0266)
University 0.0061 ⫺0.0177 0.0112 ⫺0.0343
(0.0209) (0.0168) (0.0365) (0.0267)
Government support 0.0220** 0.0442** 0.0096 0.0340**
(0.0067) (0.0062) (0.0109) (0.0104)
Primary activity
Teaching ⫺0.0160 ⫺0.0311** ⫺0.0303* ⫺0.0315*
(0.0092) (0.0081) (0.0144) (0.0127)
Management 0.1190** 0.1149** 0.1355** 0.1490**
(0.0129) (0.0110) (0.0200) (0.0176)
Other ⫺0.0352* ⫺0.0100 ⫺0.0598 0.0085
Ginther
and
Hayes
45
Publications
Articles 0.0013 0.0043*
(0.0028) (0.0019)
Books 0.0033** 0.0102*
(0.0010) (0.0042)
Chapters in books 0.0202** 0.0155**
(0.0036) (0.0034)
Reviews ⫺0.0026 ⫺0.0007
(0.0019) (0.0014)
No publications ⫺0.0205 ⫺0.0086
(0.0128) (0.0076)
Field of study
History 0.0282* ⫺0.0098 0.0329** ⫺0.0068 0.0191 ⫺0.0247
(0.0137) (0.0125) (0.0112) (0.0099) (0.0174) (0.0166)
Performing arts ⫺0.0017 ⫺0.0164 ⫺0.0022 ⫺0.0186* ⫺0.0339* ⫺0.0378**
(0.0129) (0.0115) (0.0103) (0.0089) (0.0167) (0.0146)
Philosophy ⫺0.0080 ⫺0.0290* 0.0207 ⫺0.0015 ⫺0.0310 ⫺0.0176
(0.0159) (0.0129) (0.0138) (0.0103) (0.0248) (0.0161)
English ⫺0.0313** ⫺0.0470** ⫺0.0080 ⫺0.0309** ⫺0.0208 ⫺0.0438**
(0.0120) (0.0115) (0.0096) (0.0090) (0.0136) (0.0147)
Languages ⫺0.0362** ⫺0.0511** ⫺0.0119 ⫺0.0339** ⫺0.0297* ⫺0.0495**
(0.0112) (0.0110) (0.0091) (0.0085) (0.0135) (0.0145)
Intercept 10.1367** 10.3082** 10.5214** 10.7461** 10.6827** 10.8173**
(0.0936) (0.0731) (0.0866) (0.0649) (0.1648) (0.1320)
Additional controls
Ph.D. cohorts Yes Yes Yes Yes Yes Yes
Survey year Yes Yes Yes Yes Yes Yes
Sample size 13,668 21,618 13,668 21,618 4,707 7,655
R-squared 0.37 0.434 0.5 0.566 0.451 0.521
a Standard errors in parentheses clustered on individual. ** indicates statistically significant at the 1 percent level; * indicates statistically significant at the 5 percent
of the individual.11However, the baseline specification omits important factors that contribute to salary differences such as the quality of doctorate and employer, vari-ables that proxy for productivity such as primary work activity and government sup-port, and variables that are affected by productivity such as rank and tenure status; these factors are influenced by the preferences and performance of individuals. Model 2 includes controls for the Carnegie ranking of the doctoral institution and employer, academic rank, employer type, government support, and primary work activity because they have a significant impact on salaries. In addition, some impor-tant variables are not included in every survey year such as fertility, marital status, and productivity. Model 3 includes these variables, allowing us to evaluate the effect of these demographic characteristics and productivity on the gender salary structure. This model is estimated using those years of the survey that contain all of these variables (1989–95).
We will compare coefficient estimates across specifications in Table 3 to highlight gender differences in the salary structure. Coefficient estimates for demographic characteristics including age, race, and experience are remarkably similar for men and women across the three models and have the expected signs. When additional variables are added in Models 2 and 3 we continue to see little difference in coeffi-cient estimates. If there are gender differences in these estimates, they are small in magnitude. Both men and women earn less in the lower ranks and earn more after reporting tenure. However the tenure premium is higher for women once productivity is incorporated in Model 3. In Model 2, women gain significantly by working at a top college; once productivity is included in Model 3, working at a top college or university improves the salaries of both men and women by similar amounts. In Model 2, men have a 5 percent salary penalty for working at a private institution while the penalty for women is 3.5 percent. When productivity is incorporated in the model, the private institution penalty reverses itself for women, who earn 3 percent more, and is not significantly different from zero for men. Both men and women earn less at liberal arts colleges; however, the penalty is 3 percent larger for women. Women’s salaries increase more than men’s when they receive government support. Primarily working as a teacher lowers the salaries of men and women by equal amounts in Model 3, while women earn slightly more when working in man-agement.
Model 3 includes controls for marriage, children, and productivity. The coeffi-cients on marriage and children are not statistically significant for either men or women. The coefficients on the productivity variables are positive, statistically sig-nificant, small in magnitude, and quite similar for men and women. Women have slightly larger coefficients on articles and books, while men have a larger coefficient on chapters in books. The estimates presented in Table 3 indicate small differences in the salary structure by gender. Adding controls for academic rank and the Carnegie ranking of the doctorate and employer have similar effects on salary by gender. Productivity has a similar impact on the salaries of both men and women. In the
Ginther and Hayes 47
next section the analysis considers changes in the gender salary differential over time.
B. Estimates of the Changes in the Gender Salary Gap over Time
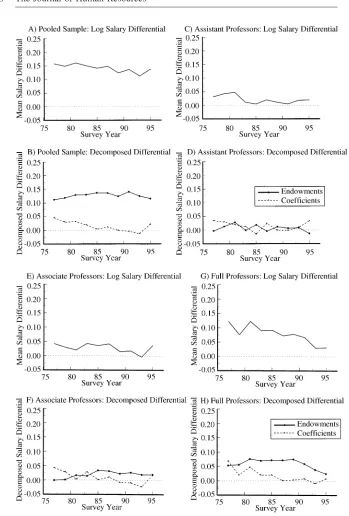
Previous research shows significant changes in the gender earnings differential in academia over time (Ransom and Megdal 1993). We examine these salary differen-tials by estimating separate models for each survey year using the salary decomposi-tion in Equadecomposi-tion 1 to examine trends in the salary differential over time. We use the specification given in Model 2 and add controls for children and marital status in the years they are available.12The average salary gap, along with the salary decompo-sition weighted by male and female coefficients and standard errors are reported in Table A4 in Appendix 2. The salary gap and decomposition are also adjusted using survey weights because weighted mean endowments are significantly different from unweighted mean endowments. The weights also account for differences in the sam-pling frame over time.13In order to examine the changes in the average gender salary differential over time, estimates for each survey year are plotted in Figures 1A through 1H.
The top graphs in Figure 1 plot the average gender salary differential over time. The bottom graphs plot the corresponding salary decomposition weighted by the male coefficients. The underlying models for Figures 1A and 1B include dummy variables for academic rank. In 1997, men employed with tenure or on the tenure track earned 15.7 percent more on average than similarly employed women. This salary differential decreased to a low of 11.3 percent in 1993 and increased to 13.7 percent in 1995. Figure 1B shows the salary decomposition as a function of endow-ments (differences in average characteristics) and coefficients (often interpreted as discrimination). Between 1977 and 1995, most of the gender salary gap can be ex-plained by differences in endowments. After 1991, differences in coefficients become negative, favoring women relative to men and decreasing the observed gender salary gap.
Previous research by Ginther and Hayes (1999) has shown that the majority of the gender salary gap in 1993 disappears when separate salary regressions are esti-mated for each academic rank. We replicate those estimates for each year in the cross-sectional samples in order to examine whether the gender salary gap may be explained by differences in endowments captured by rank. These results are pre-sented in Figures 1C through 1H. Figures 1C and 1D show the gender salary gap and corresponding Oaxaca decomposition for assistant professors. The salary gap
12. The specification used is similar to Model 2 in Table 3. The natural logarithm of real wages is regressed on a constant, age in the survey year, a quadratic in work experience since Ph.D., and dummies for field of study, African American, other race, doctorate quality, employer quality, employer type, primary work activity, and government support. Variables for number of children and an indicator for children under six are included in the years available. The text indicates whether rank is controlled for using dummy variables or whether models have been estimated separately by rank. Productivity is not included because the data are missing from four of the nine survey years.
Figure 1
Ginther and Hayes 49
decreased from more than 15 percent in 1977 for the estimates that pool rank in Figure 1A to a high of only 5 percent for assistant professors in Figure 1C. The gender salary gap for assistant professors is not significantly different from zero by 1995. The salary decomposition in Figure 1D shows that, in 1977, the entire salary gap is explained by differences in coefficients. By 1995, differences in coefficients remain but are no longer statistically significant.
Similar results are apparent for associate professors in Figures 1E and 1F. In 1977, male associate professors earned 4 percent more in salary than their female counter-parts. By 1995, male associate professors earned a 3.6 percent salary premium over their female counterparts; however, this estimate is not statistically significant at the 5 percent level. Prior to 1985, differences in coefficients favoring male associate professors explain a significant portion of the gender gap. After 1985, differences in coefficients are not significantly different from zero. Thus, the small gender salary gap between male and female associate professors is explained by differences in endowments.
Figures 1G and 1H show the gender salary gap for full professors. The salary gap for full professors is larger over time than for the lower academic ranks. In 1977, male full professors earned a 12.2 percent salary premium over female full profes-sors. By 1995, this gap fell to 3 percent and was not statistically significant. The decomposed salary differential in Figure 1H shows the decreasing effect of coeffi-cients on the gender salary differential over time. After 1985, the coefficoeffi-cients become small and are not statistically significant. Male full professors have higher average endowments, explaining 2–7 percent of the gender salary differential from 1985 to 1995.14
Similar to previous results reported in Ginther and Hayes (1999), most of the gender salary differential over time is explained by academic rank. The salary differ-ences reported in Figures 1C through 1H indicate that the gender salary gap was not large at the beginning of the survey for assistant and associate professors. In 1995, the gender salary differential is not significantly different from zero for all ranks. Thus, on average, if gender discrimination exists for academics in the humani-ties it is not operating through salaries. We now consider another source of gender difference in academic employment outcomes.
C. Estimates of the Probability of Promotion to Tenure
The importance of rank in explaining the gender salary gap leads us to examine whether differences in the probability and duration of promotion exist by gender. We begin by estimating probit models of the probability of being promoted to tenure using the full Longitudinal Sample. Our basic specification is similar to that in Model 3 of Table 3 because we assume the variables that affect salaries will also affect promotion. There are some differences in the specification: variables for Ph.D. insti-tution are omitted because preliminary estimates show these variables are not statisti-cally significant in promotion models. We add variables to control for number of
employers, and the proportion of time unranked, unemployed, and in nonacademic jobs because these variables are likely to have a significant impact on promotion and they allow us to control for breaks in service.15
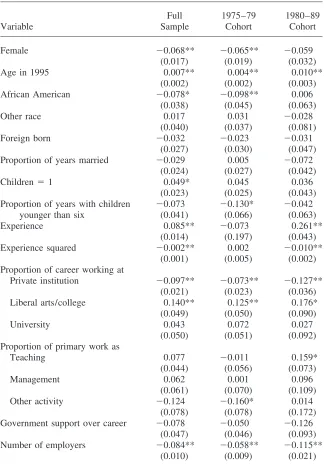
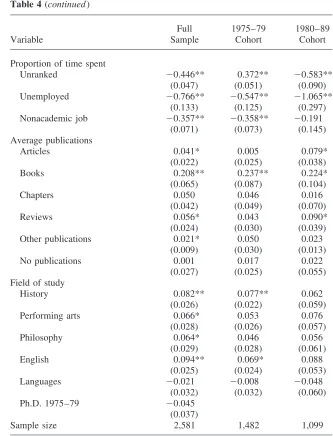
These estimates are presented in column one of Table 4. Being African American, working at a private institution, having many employers, being unranked or unem-ployed, or having nonacademic jobs have a negative and significant effect on the probability of being promoted. Being older with more experience, having children, working at a liberal arts college, publishing articles, reviews, books, and other publi-cations over one’s career have positive and significant effects on the probability of being promoted. Finally, being female decreases the probability of being promoted by almost 7 percent, a result that is significant at the 1 percent level.
The remaining columns of Table 4 show how the probability of promotion changes for the 1975–79 and 1980–89 cohorts. We examine differences across cohorts cause market conditions for humanities doctorates have changed significantly be-tween 1975 and 1995—over time employment opportunities for humanities doc-torates have diminished. The Modern Language Association has conducted eight surveys of Ph.D. granting institutions between 1977 and 1994. During that time, the number of new English Ph.D.s fell by 15 percent while the unemployment rate for new Ph.D.s increased from 7 to 11 percent. In 1994, new foreign language Ph.D.s have an unemployment rate of 10 percent up from a 3 percent rate in 1986 (Modern Language Association 1998).
In the cohort analysis of Table 4, our results show significant changes in the factors affecting promotion across cohorts. Publications are more important for promotion in the most recent cohort. Having young children decreases the probability of promo-tion in the 1975–79 cohort but has a smaller and insignificant effect in the most recent cohort. Experience has a large positive effect on promotion in the most recent cohort, while having a negative and insignificant effect in the earlier cohort. Primarily working as a teacher increases the probability of promotion for the most recent co-hort. The penalty for number of employers, unranked, and time spent unemployed is larger in the most recent cohort. The importance of these variables in the most recent cohort most likely reflects the changing market conditions for humanities doctorates. As competition for permanent jobs has increased, labor market attach-ment and productivity have increased in importance.
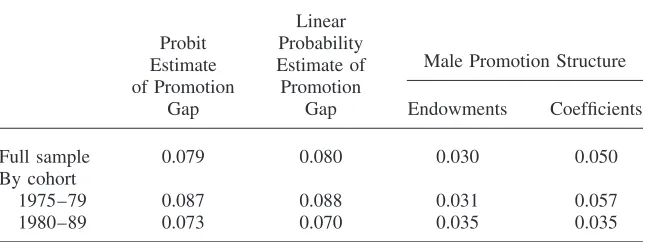
Table 5 reports the estimated probability of promotion by gender. The first column of Table 5 reports the difference in the predicted promotion probability between males and females in the full sample and by cohort, using the probit estimates. The promotion gap is 8 percent in favor of men in the full sample. This gap is as high as 8.7 percent in favor of men in the 1975–79 cohort and decreases to 7.3 percent in the 1980–89 cohort. The second column in Table 5 reports the linear probability estimates using the same empirical specification given in Table 4. These estimates
Ginther and Hayes 51
Table 4
Probit Estimates of Probability of Promotion, 1977–95 Survey of Doctorate Recipients, Longitudinal Samplea
Full 1975–79 1980–89
Variable Sample Cohort Cohort
Female ⫺0.068** ⫺0.065** ⫺0.059
(0.017) (0.019) (0.032)
Age in 1995 0.007** 0.004** 0.010**
(0.002) (0.002) (0.003)
African American ⫺0.078* ⫺0.098** 0.006
(0.038) (0.045) (0.063)
Other race 0.017 0.031 ⫺0.028
(0.040) (0.037) (0.081)
Foreign born ⫺0.032 ⫺0.023 ⫺0.031
(0.027) (0.030) (0.047)
Proportion of years married ⫺0.029 0.005 ⫺0.072
(0.024) (0.027) (0.042)
Children⫽1 0.049* 0.045 0.036
(0.023) (0.025) (0.043)
Proportion of years with children ⫺0.073 ⫺0.130* ⫺0.042
younger than six (0.041) (0.066) (0.063)
Experience 0.085** ⫺0.073 0.261**
(0.014) (0.197) (0.043)
Experience squared ⫺0.002** 0.002 ⫺0.010**
(0.001) (0.005) (0.002)
Proportion of career working at
Private institution ⫺0.097** ⫺0.073** ⫺0.127**
(0.021) (0.023) (0.036)
Liberal arts/college 0.140** 0.125** 0.176*
(0.049) (0.050) (0.090)
University 0.043 0.072 0.027
(0.050) (0.051) (0.092)
Proportion of primary work as
Teaching 0.077 ⫺0.011 0.159*
(0.044) (0.056) (0.073)
Management 0.062 0.001 0.096
(0.061) (0.070) (0.109)
Other activity ⫺0.124 ⫺0.160* 0.014
(0.078) (0.078) (0.172)
Government support over career ⫺0.078 ⫺0.050 ⫺0.126
(0.047) (0.046) (0.093)
Number of employers ⫺0.084** ⫺0.058** ⫺0.115**
Table 4(continued)
Full 1975–79 1980–89
Variable Sample Cohort Cohort
Proportion of time spent
Unranked ⫺0.446** 0.372** ⫺0.583**
(0.047) (0.051) (0.090)
Unemployed ⫺0.766** ⫺0.547** ⫺1.065**
(0.133) (0.125) (0.297)
Nonacademic job ⫺0.357** ⫺0.358** ⫺0.191
(0.071) (0.073) (0.145)
Average publications
Articles 0.041* 0.005 0.079*
(0.022) (0.025) (0.038)
Books 0.208** 0.237** 0.224*
(0.065) (0.087) (0.104)
Chapters 0.050 0.046 0.016
(0.042) (0.049) (0.070)
Reviews 0.056* 0.043 0.090*
(0.024) (0.030) (0.039)
Other publications 0.021* 0.050 0.023
(0.009) (0.030) (0.013)
No publications 0.001 0.017 0.022
(0.027) (0.025) (0.055)
Field of study
History 0.082** 0.077** 0.062
(0.026) (0.022) (0.059)
Performing arts 0.066* 0.053 0.076
(0.028) (0.026) (0.057)
Philosophy 0.064* 0.046 0.056
(0.029) (0.028) (0.061)
English 0.094** 0.069* 0.088
(0.025) (0.024) (0.053)
Languages ⫺0.021 ⫺0.008 ⫺0.048
(0.032) (0.032) (0.060)
Ph.D. 1975–79 ⫺0.045
(0.037)
Sample size 2,581 1,482 1,099
a Coefficients standardized to report a change in probability for a small change in continuous and a unit
Ginther and Hayes 53
Table 5
Salary Decomposition of Predicted Linear Probability of Promotion, 1977–95 Survey of Doctorate Recipients, Longitudinal Samplea
Linear Probit Probability
Male Promotion Structure Estimate Estimate of
of Promotion Promotion
Gap Gap Endowments Coefficients
Full sample 0.079 0.080 0.030 0.050
By cohort
1975–79 0.087 0.088 0.031 0.057
1980–89 0.073 0.070 0.035 0.035
aProbit and linear probability estimates of the promotion gap are based on the specification in Table 4.
are quite similar to the probit estimates and can be decomposed using Equation 1. These results appear in the remaining columns of Table 5. Using the male promotion structure, differences in coefficients explain the majority of the gender promotion gap, providing some evidence that gender discrimination in the humanities may be operating through the mechanism of promotion. The effect of gender falls by almost 2 percent between the earlier and later cohorts. However, the analysis in Tables 4 and 5 indicates that differences in the probability of promotion by gender remain.
D. Estimates of the Duration of Promotion to Tenure
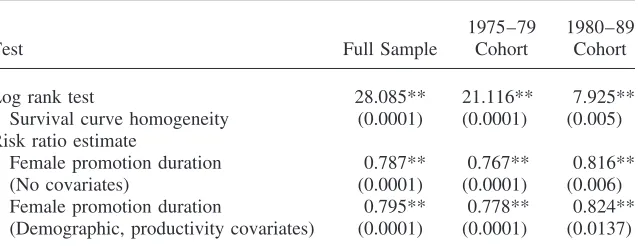
Given the importance of promotion as a mechanism for unequal treatment, we now consider whether differences in the hazard rate of promotion exist by gender. We continue to use the full longitudinal sample and the two cohorts for our duration analysis. We take an initial look at gender differences in the hazard of promotion using two hypothesis tests in Table 6. Our analysis begins with an estimate of the empirical survival functions for men and women working full-time in academia. The first row of Table 6 presents the test statistics for the log-rank test on the Kaplan-Meier survival curve estimate. We reject the null hypothesis that the survival func-tions are the same for men and women at less than a 1 percent level of significance for the full sample, the 1975–79, and 1980–89 cohorts. Thus, without controlling for covariates, the hazard of not being promoted differs by gender.
Table 6
Estimates Comparing Survival and Hazard of Promotion by Gender, 1977–95 Survey of Doctorate Recipients, Longitudinal Samplea
1975–79 1980–89
Test Full Sample Cohort Cohort
Log rank test 28.085** 21.116** 7.925**
Survival curve homogeneity (0.0001) (0.0001) (0.005) Risk ratio estimate
Female promotion duration 0.787** 0.767** 0.816**
(No covariates) (0.0001) (0.0001) (0.006)
Female promotion duration 0.795** 0.778** 0.824**
(Demographic, productivity covariates) (0.0001) (0.0001) (0.0137)
a Probability values in parentheses. ** indicates statistically significant at the 1 percent level; * indicates
statistically significant at the 5 percent level.
estimates improve somewhat for women in the most recent cohort: the female hazard is 82 percent of the male hazard.
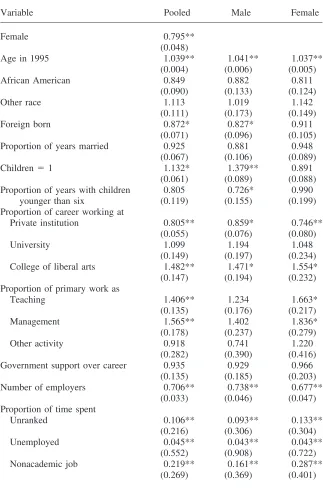
The above estimates do not account for differences in academic field, demographic and employer characteristics, and productivity. We use the same specification in Table 4 in order to examine the differences between men and women in the duration to promotion to tenure in Table 7.16The first model in Table 7 pools both genders and includes controls for demographic characteristics, marital status, children, employer characteristics, primary work activity, and average productivity. In the pooled model, age, children, working at a college, primary work as a teacher, and average number of books and chapters published have positive and significant effects on being pro-moted. Foreign born, years married, employment at a private institution, number of employers, having unranked positions, and being unemployed or employed in a nonacademic job decrease the hazard of promotion. The risk ratio on gender is less than one and significant, indicating that in any given year the female chance of promotion is 20 percent lower than that of their male colleagues after controlling for these characteristics. Controlling for productivity, demographic and employer characteristics only reduces the gender difference in promotion by just over 1 per-cent.
The second and third models in Table 7 estimate the hazard model separately for men and women. Estimates for the male sample indicate that age, children, college, and other publications have positive and significant effects on the likelihood of pro-motion; while foreign born, young children, private institutions, number of employ-ers, being unranked or unemployed, and having a nonacademic job reduces that
Ginther and Hayes 55
Table 7
Duration of Promotion to Tenure in the Humanities, 1977–95 Survey of Doctorate Recipients, Longitudinal Samplea
Variable Pooled Male Female
Female 0.795**
(0.048)
Age in 1995 1.039** 1.041** 1.037**
(0.004) (0.006) (0.005)
Proportion of years married 0.925 0.881 0.948
(0.067) (0.106) (0.089)
Children⫽1 1.132* 1.379** 0.891
(0.061) (0.089) (0.088)
Proportion of years with children 0.805 0.726* 0.990
younger than six (0.119) (0.155) (0.199)
Proportion of career working at
Private institution 0.805** 0.859* 0.746**
(0.055) (0.076) (0.080)
University 1.099 1.194 1.048
(0.149) (0.197) (0.234)
College of liberal arts 1.482** 1.471* 1.554*
(0.147) (0.194) (0.232)
Government support over career 0.935 0.929 0.966
(0.135) (0.185) (0.203)
Number of employers 0.706** 0.738** 0.677**
Table 7(continued)
Variable Pooled Male Female
Average publications
Articles 1.106 1.093 1.109
(0.055) (0.081) (0.080)
Books 1.482** 1.391 1.873*
(0.156) (0.200) (0.265)
Chapters 1.311** 1.166 1.316
(0.106) (0.153) (0.157)
Reviews 1.064 1.028 1.198*
(0.050) (0.065) (0.091)
Other publications 1.036 1.070* 0.986
(0.025) (0.033) (0.040)
No publications 1.006 1.151 0.907
(0.077) (0.113) (0.107)
Field of study
History 1.055 1.022 0.995
(0.099) (0.149) (0.137)
Performing arts 1.267** 1.154 1.358*
(0.096) (0.146) (0.132)
Philosophy 1.089 1.048 1.114
(0.099) (0.143) (0.149)
English 1.078 1.048 1.098
(0.092) (0.144) (0.121)
Languages 0.932 0.877 0.935
(0.091) (0.142) (0.121)
Ph.D. 1975–79 1.086 1.044 1.130
(0.054) (0.078) (0.078)
Sample size 2,581 1,316 1,265
a Coefficients are exponentiated and reported as Risk Ratios. Standard errors in parentheses. ** indicates
statistically significant at the 1 percent level; * indicates statistically significant at the 5 percent level.
likelihood. Estimates for the female sample differ sharply with few similarities: the coefficients on age, college, and unemployment are similar in magnitude and direc-tion of the effect for both men and women. However, the coefficients have a larger negative effect for women working at a private institution, the number of employers, being unranked, or having a nonacademic job. Women are rewarded relative to men for teaching and management and for publishing books and reviews. Most notably, having children decreases the hazard of promotion for women. These differences in estimated risk ratios indicate that the hazard of female promotion is not proportional to male promotion.
Ginther and Hayes 57
Figure 2
Hazard Rate of Promotion: Humanities Ph.D.s by Gender, Full Sample
and women separately. These results are presented in Figure 2. The hazard of promo-tion is regressed on the covariates in Table 7. Each baseline hazard is evaluated at the average characteristics of men and women in the sample. The estimated hazard function is then smoothed using a nonparametric kernel density estimator given in Allison (1995).
In Figure 2, we again note that the male and female hazard functions are not proportional in the full sample. The peak of the male hazard function occurs at 9.5 years after the completion of the doctorate where men have a 0.19 hazard of being promoted. The peak of the female hazard function occurs a year earlier at 8.5 years after the completion of the doctorate, where women have only a 0.14 hazard of being promoted. Even though the hazard rate peaks a year earlier for women, it lies below the male hazard rate in every year. Differences in the peak of the hazard rate may be a result of differences in the quality of men and women who are promoted. If there is gender discrimination in obtaining a tenure track job, this could lead to women on the tenure track being of higher average quality than men, resulting in a shorter peak duration to promotion.
We can decompose gender differences in promotion as a function of differences in average characteristics and coefficient estimates between men and women in Fig-ure 3. Graph A in FigFig-ure 3 shows the baseline hazard estimated using the average male characteristics and the male and female hazard function coefficients. The solid line in Graph A is the same estimate presented for men in Figure 2. Holding male characteristics constant and using the female coefficients lowers the hazard of male promotion by 0.01 at the peak of the function.
Figure 3
Hazard Rate of Promotion: Humanities Ph.D.s, Full Sample
estimated as a function of average female characteristics. The dashed line in Graph B corresponds to the estimate presented for women in Figure 2. Using the male coefficients to estimate the hazard of female promotion increases the hazard 0.01 at the peak of the function. Thus, using the estimated female coefficients lowers the average male hazard of being promoted while using the male coefficients increases the average female hazard of being promoted.
Finally, we consider whether the same differences in the hazard of promotion are evident for the two cohorts. Estimates of the hazard of promotion to tenure by cohort are presented in Table 8. We can examine the effect of gender after controlling for covariates in each cohort by returning to the bottom row of Table 6. In the 1975– 79 cohort, the female hazard is only 80 percent of the male hazard—a result that is significant at the one percent level. In the most recent cohort, the female hazard improves to 82 percent of the male hazard. Controlling for covariates increases the female hazard of promotion by 1 percent.
Ginther
and
Hayes
59
Table 8
Duration of Promotion to Tenure in the Humanities, 1977–95 Survey of Doctorate Recipients, Longitudinal Cohort Samplesa
1975–79 1975–79 1975–79 1980–89 1980–89 1980–89
Variable Pooled Male Female Pooled Male Female
Female 0.778** 0.824**
(0.063) (0.078)
Age in 1995 1.038** 1.036** 1.039** 1.040** 1.048** 1.035**
(0.005) (0.008) (0.007) (0.006) (0.010) (0.009)
African American 0.771* 0.896 0.658** 1.032 0.832 1.229
(0.114) (0.164) (0.163) (0.149) (0.233) (0.202)
Other race 1.120 0.789 1.388 1.055 1.633 0.702
(0.139) (0.236) (0.178) (0.192) (0.274) (0.287)
Foreign born 0.850 0.823 0.879 0.914 0.832 1.075
(0.089) (0.121) (0.136) (0.119) (0.169) (0.175)
Proportion of years married 0.954 0.889 1.015 0.880 0.874 0.887
(0.089) (0.143) (0.118) (0.103) (0.165) (0.142)
Children⫽1 1.063 1.315* 0.810 1.275* 1.439** 0.974
(0.077) (0.116) (0.112) (0.102) (0.148) (0.154)
Proportion of years with children younger than six 0.943 0.830 1.229 0.676** 0.638* 0.830
(0.201) (0.259) (0.347) (0.159) (0.211) (0.263)
Proportion of career working at
Private Institution 0.781** 0.819* 0.748** 0.824* 0.959 0.715**
(0.071) (0.099) (0.108) (0.087) (0.125) (0.129)
University 1.154 1.322 0.999 0.975 0.959 1.215
(0.192) (0.267) (0.287) (0.239) (0.300) (0.426)
College or liberal arts 1.486* 1.417 1.580 1.478 1.420 1.890
The
Journal
of
Human
Resources
Table 8(continued)
1975–79 1975–79 1975–79 1980–89 1980–89 1980–89
Variable Pooled Male Female Pooled Male Female
Proportion of primary work as
Teaching 1.152 0.992 1.464 1.819** 1.666 1.991*
(0.187) (0.243) (0.299) (0.200) (0.268) (0.322)
Management 1.413 1.158 1.851 1.555 1.915 1.317
(0.233) (0.311) (0.368) (0.288) (0.392) (0.455)
Other activity 0.710 0.443 1.159 1.956 1.983 2.019
(0.345) (0.482) (0.510) (0.523) (0.728) (0.780)
Government support over career 0.855 0.739 1.077 1.100 1.396 1.032
(0.167) (0.235) (0.253) (0.231) (0.317) (0.359)
Number of employers 0.734** 0.756** 0.715** 0.645** 0.697** 0.584**
(0.039) (0.056) (0.057) (0.061) (0.086) (0.091)
Proportion of time spent
Unranked 0.085** 0.077** 0.090** 0.127** 0.092** 0.188**
(0.294) (0.413) (0.423) (0.331) (0.481) (0.458)
Unemployed 0.049** 0.053** 0.037** 0.017** 0.008** 0.043*
(0.647) (1.062) (0.861) (1.083) (1.901) (1.357)
Nonacademic job 0.147** 0.116** 0.174** 0.414* 0.249* 0.815
(0.341) (0.464) (0.510) (0.451) (0.645) (0.691)
Productivity
Articles 1.116 1.045 1.128 1.176* 1.111 1.441*
Ginther
and
Hayes
61
Books 1.113 0.981 1.368 2.354** 2.388** 2.265
(0.233) (0.319) (0.384) (0.216) (0.264) (0.426)
Chapters 1.446* 1.045 2.326** 1.155 1.170 0.857
(0.152) (0.213) (0.276) (0.149) (0.223) (0.245)
Reviews 1.005 0.995 1.056 1.125* 1.075 1.297*
(0.080) (0.103) (0.143) (0.061) (0.075) (0.119)
Other publications 0.966 0.962 0.941 1.038 1.061 1.005
(0.065) (0.095) (0.093) (0.028) (0.038) (0.045)
No publications 1.125 1.318* 0.983 0.831 0.791 0.859
(0.094) (0.137) (0.135) (0.145) (0.229) (0.199)
Field of Study
History 1.138 1.106 1.069 1.009 0.995 0.904
(0.126) (0.195) (0.173) (0.162) (0.245) (0.234)
Performing arts 1.167 1.019 1.317 1.564** 1.458 1.588*
(0.122) (0.191) (0.165) (0.158) (0.234) (0.228)
Philosophy 1.024 0.961 1.161 1.185 1.128 1.033
(0.123) (0.183) (0.182) (0.170) (0.243) (0.263)
English 1.062 0.966 1.063 1.187 1.183 1.161
(0.116) (0.190) (0.150) (0.155) (0.235) (0.217)
Languages 0.982 0.945 0.937 0.885 0.730 0.937
(0.115) (0.181) (0.155) (0.153) (0.242) (0.204)
Samples size 1,482 750 732 1,099 566 533
a Coefficients are exponentiated and reported as Risk Ratios. Standard errors in parentheses. ** indicates statistically significant at the 1 percent level; * indicates
women and across cohorts. However, children have a positive and significant effect on the promotion of men while having a negative and insignificant effect for women in both cohorts. Young children have a negative and significant effect for men and a negative and insignificant effect for women. Teaching is positive and significant for women in the most recent cohort. In the 1975–79 cohort chapters in books is the only productivity variable that has a positive and significant effect in the pooled and women samples. Having no publications is positive and significant for men in the earliest cohort. Productivity matters more in the most recent cohort, with articles, books, and reviews having a positive and significant effect in the pooled estimates. The increasing importance of productivity is most likely the result of increased com-petition for permanent academic positions in the humanities. The coefficient on arti-cles and reviews is greater in magnitude for women than for men; the coefficient on books is larger for men than for women, and is statistically significant for men. Figure 4 decomposes gender differences in promotion by cohort as a function of differences in average characteristics and coefficient estimates between men and
Figure 4
Ginther and Hayes 63
women. The top row of graphs in Figure 4 shows the baseline hazard estimated using the average male characteristics and the male and female hazard function coef-ficients. Holding male characteristics constant and using the female coefficients low-ers the hazard of male promotion by about 0.02 at the peak of the hazard for each cohort. The bottom row of graphs in Figure 4 shows the baseline hazard estimated using the average female characteristics and the male and female hazard function coefficients. Holding female characteristics constant and using the male coefficients increases the hazard of female promotion by 0.01 at the peak of the hazard for each cohort.
E. Accounting for Gender Differences in Promotion
Although gender salary differences in the humanities are explained by academic rank, significant gender differences in the probability and duration to promotion per-sist and remain unexplained by observable characteristics. If discrimination is a prob-lem for faculty in the humanities, it operates through promotion differences. In order to examine the factors that account for gender differences in promotion, we evaluate differences in the linear probability coefficients and their relative contribution to the explained and unexplained promotion differential in Table 9.17
One potential explanation for gender differences in promotion is women’s prefer-ences for children. Most women are the primary caregivers of children, and these choices could affect productivity and promotion. In both the linear probability and duration models estimates presented in Table 9, coefficient estimates on children and young children differ in sign and significance between men and women; men have positive coefficients while women have negative coefficients. Both men and women have negative coefficients on the proportion of time spent with young chil-dren; however, the coefficient is larger for men. The total effect of children on the promotion probability is obtained by adding these effects together in the explained and unexplained columns of Table 9. 0.8 percent of the 2.9 percent explained promo-tion difference is due to children and young children; at most 4.2 percent of the 5.9 percent unexplained difference (using female coefficients) is due to children. It is also useful to consider the counterfactual where all women are assumed to be childless. We examine this counterfactual by first setting the number of children equal to zero in the female linear probability model and solving for the promotion probability. If all women in the sample had no children, the promotion probability would only increase by one percentage point. In a second approach, the bottom panel of Table 9 compares estimates of the gender difference in promotion for the full sample to gender differences in the promotion probability for all men and women without children. Women without children are 6 percent less likely to be promoted compared with the 8 percent difference for the full sample. Using this approach, children decrease the overall promotion rate of women by at most two percentage points. Although the presence of children reduces the probability and increases the
The
Journal
of
Human
Resources
Table 9
Variables Contributing to the Explained and Unexplained Promotion Differential and the Gender Promotion Difference for All Men and Women without Childrena
Linear Probability
Coefficients Male Coefficients Female Coefficients
Independent Variable Male Female Explained Unexplained Explained Unexplained
Age in 1995 0.004* 0.007** 0.3% 14.8% 0.6% 14.5%
Children⫽1 0.075** ⫺0.008 ⫺1.5% ⫺3.7% 0.2% ⫺5.3%
Young children ⫺0.097 ⫺0.035 0.7% 0.7% 0.2% 1.1%
Experienceb 0.132** 0.078** 0.4%
⫺34.2% 0.3% ⫺34.0%
Proportion private institution ⫺0.029 ⫺0.112** 0.1% ⫺3.2% 0.4% ⫺3.5%
Proportion liberal arts 0.088* 0.119 ⫺0.2% 1.4% ⫺0.3% 1.5%
Number of employers ⫺0.047** ⫺0.092** ⫺0.1% ⫺7.4% ⫺0.2% ⫺7.3%
Average articles 0.061* 0.025 ⫺0.3% ⫺1.2% ⫺0.1% ⫺1.3%
Average books 0.070 0.315** ⫺0.1% 2.2% ⫺0.6% 2.7%
Average chapters ⫺0.043 0.076 0.0% 1.5% 0.0% 1.5%
Ginther
and
Hayes
65
Average other publications 0.030* 0.004 ⫺0.6% ⫺0.6% ⫺0.1% ⫺1.1%
No publications 0.015 ⫺0.012 0.1% ⫺0.4% ⫺0.1% ⫺0.3%
Total effect publications ⫺1.0% 2.8% ⫺1.3% 3.1%
Total differentialc
⫺2.9% ⫺5.0% ⫺2.0% ⫺5.9%
Promotion Difference for All Men and Women without Children
Male Promotion Structure Linear
Probit Probability Endowments Coefficients
Full sample of men and childless women 0.062 0.062 0.021 0.040
Full sample 0.079 0.080 0.030 0.050
duration to promotion for women, it does not entirely explain gender differences in promotion.
Productivity differences provide another explanation for why women are less likely to be promoted. It is widely reported that women publish less than men (Schneider 1998). Estimates in Tables 2 and 9 allow us to examine the effect of productivity differences on promotion. When we examine average productivity in Table 2, differences between men and women are small at best. Men in the sample author on average more books, reviews, and other publications, but the average dif-ference never exceeds 0.2. In addition, the duration and linear probability coefficient estimates in Table 9 are larger for women relative to men. Women’s promotion probabilities are enhanced relative to men’s for each book, chapter, and review pub-lished. Using female coefficients in Table 9, differences in publication add 1.3 per-cent to the explained promotion difference while reducing unexplained differences by 3.1 percent; these effects are smaller if we use the male coefficients. In order to understand the effect of publications on women’s promotion, we set the female promotion probability equal to the male’s and solve for the average number of publi-cations required by women to obtain the same promotion probability as men. Women would have increased productivity on average by more than two standard deviations: they would need to author either 0.34 more books, or 1.2 more chapters, or 0.1 more reviews, or 3.5 more articles each year of their careers in order to have the same promotion probability as men. This said, it is important to keep in mind that publica-tions are measured with error in this study, and coefficient estimates in the linear probability model are biased toward zero for both men and women. Thus, productiv-ity will likely have a larger impact on promotion than indicated in this study. How-ever, our results suggest that the promotion rewards to publishing are higher for women than for men. This outcome may reflect the selection of women onto the tenure track.
Table 9 includes additional variables that significantly contributed to the explained and unexplained gender promotion difference. Age favors women, reducing the un-explained promotion difference by 15 percent. However, experience is the single largest factor contributing 34 percent to the unexplained promotion difference. The male coefficient is almost twice that of the female coefficient.18Women are also penalized relative to men by being employed at private institutions or having a larger number of employers. Using the linear probability coefficients and assuming a count-erfactual of one employer for all women, the promotion gap narrows to 0.02. Thus, women who have more than one employer are penalized in the promotion process. It could be that women spend more time in adjunct positions prior to entering the tenure track; as a result they would have more employers and work experience. However, Table 2 indicates no significant gender differences in years of work experi-ence or number of employers. Women spend slightly more time in unranked posi-tions, an indicator of adjunct status.
The results in Table 9 show that even though women have on average the same years of experience and the same number of employers, they are treated less well
Ginther and Hayes 67
than their male colleagues. Presence of children explains at most 2 percent of the gender promotion difference while differences in productivity have little net effect.
V. Conclusion
In their study of faculty salaries and appointments, the AAUP claims that ‘‘substantial disparities in salary, rank, and tenure between male and female faculty persist’’ (Benjamin 1999). A cursory examination of the data shows a persis-tent salary gap between male and female humanities academics over time. However, our examination of gender salary and promotion differences clarifies this finding and calls some of the AAUP claims into question at least in the humanities.
We examined gender salary differences between 1977 and 1995. By 1995, the average gender salary difference for tenure-track assistant, associate, and full profes-sors is not significantly different from zero. These results stand in stark contrast to gender salary differences in the sciences. A recent study by Ginther (2001) uses the SDR to examine gender salary and promotion differences in the sciences. Ginther finds large salary differences: in all ranks, men earn more on average than women. This difference is especially pronounced for full professors; female full professors in the sciences earned 14 percent less than their male colleagues in 1995.
Why have women in the humanities fared better than women in the sciences? First, there are more women in the humanities. In 1995, 32 percent of humanities academics with tenure or on the tenure track were women, while women continue to be underrepresented in the sciences (Ingram and Brown 1997). It could be that by achieving a critical mass in the humanities, women have also achieved earnings parity with their male colleagues. This explanation is substantiated by the decrease in the humanities gender salary gap over time while the number of women has in-creased. Second, academics in the humanities earn less than academics in the sci-ences. Thus, it costs less to pay men and women the same in the humanities. Al-though the gender salary gap in the humanities is negligible in 1995, the large gender salary disparities reported by the AAUP are most likely the result of grouping all academic ranks and fields together. Men are more likely to have a higher rank and to work in the sciences—both factors that contribute to the gender salary gap.
Given the importance of academic rank in salary determination, we examined gender salary differences in the probability and duration to promotion. Our results are consistent with the AAUP’s findings. We found small and persistent differences. Probit and duration model estimates indicate that women are less likely to be pro-moted and take longer to be propro-moted than men. Separate analysis by cohort shows a slight decline in the gender promotion gap over time. These gender promotion differences are somewhat larger than those reported for academics in the sciences. Thus, if gender discrimination is a significant problem for academics in the humani-ties, it operates through the mechanism of promotion, which in turn has a direct effect on salaries.