Email: [email protected]
Research Article
Application of chemometrics in combination with Fourier Transform Mid
Infrared spectroscopy for authentication of avocado oil
Fajar A. Lumakso
a, Sugeng Riyanto
a, Shahrel Ahmad Shuhel Ahmad
b, Arieff Salleh Rosman
b,
Farahwahida Mohd. Yusoff
b. and Abdul Rohman
a,b,c*,aDepartment of Pharmaceutical Chemistry, Faculty of Pharmacy, Universitas Gadjah Mada, Yogyakarta 55281, Indonesia bCentre of Research for Fiqh Science and Technology (CFIRST), Universiti Teknologi Malaysia, Skudai, Malaysia.
cResearch Center of Halal Products, Universitas Gadjah Mada, Yogyakarta 55281, Indonesia
ARTICLE INFO ABSTRACT
Received 20/02/2015 Received in revised form 05/03/2015
Accepted 25/03/2015 Available online 01/4/2015
This recent study was carried out to develop a rapid, simple, and accurate analytical method for authenticity determination of avocado oil (AO). Fourier transform-mid infrared (FT-MIR) spectroscopy technique aided with Partial Least Square (PLS) were optimized for that purpose to binary mixtures of AO with grapeseed oil (GO) and sesame oil (SeO). The calibration models were constructed at following selected MIR region with normal spectra treatment at combination 1006-902; 1191-1091; and 1755-1654 cm-1 (GO in binary mixture with AO) and 4000-650 cm-1 for analysis of SeO in binary mixture with AO. The high value of coefficient of determination (R2) of 0.9994 with low root mean square error of calibration (RMSEC) value of 0.86 %v/v was revealed in GO quantification. Meanwhile, R2 of 0.9997 with RMSEC 0.73 %v/v were obtained for analysis of SeO in binary with AO. The given value of root mean square error of pprediction (RMSEP) during model validation were 0.52 %v/v (GO) and 0.53 %v/v (SeO), respectively. The high value of R2 and low value of RMSEC and RMSEP during calibration and validation were associated with the accuracy and precision of the used method.
Keywords: avocado oil, FT-MIR spectroscopy, authentication, partial least square.
1. Introduction
Avocado belongs to the member of Lauraceae family having commercially important in the industry of fats and oils (Litz et al, 2007). Avocado is one of the valuable fruits due to the rich contents of nutrients such as proteins and dietary fibers. Moreover, avocado fruit contains some components, namely fat especially monosaturated fatty acid, water, protein, essential minerals and some lipid soluble vitamins, mainly vitamin A and vitamin E (Ozdemir and Topuz, 2004; Prasetyowati, 2010). The avocado fruit is oval with green to purple color, depending to the cultivar. The seed was round with brownish color, with 2.5-5 cm in diameter.
The pulp is yellow and buttery with good smell and taste (Steenis, 2002). The oil content of its pulp is about 8-30% depending on the cultivar and the origin (Takenaga et al, 2008).
The authenticity determination of high price oils is an interesting issue related to the consumer health and financial aspects. It becomes more serious when non halal matter such as lard is added in edible fats and oils (Rohman, and Che Man, 2012). The adulteration using adulterants which have similar chemical composition with that of target oil increases the difficulty of detection (Aparicio et al, 2007). Several analytical methods have been developed and employed for the detection and quantification of such adulterants. Most of these are based upon the separation of the components such as gas and liquid chromatography. The other analytical methods reported for authenticity study include nuclear maggnetic resonance (Sacchi et al, 1997), Differential Scanning Calorimetry (Marina et al, 2009), electronic nose (Marina et al, 2010), and
Fourier transform infrared spectroscopy using attenuataed total reflectance (FTIR-ATR) can be taken into account as method of choice for the authentication purpose due to its sensitivity, simplicity and rapidity (Rohman and Che Man, 2009). This method makes possible to use the small quantity of sample, minimal or no sample preparation is required prior to analysis, and can be applied to any physical state (solid, gels, liquid even gas) of samples. This technique is also claimed as green analytical method since there is no requirement of using hazardous solvent and no chemical waste released into the environment (Nurrulhidayah et al, 2011). The combination of FTIR-ATR with multivariate analysis allows someone to obtain spesific information either qualitative or quantitative about different parameters simultaneously in a direct, reliable, and rapid way (Gallardo-Vellazquez et al, 2009).
The combination of FTIR spectroscopy and multivariate calibration of partial least square (PLS) calibration has been successfully employed for the detection and quantification of adulterants in certain oils such as olive oil adulterated with palm oil (Rohman and Che Man, 2010), black cumin oil adulterated with grape seed oil, corn oil and soybean oil (Nurrulhidayah
et al, 2011; Rohman and Ariani, 2013), red fruit
adulterated with soybean and corn oil (Setyaningrum et al, 2013), and authentication of extra virgin oil from
some plant oils (Lerma-Garcia et al, 2010). However, there is no available information regarding
the detection and quantification of grapeseed oil (GO)
Avocado oil was extracted from dried avocado pulp powder using cold percolation technique with n -hexane as the extracting solvent. Grapeseed oil and sesame oil were purchased from supermarket in Yogyakarta, Indonesia. For quantitative analysis using PLS calibration, a set of calibration samples containing AO with GO as well as AO and SeO were prepared accurately in proportions of 2-95 %v/v of GO and SeO in AO. The mixtures were shaken vigorously to assure the homogenity. Several independent samples were prepared for predictive capability assessment of the calibration model.
2.2. Instrumentation
FTIR spectra of samples were obtained using ABB 3000 FTIR-ATR spectrophotometer (Canada) with ATR crystal of ZnSe equipped with DTGS as detector, potassium bromide (KBr) as beam splitter and integrated with the HorizonMB 3000 software. The measurement was directly carried out by applicating oil samples on ATR surface at controlled room temperature (25 oC) in mid infrared region (MIR) region of 4000-650 cm-1. These spectra were substracted from reference spectrum of air, acquired by collecting a spectrum from the cleaned blank ATR crystal before the measurement of each oil sample replication. The sample spectra were collected in duplicate and displayed as the average spectra. At the end of every scan, the crystal was cleaned with hexane twice and dried with special soft tissue, cleaned with acetone, and finally dried again with soft tissue following the collection of each spectrum.
2.3. Quantification using PLS calibration
The quantification using PLS were performed using software HorizonMB 3000. The wavenumber region for the quantification was optimized automatically by the software and was confirmed by investigating peaks where variations were observed. PLS calibration model was cross-validated using LOO (leave-one out) technique. This model was further used to predict the level of GO and SeO in binary mixture with AO in the independent samples for evaluating its predictive capability. Preprocessing of spectra included smoothing with Savitzky-Golay methods using 9 windows and order 3 polynomial equation. Autoscaling and centering was applicated automatically by software as preprocessing of data.
3. Results and discussion 3.1 FTIR spectral analysis
fingerprint technique, MIR spectroscopy allows one to distinguish authentic oil and those adulterated with others by observing the spectra changes due to the adulteration (Yap et al, 2007). In fats and oils, most of the peaks and shoulders of the spectrum are attributable to the specific functional groups (Bendini et al, 2007). Triglycerides were the principal components in fats and oils and, consequently, it dominate the spectra of fats and oils (Safar et al, 1994). Fig.1 exhibits MIR spectra of the studied oils at wavenumber region of 4000-650 cm-1. Meanwhile figure 2 illustrates the effect of adulterants in AO spectra changes.
The entire range of spectra looks similar for the three oils. This is due to the similar chemical composition in terms of fatty acids composition. The identification of bands as analytical signal was difficult when the absorption bands were overlapping. Solving this problem, the software was able to select which bands considered as the analytical signal. Peak at 3009
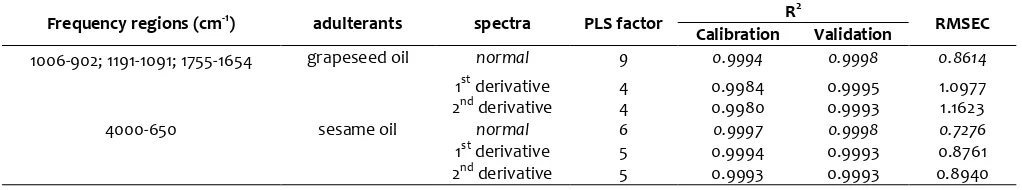
cm-1 is due to stretching vibration of cis C=CH. At 2923 and 2853 cm-1, two sharp peaks present due to the symmetric and asymmetric stretching vibration from the methylene (-CH2-) group. The sharp peak with high intensity at 1744 cm-1 showed the presence of carbonyl functional group (ester linkage of triacylglycerol). The stretching vibration of cis -C=C contributed in the presence of weak absorption band at 1654 cm-1. The peaks and related functional groups are given in table 1, as depicted in Fig.1.
Taking into account the spectra, one can see that spectrum of AO revealed some differences to
that of GO and SeO, especially at fingerprint region. There are 2 peaks identified at 1009 and 1114cm-1 for AO spectra, and both were not observed in GO and SeO spectra. Both were attributed to C-O stretching vibration. The differences of fatty acids composition of those oils contributed to the revealed different peaks, especially at 975-900 cm-1. Figure 1. FTIR spectra of avocado oil, grapeseed oil and sesame oil scanned in mid infrared region (4000 – 400 cm-1).
Furthermore, no bands were observed for GO and SeO at 1715 cm-1, while AO has absorption bands at 1715 cm-1 due to C=O ester stretching vibration of free fatty acid. Absorption of -OH from β-cytosterol at 3468 cm-1 in AO spectra was not present in GO and SeO. These frequency regions can be exploited for the quatification either GO or SeO in mixtures with AO.
3.2 Quantification using PLS
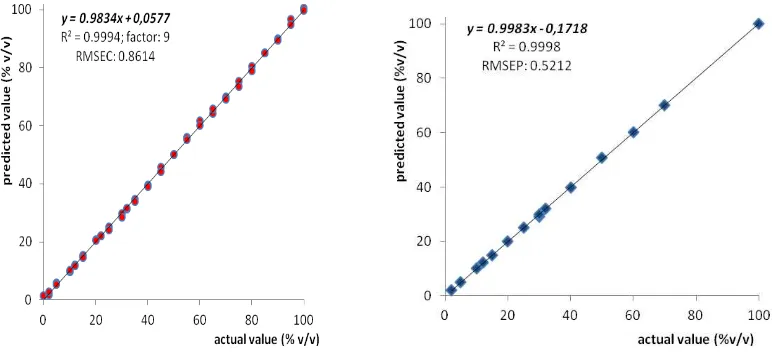
For quantification using PLS, the samples were divided into the calibration and validation sets. The division into sets was done to obtain the similar mean values and standard deviations so that both sets of samples spanned the full range of adulterant contents (Wang et al, 2006). The suitable quantification of GO was done using the combined wavenumbers of 1006-902; 1191-1091; and 1755-1654 cm-1. At this region, the highest value of R2 (0.9994) and the lowest value of RMSEC (0.86 %v/v) was achieved. The high value of coefficient of determination informed that the
predictors are be able to describe 99.94% variation contained in the dependent variables. Meanwhile, the rest about 0.06 % can not be described. The low value of RMSEC suggests the ability of calibration model to explain the relationship between predictors and responses. The lower RMSEC value, the better model was obtained. Table 2 showed the results of optimization process at MIR region.
The risk of using multivariate analysis is overfitting occurence due to incluiding noise to be counted. It occurs when the calibration model offers good R2 and low RMSEC but shows bad performance in predicting the unknown samples. The little change from training set leads to significant difference in result in that case. Further, the validation is required for solving the problem. The R2 of validation of 0.9998 was excellent with RMSEP 0.52 %v/v which was close to the previous RMSEC obtained. According to Rohman and Ariani (2013), that suggests the reproducibility of the method developed. Both are the measure of deviation from
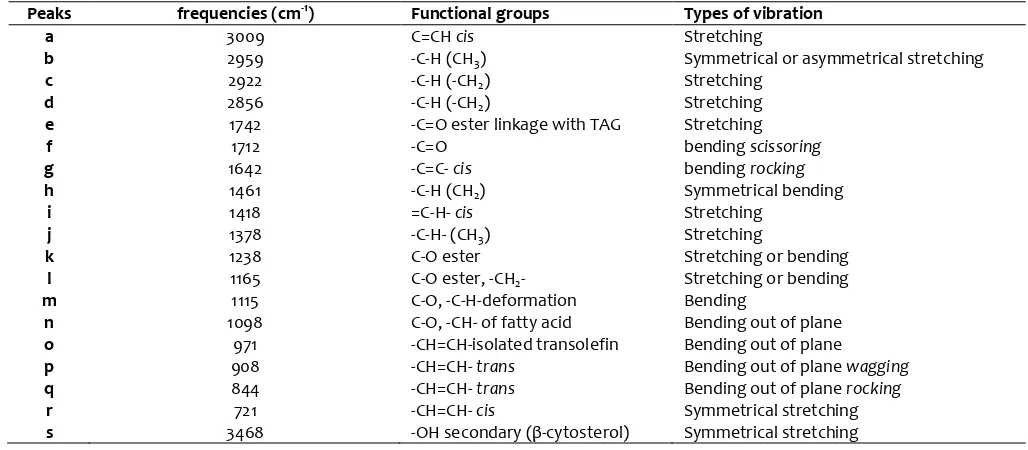
Figure 3. Relationship between actual value and FTIR predicted value of SeO (●: calibration, ♦: validation).
Table 1. Functional groups and types of vibrations in the MIR spectra of AO, GO, and SeO ( Lerma-Garcia et al, 2010; Rohman and Ariani, 2013; dos Santos et al, 2014).
Peaks frequencies (cm-1) Functional groups Types of vibration
a 3009 C=CH cis Stretching
b 2959 -C-H (CH3) Symmetrical or asymmetrical stretching
c 2922 -C-H (-CH2) Stretching
d 2856 -C-H (-CH2) Stretching
e 1742 -C=O ester linkage with TAG Stretching
f 1712 -C=O bending scissoring
g 1642 -C=C- cis bending rocking
h 1461 -C-H (CH2) Symmetrical bending
i 1418 =C-H- cis Stretching
j 1378 -C-H- (CH3) Stretching
k 1238 C-O ester Stretching or bending
l 1165 C-O ester, -CH2- Stretching or bending
m 1115 C-O, -C-H-deformation Bending
n 1098 C-O, -CH- of fatty acid Bending out of plane
o 971 -CH=CH-isolated transolefin Bending out of plane
p 908 -CH=CH- trans Bending out of plane wagging
q 844 -CH=CH- trans Bending out of plane rocking
r 721 -CH=CH- cis Symmetrical stretching
observation data point to the best fitting plane in order to give the good linearity. Moreover, the closeness between RMSEC and RMSEP indicated the accuracy and robustness of the model. Therefore, the model has the good performance to predict the concentration of unknown samples. quantification. Meanwhile, in the calibration model for SeO, six factors well explained the variability and built the model. Those were the number of optimum value since gave the lowest PRESS value. The PRESS value is direct measure of predictive ability of calibration model during cross-validation (Smith, 2002). The PLS calibration was further used to predict the independent samples. The values of R2 of 0.9998 with RMSEP value of 0.53 %v/v were considered as goodness of fit of the developed quantification model. The PLS appears to have a reasonable ability to estimate the SeO percentage in binary mixture with AO, based on the high R2 and low error. Universitas Gadjah Mada Indonesia for providing the funding to support this research awarded to Prof. Sugeng Riyanto and Dr. Abdul Rohman. The authors also and to Integrated Research and Testing Laboratory of Universitas Gadjah Mada (LPPT-UGM) for providing the reagents and instruments to make this study possible.
6. References
Aida, A.A., Che Man, Y.B., Raha, A.R. and Son, R. 2007. Detection of pig derivatives in food products for halal authentication by polymerase chain reaction–restriction fragment length polymorphism. Journal of the Science of Food and
Agriculture 87: 569–572.
Aparicio, R., Aparicio-Ruiz, R., & Garzia-Gonzalez, D.L., 2007. Rapid methods for testing of oil authencity: the case of olive oil. In Rapid methods
for food & feed quality determination, ed. A. van
Amerongen, D., Barug, and M. Lauwaars, pp.117-118, Wageningen Academic Publisher, The Netherlands.
Berger, A., Jones P., & Abumweis, S., 2004 Plant sterols: factors affecting their efficacy and safety as functional food ingredients. Lipids in Heallth and Disease, 3(1): 5-9.
Gallardo-Velazquez, T., Osorio-Revilla, G., Zuniga-de Loa, M., & Rivera-Espinoza, Y., 2009. Application of FTIR-HATR spectroscopy and multivariate analysis to quantification of adulterants in Mexican honeys. Food Research International, 42: 313-18.
Lerma-Garcia, M.J., Ramis-Ramos, G., Herrero-Martinez, J.M., and Simo-Alfonso, E.F., 2010, Authentication of extra-virgin olive oil using infrared spectroscopy, Food Chemistry. 53:95-98.
Litz, R. E., Raharjo, S.H. T., & Gómez-Lim, M. A., 2007. Avocado. In V. E. C. Pua, & M. R. Davey (Eds.), Biotechnology in Agriculture and Forestry. Springer-Verlag, Berlin.
Marina, A.M., Che Man, Y.B., Nazimah, S.A.H., & Ismail, A., 2009. Monitoring the adulteration of virgin coconut oil by selected vegetable oils using differential scanning calorimetry. Journal of Food Lipids. 16: 50–61.
Marina, A.M., Che Man, Y.B. and Ismail, A., 2010. Use of the SAW sensor electronic nose for detecting the adulteration of virgin coconut oil with RBD palm kernel olein. Journal of the American Oil
Chemists’ Society. 87: 263–270.
Table 2. PLS performances for determination of GO and SeO in binary mixture with AO (The bolded figures were the selected region and treatment)
Frequency regions (cm-1) adulterants spectra PLS factor R
2
RMSEC
Calibration Validation
1006-902; 1191-1091; 1755-1654 grapeseed oil normal 9 0.9994 0.9998 0.8614
1st derivative 4 0.9984 0.9995 1.0977 2nd derivative 4 0.9980 0.9993 1.1623
4000-650 sesame oil normal 6 0.9997 0.9998 0.7276
authentication of Nigella sativa seed oil, Spectroscopy. 25:243-50
Ozdemir, F., & Topuz, A., 2004. Changes in dry matter, oil content and fatty acids composition of avocado during harvesting time and post-harvesting ripening period. Food Chemistry. 86: 79– 83.
Prasetyowati, Pratiwi, R., and Fera, T.O., 2010. Pengambilan Minyak Biji Alpukat (Persea americana
Mill) dengan Metode Ekstraksi. Jurnal Teknik Kimia. 2(17): 16-24.
Quiñones-Islas, N., Ofelia Gabriela Meza-Márquez, Guillermo Osorio-Revilla, Tzayhrí Gallardo-Velazquez., 2013. Detection of adulterants in avocado oil by Mid-FTIR spectroscopy and multivariate analysis. Food Research International. 51: 148-154.
Requejo, A.M., Ortega, R.M., Robles, F., Navia, B., Faci, M. & Aparicio, A., 2003. Influence of nutrition on cognitive function in a group of elderly, independently living people. European Journal of Clinical Nutrition. 57: S54-S57.
Rohman, A., & Che Man, Y.B., 2010. Fourier transform infrared (FTIR) spectroscopy for analysis
Fourier transform infrared spectroscopy for authentication of functional food oils. Applied Spectroscopy Reviews. 47(1): 1-13.
Rohman, A., and Ariani, R., 2013. Authentication of Nigella sativa seed oil in Binary ang ternary mixtures with corn oil and soybean oil using FTIR spectroscopy coupled with Patial Least Square, The Scientific World Journal. 2013.
Sacchi, R., Addeo, F., & Paolillo, L., 1997. 1H and 13-C NMR of virgin olive oil. An overview. Magnetic Resonance in Chemistry. 35: S133-S145.
Setyaningrum, D.L., Riyanto, S., and Rohman, A., 2013, Analysis of corn and soybean oils in red fruit oil using FTIR spectroscopy in combination with partial least square. International Food Research Journal. 20(4): 1977-81.
Steenis, C.G.G.J., 2002. Flora. PT. Pradnya Paramita, Jakarta.
Takenaga, F., Matsuyama, K., Abe, S., Torri, Y., & Itoh, S., 2008. Lipid and fatty acid composition of mesocarp and seed of avocado fruits harvested at Northern range in Japan. Journal of Oleo Science.