ARMA (Autoregressive Moving Average) Model for
Prediction of Rainfall in Regency of Semarang - Central
Java - Republic of Indonesia
Adi Nugroho1, Bistok Hasiholan Simanjuntak2
1
Faculty of Information Technology, Satya Wacana Christian University
Salatiga, Central Java, Republic of Indonesia
2
Faculty of Agriculture and Business, Satya Wacana Christian University
Salatiga, Central Java, Republic of Indonesia
Abstract
Water is the main factor in determining the success of the activities of food crops, horticulture, and plantation. The main source of the water for agriculture and plantation comes from rainfall. This condition also occurs in regency of Semarang, Central Java, Indonesia. Therefore rainfall prediction will play an important role in the success of the activities. Univariate time series model of ARMA (Autoregressive Moving Average) can be used to predict it in the future. Data used in the study are taken on a monthly basis during the period from 2001 to 2013. The results showed that the prediction is quite accurate using method of ARMA in the study area.
Keywords: Rainfall Prediction, ARMA, Univariate Time Series
1 Introduction
Indonesia is tropical country. It has high enough
rainfall because its islands are surrounded by a vast
ocean which has a fairly high daily temperature and
humidity [8][10]. Currently, there are about 40.6
million hectares of agricultural and plantations areas
in this country [10] which mostly rely on the
availability of water depend on rainfall. In this
regard, the western and northeastern part of Indonesia
derived from volcanic activity. Agricultural or
plantation can be done as long as there is enough
water coming from rainfall [7][9].
The regency of Semarang – Central Java (area of the
study) is located on the island of Java, western part of
Indonesia (Figure 1). It is 6 º, 5 ' - 7 º, 10' South
Latitude and 110 º, 34 ' - 110 º, 35' East Longitude
with a total area of 37,366,838 hectares,
approximately 373.7 km2 [7].
Agriculture and plantation are the main sector that
supports the economy of the regency. In general, the
rainfall follows two kinds of seasons, a dry (April to
September) and a rainy season (October to March)
[8]. The study try to predict the monthly rainfall in
the next one year (2014) based on data of the rainfall
taken along 13 years earlier (2001-2013). The
ARMA model is used to predict of seasonal and
repeated rainfall because the data is stationary.
2.
Techniques of Prediction Using
ARMA Method
Time series is basically a measurement data taken in
chronological order within a certain time [4]. The
ARMA (Autoregressive Moving Average) method is
used in this study is because the characteristic of each
cascading is stationary (has a mean and constant
variance also covariance lag that does not depend on
where the calculation is done) [2]. The method is
also called the Box-Jenkins method as developed by
George Box and Gwilym Jenkins in 1976 [4].
The ARMA model consists of two parts, an
autoregressive (AR) part and a moving average (MA)
part. AR model can be written as follows [5].
… ԑ
… (1)
While the MA models can be written as follows [5].
ԑ ԑ … ԑ ԑ
coefficients of MA model.
, , , … , are constants and
coefficients of AR model
An ARMA model requires stationary value. The
stationary can be tested using the ADF test
(Augmented Dickey Fuller) with this pattern [1][3].
∑ ԑ … (3)
is used to determine whether or not the
roots of the unit (unit root) with the
following hypothesis.
H0 : θ = 0 (the data contain unit roots) (not
stationary).
H1 : θ < 0 (the data do not contain unit
roots) (stationary).
p is the lag in the autoregressive process.
ԑ is the magnitude of the error or often referred to as white noise which is assumed
yt-1 and constant variance of σ2 or equal to 0
[4].
Table 1. ACF and PACF Pattern [5]
ACF PACF ARIMA
(p, 0, q)
Tend to zero after lag q.
Tend to zero after lag p.
In practice, the ARMA is often treated as an ARIMA
(Autoregressive Integrated Moving Average) with no
need for differencing process because the data is
stationary. In other words , the ARMA model can be
written as ARIMA (p, d, q ) which is more common
where p is the order of the autoregressive process, q
is the order of the moving average process, and d is
the differentiation process in the case of ARMA is 0,
so ARMA models are often written as ARIMA (p , 0
, q).
In this case, the values of p and q can be
predicted using plots values of ACF
(Autocorrelation Factor) and PACF (Partial
Autocorrelation Factor) as shown in Table 1 . ACF
and this PACF is defined as follows [6].
∑ … (4)
Where yk is the observed value, y is the mean, k is
the number of parameters, and n is the number of
times of observation. Whereas, the PACF is defined
as the following equation [4].
, ) … (5)
A prediction should be tested and evaluated to assess
its feasibility. In this paper, to assess the feasibility of
a predictive model, the calculation used AIC
(Aikake's Information Criterion), which is defined
using the following equation [6].
... (7)
Where and SSE =
Where yk is the observed value, y is the mean, k is
the number of parameters, and n is the number of
times of observation. In this case, it can be stated that
the smaller the AIC value calculation, meaning a
model that is taken is the best model [6].
After we got optimal values of p and q, then do linear
regression (OLS-Ordinary Least Square). We can get
the values of a and b in equation (1) and (2). Next,
find a model that can represent the ARMA time
series observation, with the functions, we predict it.
However, it also should be tested its accuracy. The
best way to evaluate the accuracy of forecasting is to
draw a graphic the results of observation values with
the values of the results of forecasting or,
mathematically, the model can also be evaluated by
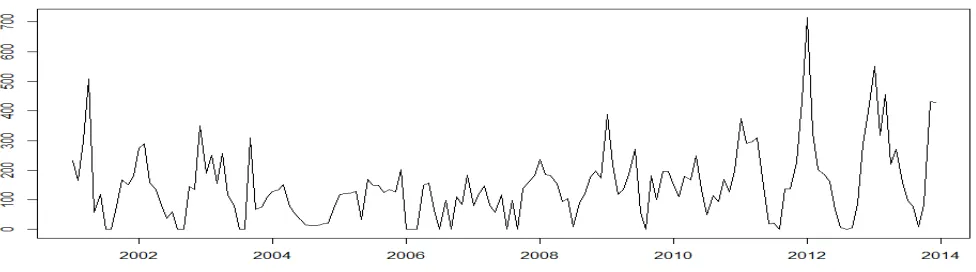
Figure 2. Plot of Rainfall in Semarang Regency
Figure 3. Plot of ACF
Calculate MAE (Mean Absolute Error).
∑ | |
… (8)
Calculate MAPE (Mean Absolute Percentage Error).
∑ | |∗ % … (9)
Where μ is mean in point-to-t and a good model will
have a value of MAE and MAPE as small as possible
(less than or equal to 10 %) [3] .
3. Research and Discussion
Plot of rainfall in figure 2 is the original data plot in
the Semarang regency which shows relatively
stationary data. It has same deviation along it. This is
supported by the calculation of ADF as -7.3585,
which is indicated rainfall time series in Semarang
regency doesn’t have unit root. It is concluded to be
stationary. In this case, because the data is stationary
so ARIMA model (p, 0 , q) can be used. Next step is
how to find the value of p and q by pay attention to
the ACF and PACF plot and consider to AIC value.
Figure 3. Plot of ACF
Figure 4. Plot of PACF
Table 2. AIC calculations for the combination of ARIMA (p, d, q)
Model AIC
ACF and PACF plots in Figure 3 and Figure 4, based
on Table 1, indicating the possibility that ARIMA
models (6, 0, 3) is the best model for the p-value can
be approximated by PACF plots intersecting
horizontal line on the 6th lag and the value of q ACF plot can be approximated by horizontal lines
intersecting at the 3rd lag. However, to be sure, we need to do calculations AIC for models nearby. The
AIC calculations are shown in Table 2 above, where
these calculations (values shaded) consistent with the
ACF and PACF plots that provide a signal that the
ARIMA model (6, 0, 3) is the best model.
Based on the ARIMA model (6, 0, 3) , the calculation
of linear regression (OLS-Ordinary Least Square),
ARMA function is obtained as follows.
. . .
. .
. .
. ԑ . ԑ
. ԑ
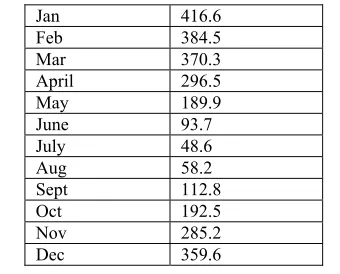
Table 3. Value Rainfall Prediction for 2014
Jan 416.6
Furthermore, using the ARMA function above, we
can perform forecasting precipitation values in 2014
were the results as shown in Table 3. For the record,
the predicted values have a value of MAE 19.45714
and MAPE 9.581951 % , so it can be said that the
ARIMA model (6, 0 ,3) has a fairly good accuracy
(MAE relatively small and MAPE less than 10%) .
Generally, forecasting rainfall in the study area are
also in accordance with the recognized pattern 2
seasons, namely summer (April to September) and a
rainy season (October to March).
4 Conclusion
Based on the research results several conclusions can
be drawn as follows.
On the basis of the monthly precipitation patterns in 2001 - 2013, visual observation
of the ACF and PACF plots and calculation
of the AIC, the rainfall in the district of
Semarang has ARIMA models (6, 0, 3).
Based on the Box - Jenkins method of ARMA, then using monthly rainfall data in
2001 - 2013 in Semarang Regency
prediction can be done monthly rainfall for
the area in question in 2014.
Based on the form and function of the ARMA, MAE and MAPE values are good
enough then ARMA model has fairly good
accuracy for prediction of rainfall the
following year (2014).
The results of forecasting using ARMA model will be very useful for agricultural
planning and/or estate in Semarang district
that outlines rely on the water needs water
from rainfall in the area concerned.
References
[1] Cowpertwait, Paul S.P., Andrew V. Metcalfe, Introductory Time Series with R, New York : Springer Science+Business Media , Inc. ., 2009.
[3] Joshua, “Analysis of Vector Autoregression (VAR) The Interrelationship Between GDP Growth and Employment Growth ( Case Study : Indonesia Year 1977 to 2006)”, MS Thesis, Department of Mathematics, University of Indonesia, Jakarta, Republic of Indonesia, 2007.
[4] Lutkepohl, Helmut, New Introduction to Multiple Time Series Analysis, Berlin:Springer Science + Business Media, Inc., 2005.
[5] Sadeq, Ahmad, “Stock Value Prediction with ARIMA Model”, MS Thesis, Department of Management, University of Diponegoro, Semarang, Indonesia, 2008. [6] Schumway, Robert H., David S. Stoffer, 2011, Time Series Analysis and Its Application, New York : Springer Science +Business Media, Inc., 2011.
[7] Geography, topography, and geology Semarang District. http://www.semarangkab.go.id/utama/selayang-pandang/kondisi-umum/geografi-topografi.html. Retrieved July 10, 2013.
[8] Dry season and the rainy season in Indonesia. http://www.bmkg.go.id. Retrieved July 11, 2013.
[9] Site Agricultural Research and Development-Department of Agriculture, Republic of Indonesia. http://bbsdlp.litbang.deptan.go.id/tamp_komoditas.php . Retrieved July 20, 2013.
[10] The area of farms and plantations in Indonesia. http://indonesia.go.id/en/potential/natural-resources. Retrieved July 25, 2013.
Adi Nugroho earned a Bachelor of Engineering (ST) of
Geological Engineering - Institute of Technology Bandung
(ITB) in Republic of Indonesia in 1993. He also earned a
Masters in Management Information Systems from the
Gunadarma University in Jakarta, Republic of Indonesia, in
2002. Currently he is trying to complete his doctoral studies
in Computer Science at the PhD Program, Gadjah Mada
University in Republic of Indonesia and a career as a
lecturer in the Faculty of Information Technology – Satya
Wacana Christian University, in Salatiga, Central Java,
Republic of Indonesia.
Bistok Hasiholan Simanjuntak earned a Bachelor of
Engineering (Ir) of the Faculty of Agriculture – Satya
Wacana Christian University in Salatiga, Republic of
Indonesia, in 1989. Master's degree (Master of Science)
degree in Soil Science obtained from Bogor Agricultural
University in Republic of Indonesia (1997) and his PhD in
Soil Science is obtained from Brawijaya University in
Malang, Republic of Indonesia (2007) . Currently he is a
faculty member in the College of Agriculture and Business –
Satya Wacana Christian University in Salatiga, Central
Java, Republic of Indonesia. Areas of expertise and areas of
![Table 1. ACF and PACF Pattern [5]](https://thumb-ap.123doks.com/thumbv2/123dok/1123997.651495/3.612.66.296.134.289/table-acf-pacf-pattern.webp)