A nalyzing L and C onversion
in S outh E ast Minahasa, Indonesia, under L andsat
Satellite Image D ata using the S upervised
C lassification Method
E ko Sediyono, Gregorius A nung Hanindito
Master of Information S ystemSatyawacana C hristian University Salatiga, Indonesia
eko@ staff.uksw.edu, gregory.anung@ gmail.com
A di Setiawan
D ept. of Science and Math Satyawacana C hristian UniversitySalatiga, Indonesia adi_ setia_ 03@ yahoo.com
A bstract— S outh E ast M inahasa is r ecent r egency located in
the Nor th S ulawesi Pr ovince, I ndonesia. I t is officially announced in 2007 as the expansion of S outh M inahasa R egency. T his ar ea
has a super ior commodity in the plantation sector , especially for coconut plantation. T his study is analyzingthe expansion patter n
of pl antation l and and conversion of for est to plantation in S outh E ast M inahasa, I ndonesia. T he image data ar e tak en fr om
L andsat S atellite fr om the year of 2002, 2007, 2010, and 2014.
T he r esults show that dur ing 2002-2014 ther e ar e for est degr adation tr end in S outh E ast M inahasa; fr om 42.906,25 H a in 2002 to 26.392,87 ha in 2014. I t is hoped that the r esults can give
valuable input for the r elated gover nment in establishing the land
management r egulation i n the upcoming year s.
K eywords— R emote S ensing; land use; land cover; I ndustrial
plantation
I. INT R OD UC T ION
F or many years, Indonesia has struggled with land management cases which impacted on deforestation. One of many crucial causes of deforestation in Indonesia is the plantation and agricultural land expansion on the forest area. T he expansion cannot be conducted on the conservation forest [ 1]. T his similar expansion problem also occurs in S outh E ast Minahasa R egency, Indonesia
South E ast Minahasa is one of the recent municipalities in North Sulawesi Province as the expansion result of South Minahasa R egency. R atahan is chosen as the capital city. On May 23rd, 2007, the ad interim Minister of Internal S tate A ffairs officially announced the S outh E ast Minahasa R egency with several other cities and municipalities such as K otamobagu C ity, South B olaang Mongondow R egency, E ast B olaang Mongondow R egency and S itaroe R egency [ 2] . T his R egency has been established under the L aw of R epublic Indonesia No. 9 of 2007 [3].
S outh E ast Minahasa is one of the potential municipalities, especially for its plantation field. Its specialized sector is the coconut plantation. T he provided data records that this R egency produced 37.687 tons of coconut in 2011 [4].
T herefore, to ensure the geographic observation in the concerned area, image data processing is performed by L andsat satellite using remote sensing method. T he remote sensing image is the primary focus in the spatial analysis about the plantation land conversion in S outh E ast Minahasa.
T he purpose of this study is to monitor the conversion of forest into plantation land and to observe the dissemination pattern of plantation land in South E ast Minahasa. It is conducted by analyzing the land use and land cover change during 2002 - 2014 using four samples L andsat image data in 2002, 2007, 2010, and 2014. T he result of this study can be used by the Government to monitor and control the dissemination pattern of plantation land in S outh E ast Minahasa.
II. ST UD Y AR E A
South E ast Minahasa R egency is located in 124°32”56’ E ast L ongitude - 124°57”3’ E ast L ongitude and 0°50”28’ North L ongitude - 1°7”17’ North L atitude, with the total area is 730.62 km2. T he topography of most parts in this R egency is mountain range area [5]. South E ast Minahasa has great potential in developing the plantation products, with coconut plant as the primary commodity.
T his study focuses on the dissemination pattern and comparison of the plantation land during 2002-2014. T he administrative location is on S outh E ast Minahasa R egency T his R egency is situated on the south of North Sulawesi Province which is directly on the verge of Maluku Ocean.
III. LA ND USE A ND LA ND COV E R CHA NGE
T he land use is any human activity that can influence the dissemination pattern of the land cover [7]. A nother definition states that the land use is the human purpose in land utilization, whereas the land cover refers to the biophysical attributes of the earth surface that can be directly monitored by aerial photographs and satellite sensor [ 8] . F rom the definitions, it can be concluded that the land use and the land cover are closely related. T he land use will affect the land cover change.
T he observation detection about the land use and land cover change can be conducted by remote sensing. It provides more detail information in monitoring the land use and the
Geographic information system and remote sensing is one of the methods that can be used in doing the observation of the land use and land cover. S everal steps that have been done in detecting the land use and land cover change are data acquisition, image classification, and post-classification comparison. In the analysis process, the map comparison is conducted by overlaying two analyzed maps [ 11] .
T his study is performed by several steps. T he first step is image classification of remote sensing. T his classification employs the supervised classification method using a maximum likelihood technique which converts the pixel values of an image into the land cover class.
T he next step is the analysis of the forest conversion to the plantation. T he intersection technique is performed by comparing the forest with the plantation land. T he intersection technique is used to find out the conversion pattern of the forest to the plantation land within certain periods.
IV . SA T E L L IT E IMA GE CL A S S IF IC A T ION ME T HOD
Image classification is a process to determine the image pixel into certain classes. It is performed by collecting some identical pixel group and converting into certain classes in accordance with the information categories by the users [12] . R emote sensing presents two types of classification methods,
namely supervised classification and unsupervised
classification [13] .
Unsupervised classification is an identification of certain pixel group in a multispectral image without information class gained by the users [ 13] . T here are some disadvantages to using the unsupervised classification method, such as the result of the classification may not correspond with the information in the real classes, the users have limited control for the class chosen through the classification process, and the relationship between the spectral class and information class are not always related [ 14] .
Supervised classification is a classification process using the training site based on the information class identified by the users. T he training site are used to classify the pixel that its
identity is still unknown into a certain class [13]. T here are some advantages to using the supervised classification method: the users have full control in determining the training site, the classification results are more specific, and the users does not face difficulties in matching the image class [ 14] . B ased on those particular reasons, this study applies the supervised classification method as it aims to gain the accurate level of the image classification result. and the analysis process of the land use and land cover will be more difficult. T able 1 shows the data characteristic in this data used in this study have only less than 10% cloud cover.
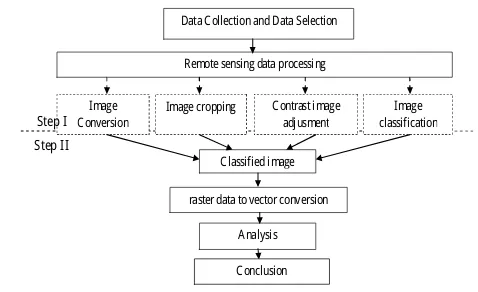
B. Research D esign classified image. D ata are collected from L andsat satellite and selected by considering the cloud cover percentage. T he remote sensing data process consists of four stages: image conversion, image cropping, contrast image adjustment, and image classification. T he spatial resolution in each data is 30 meters explains that each real area that covers 30x30 m2 is represented by one pixel in the satellite image.
T he supervised classification method is used in the image classification. It requires sufficient information of the Study area to gain the expectedclasses of the land cover class group [ 16] . T he information about the area study is converted into training site made into digits based on the interpretation result of the satellite image which accuracy has been assured through interpreting both aerial image and survey [17] .
T he supervised classification method applies the maximum likelihood concept based on the probability that each pixel of the satellite image represents a certain class on the real condition [ 16] . Generally, the maximum likelihood is formulated on 1, 2, 3, 4, and 5 formulas, in which an X pixel is a pixel vector value which is grouped into k class if the probability X in k class is the biggest compared to the probability in the other classes [17] .
L ( X ) = Max { L 1( X ) , L 2(X ) ,…, L K ( X ) } (1)
with L (X ) is the probability of X to be k class with the following calculation:
with dk 2
is Mahalanobis distance which is formulated as follows:
X = pixel vector value for X = ( X1, X2, X3,… ., Xn) t
,
k = class for ( k =1, 2, 3, … , K ) ,
N = total of canal data,
Mk = average vector for k class which is calculated as
follows:
(4)
m = total of training site for k class,
Xki = pixel vector value for the – i th of k class of training
site,
CK = matrix covariant of k class which is formulated as
follows:
A t the second step, the conversion of raster to vector image and the analysis process through intersection technique are performed to gain the forest to plantation land conversion and the dissemination pattern of plantation land. Intersection technique is one of the GIS techniques to analyzing the intersection between two different vectors. T his technique can
be used in land use and land cover change analysis [ 18] . T he observationusing the intersection technique will result on the dissemination pattern of the analyzed land cover [ 19] . In this study, the analysis is performed in the following images:
1. T he forest land cover image in 2002 with the plantation land use image in 2007
2. T he forest land cover image in 2007 with the plantation land use image in 2010.
3. T he forest land cover image in 2010 with the plantation land use image in 2014.
4. T he forest land cover image in 2002 with the plantation land use image in 2014.
T he intersections between the images are conducted using the intersection technique and it results on the analysis of the land use and land cover change in the area of South E ast Minahasa.
V I. RE SUL T A ND DIS C USS ION
A. L andsat Satellite Image D ata Processing
T his study utilizes four images data observation from L andsat satellite with a spatial resolution of 30 meters. T he L andsat S atellite image data processing results on the classified images.
1) C lassification
T he image classification is performed by identifying each image pixel into a certain type of class using the aerial picture reference and direct observation on the field. A s has been explained earlier, the classification process in this study is done using the supervised classification technique applying the maximum likelihood concept which emphasizes on the probability level of pixel x on a certain point to be in the k class. A n image on a certain coordinate with an x pixel will be classified based on the real appearance both on direct observation and aerial picture. T hrough the observation, the x value pixel will be transformed into a certain k class.
In multispectral image, there are a number of canals known as band. On the satellite image, each band has a different pixel value for each coordinate point. T he combination of each band will give a different coloring level on each image. T he illustration of pixel value on the image band can be seen in T able 2.
T A B L E II. THE PR OB A B IL IT Y LE V E L OF T HE SA MPL E DA T A
In T able 2, 10 samples of coordinate points are randomly taken. T he pixel value of band 3 and band 5 from those samples of coordinate points are different. T he Max Lk(X ) in
the table refers to the probability of the pixel value of a point to be in the certain class. However, each L1(X ) and L2(X )
clarifies the probability level of the pixel value of a point to be in the 1st class or the 2nd class. In addition, the biggest probability of the pixel value to be in the certain class is shown by looking for the biggest probability pixel value of a coordinate toward the available classes. On the provided data samples, coordinates number 1 until 5 have a tendency to be classified into the 1st class, with the probability of L1( X ).
Meanwhile, coordinatesnumber 6 until 10 have a tendency to be classified into the 2nd class, with the probability of L2(X ).
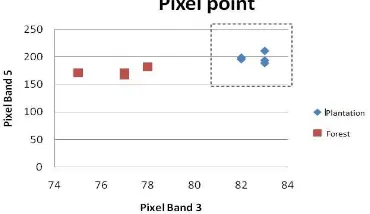
F ig. 2 shows several coordinate points that are randomly taken on the appearance of the plantation land and forest with the different pixel density of band 3 and band 5. T hose pixel values are transformed into several certain classes through the probability process of the biggest chance as explained earlier.
T he classification method of maximum likelihood is applied in each pixel in the L andsat images of South E ast Minahasa in 2002, 2007, 2010, and 2014 in order to obtain classified images based on the certain class using the E R Mapper software. T his process results on the information about the tendency of decreasing vegetation forest as the impact of plantation land extension. T he result can be seen in F ig. 4.
F ig. 2. Probability of Maximum L ikelihood C lassification
F ig. 3. T he C lassification Image Observation R esult
F ig. 3 shows the classification image on the study area using the supervised classification method with the maximum likelihood concept. T he dark green color represents the vegetation forest, whereas the light green color represents the plantation land. F ig. 3 explains that the plantation area extends and the vegetation forest narrows within 2002-2014.
2) Analysis of F orest to P lantation L and C onversion
a) The intersection process: the forest image in 2002 and the plantation land image in 2007 T he forest image in 2002 intersects with the plantation land image in 2007. It aims to obtain the conversion pattern of the plantation land toward the forest area as drawn in the following F ig. 4.
F ig 4 explains that there is an extension area of the plantation land within the period of 2002-2007. T he area with light green color refers to the land cover of the plantation land, whereas the area with dark green color refers to the land cover of the forest and the area with red color refers to the conversion pattern of the forest into the plantation land within the period of 2002-2007.
F ig. 4. T he C onversion of L and C over in 2002-2007
b) The intersection process: the forest area in 2007 and the plantation area in 2010
F ig. 5. T he C onversion of L and C over in 2007-2010
F ig. 5 show the pattern of the land cover conversion of the forest to the plantation land in 2007-2010. T he area with dark green color refers to the forest, whereas the area with light green color refers to the plantation land and the area with red color refers to the analysis result of the forest conversion into the plantation land during 2007-2010.
c) The intersection process: the forest area in 2010 and the plantation area in 2014
T his intersection process uses the forest image in 2010 and the plantation land image in 2014.
F ig. 6 show the pattern of the land cover conversion of the forest land into the plantation land in 2010-2014. T he area with dark green color refers to the forest, whereas the area with light green color refers to the plantation land and the area with red color refers to the analysis result of the forest conversion into the plantation land since 2010-2014.
F ig. 6. T he C onversion of L and C over in 2010-2014
d) The intersection process: the forest area in 2002 and the plantation area in 2014
.
T his intersection process aims to obtain the conversion pattern of the forest into the plantation land within the period of 2002 – 2014 as seen in F ig. 7.
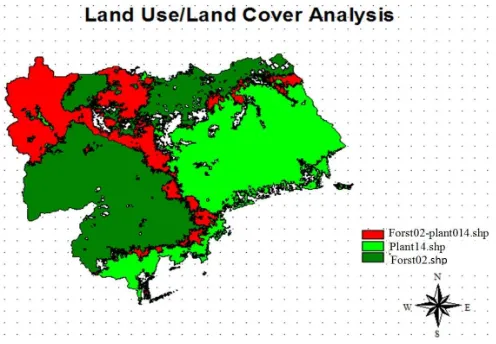
F ig. 7. T he C onversion of L and C over in 2002-2014
F ig. 7 shows the pattern of the land cover conversion of the forest land into the plantation land in 2002-2014. T he dark green color refers to the land cover of the forest, whereas the light green color refers to the land cover of the plantation land and the red color refers to the conversion pattern of the forest into the plantation land since 2002-2014.
3) Analysis in Graph
T he comparison size between the forest and the plantation land is shown in a graph which illustrates the expansion pattern of the plantation land toward the vegetation forest.
F ig. 8. F orest and the Plantation L and C omparison
4) D iscussion between two classes that intersect each other. T he intersection of those two classes forms the conversion area of the cover land that occurs in a certain period.
It can be seen in this study that the extension pattern of the plantation land in South E ast Minahasa R egency increased within the period of 2002 – 2014. T he analysis result of the L andsat image shows that the plantation land cover in 2002 was around 34.95% from the total area in S outh E ast Minahasa R egency. However, it dramatically increased into 53.43% in 2014. It was inversely proportional with the condition of the forest land cover in that area. W ithin the period of 2002 – 2014, the condition of the forest land cover kept decreasing. T he result of this study shows that the forest area in 2002 was 58.61% in South E ast Minahasa R egency, whereas in 2014 the forest area was left for only 36.06%.
V II. CONC L US ION
T he trend of forest degradation during 2002-2014 in South E ast Minahasa is the key issue in this study; moreover, the condition forest area is inversely with the plantation land area. B ased on this study, a serious attention from the related
R elated to the process of this study, hopefully there will be further studies that perform a deeper analysis which not onl y focus on the forest conversion but also on the other land cover conversions such as the housing complex, agriculture, and other public sectors.
AC K NOW L E D GME NT
T he authors would like to thanks to D irectorate General of Higher E ducation, Indonesia for research funding with scheme of Hibah Pascasarjana No. 001/K 6/K L /SP/PE NE L IT IA N /2015.
RE F E R E NC E S
[ 1] C . P. . Purba, S. G. Nanggara, M. R atriyono, Isnenti, A priani, L . R osalina, N. A . Sari, and A . H. Meridian, T he F igure of Indonesian F orestry. B ogor: F orest W atch Indonesia, 2014.
[ 2] Ministry of home affairs ( K emendagri), “Southeast Minahasa R egency/ K abupaten Minahasa T enggara,” 2011. [ Online] . A vailable:
http://www.kemendagri.go.id/pages/profil- daerah/kabupaten/id/71/name/sulawesi-utara/detail/7107/minahasa-tenggara. [ A ccessed: 04-F eb-2014].
[ 3] Southeast Minahasa district administration (Pemkab Minahasa T enggara), “Geographical of Southeast Minahasa/ Geografis Minahasa T enggara,” 2015. [ Online] . A vailable: http://www.mitrakab.go.id/hal-geografis.html. [ A ccessed: 25-J an-2015] . A nd, and H.-J . S tibig, Global forest land-use change 1990–2005. R ome: F ood and A griculture Organization of the United Nations and E uropean C ommission J oint R esearch C entre, 2012.
[ 9] J . R ogan and D . C hen, “R emote sensing technology for mapping and monitoring land-cover and land-use change,” Prog. Plan., vol. 61, pp. 301–325, 2004.
[ 10] Y . T ian, K . Y in, D . L u, L . Hua, Q. Z hao, and M. W en, “E xamining L and Use and L and C over S patiotemporal C hange and D riving F orces in B eijing from 1978 to 2010,” R emote S ens., vol. 6, pp. 10593–10611, 2014.
[ 11] M. F . Iqbal and I. A . K han, “Spatiotemporal L and Use L and C over change analysis and erosion risk mapping of A zad J ammu and K ashmir, Pakistan,” E gypt. J . R emote S ens. Sp. S ci., vol. 17, pp. 209–229, 2014. [ 12] K . Perumal and R . B haskaran, “Supervised C lassification Performance
Of Multispectral Images,” J . C omput., vol. 2, no. 2, pp. 124–129, 2010. [ 13] S. K . D eb and R . K . Nathr, “No T itle,” Glob. J . R es. E ng. C iv. Struct.
E ng., vol. 12, no. 1, pp. 5–16, 2012.