International Journal of Applied Engineering Research ISSN 0973-4562 Volume 10, Number 13 (2015) pp 33449-33452 © Research India Publications. http://www.ripublication.com
33449
Effect of Gain Changing to Maximum Visualization Depth on Diagnostic
Ultrasound B-Mode Image
Giner Maslebu *1, Kusworo Adi2, and Suryono2
1
Magister Physics Program, Diponegoro University, Semarang
2
Instrumentation and Electronics Laboratory, FSM, Diponegoro University, Semarang *Corresponding author, email: [email protected]
Abstract
The effect of gain to maximum depth of visualization on B-mode ultrasound image has been investigated using computer based image processing. The purpose of this study is to support quality control program using phantom multipurpose multi tissue and multifrequency transducer, Curved Array Transducer CH5-2. Scanning of phantom was done using fixed frequency 2,2 MHz and 3,6 MHz with gain variation of 30 dB, 35 dB, 45 dB, and 50 dB. The data analysis was using global thresholding in segmentation and Euclidean distance to determine maximum depth of visualization. As the gain increase, thus the image is brighter and depth of visualization is deeper. It is because the anechoic cylinder objects are clearly seen on the image. Using the low value of gain, the image is getting darker, thus depth of visualization is getting shallow. Using 2,2, MHz frequency, the smallest value of depth of visualization is 9.97 cm using 30 dB gain and it increased up to 13,2 cm at the highest gain used, 50 dB. Using 3,6 MHz frequency, the smallest value of visualization depth is 10.08 cm using 30 dB gain and it increased up to 13,12 cm at the highest gain used, 50 dB. It is proved that there is influence of gain to visualization depth determination of ultrasound image.
Keywords: gain, depth of visualization, image, B-Mode USG
Introduction
Radiology services unit has a very large role in the diagnosis of a disease. In this field, there are various modalities; one of them is ultrasonography (USG). In the past three decades, ultrasound has been used in almost all medical fields and become major imaging modality in different clinics [1]. Ultrasound with frequencies above 20 MHz developed for skin cancer screening and the use of ultrasound for muscle tissue provide better resolution than magnetic resonance imaging [2,3]. Even in recent years, the use of ultrasound has been widespread in other branches of health services such as physiotherapy, emergency medicine, and Anaesthesiology [4]. Widespread use of ultrasound because it has advantages compared to other modalities, such as relatively cheap, non-invasive, does not use ionizing radiation, and portable [5]. In order to provide maximum service quality, then the quality assurance (Quality Assurance) of ultrasound must be continuously done in a certain time period [6].
QA USG aims to compare the results of visual examination for physical errors, phantom measurements and transducers in
order to establish a QA protocols in the field of radiology imaging. Recent studies for the quality control of ultrasound have shown that the use of a computer for image analysis of ultrasound has advantages or the potential to increase its usefulness. Computer aided can be used for distance measurement and determination of the uniformity of the image on the ultrasound Quality Control [7,8].
International organizations such as the American Association of Physicist in Medicine (AAPM) has recommendations or standards for the measurement of the phantom in the display of adequate image, but often are not included with the adequate techniques of quality control (QC). Determination of visualization depth recommended by AAPM is through manual measurements with a ruler printed on the film image as compared to direct measurement with a calliper from the top of the scan windows with anechoic spherical or cylindrical objects deepest on the ultrasound monitor [9]. It is of course very vulnerable to observer subjectivity in examining ultrasound image.
This study will focus on the analysis of the effect of changing the gain versus visualization depth of ultrasound image, which is expected to provide contributions for QC program to assist in the enforcement of the diagnosis by a physician.
Method
This study used two-dimensional USG, multifrequency transducer, Curved Array Transducer CH5-2, Multi-purpose Multi-tissue Ultrasound Phantom to test the functionality and quality using ultrasound phantom CIRS brand 040GSE models, and computers equipped with software for image processing.
At the time of scanning of the phantom, the transducer surface or phantom Coupling gel must be given, as a energy coupling medium that allows the ultrasonic energy waves to travel freely between the surface of the phantom and the transducer. In this study, the frequency is set at a fixed value of 2.2 MHz and 3.6 MHz, while the gain variation in the value of 30 dB, 35, 45 dB, and 50 dB.
The Graphical User Interface (GUI) for image processing is made in the following order:
1. Reading image from data acquisition on a computer using software developed for image processing. 2. Region of interest (ROI) selection with ultrasound
International Journal of Applied Engineering Research ISSN 0973-4562 Volume 10, Number 13 (2015) pp 33449-33452 © Research India Publications. http://www.ripublication.com
33450 3. Image segmentation to separate the object from the
background image based on intensity. Segmentation of ROI in this study is conducted by global thresholding method.
4. Determination of the maximum visualization depth is determined according to Euclidean distance method, i.e the distance between the surfaces to the deepest phantom object from segmentation results.
Results and Discussion
Anechoic stepped cylinder objects are used for the purpose of determining the depth of visualization in QC program. The sequence of these objects according to the phantom and the results of the scanning of plane B-Mode ultrasound are shown in Figure 1.
Figure 1. The objects in ultrasound phantom, objects (a, b, c, d, e, f) in the red column are original anechoic stepped cylinder from phantom, while the image of the ultrasound scanning, anechoic stepped cylinder are shown the yellow column.
To determine the maximum visualization depth, segmentation is performed for each variation of gain. Differences in intensity of phantom surface to the deepest object due to gain variations affect the election of threshold value in segmentation. Segmentation results of ultrasound object are shown in Figure 2.
a) Region of Interest (ROI)
b) Segmentation of ROI
Figure 2. Image of ROI before and after segmentation
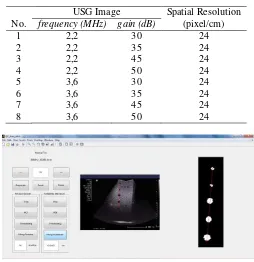
To determine the maximum visualization depth, it is very important to know the spatial resolution of the image. Determination of the depth of visualization is shown in Figure 3. The spatial resolution is an indicator of the number of pixels per unit length [10]. Spatial resolution determination is done by counting the number of pixels that exist between the centre (centroid) of the two nearest objects. The spatial resolution of the calculation result data is shown in Table 1. From these data, spatial resolution has a constant value of 24 pixel/cm.
Table 1. Determination of Spatial Resolution
No.
USG Image Spatial Resolution (pixel/cm) frequency (MHz) gain (dB)
1 2,2 30 24
2 2,2 35 24
3 2,2 45 24
4 2,2 50 24
5 3,6 30 24
6 3,6 35 24
7 3,6 45 24
8 3,6 50 24
International Journal of Applied Engineering Research ISSN 0973-4562 Volume 10, Number 13 (2015) pp 33449-33452 © Research India Publications. http://www.ripublication.com
33451 Pixel coordinate of the phantom’s surface and the deepest object are (400,60) and (380.2, 378.8), respectively. Thus, the number of pixel determined by using Euclidean distance formula:
319,41 pixel
d in pixel unit, and the distance in cm unit is determined using formula:
13,30 cm
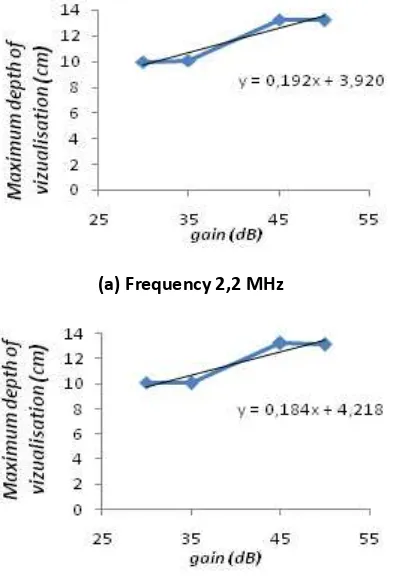
As for the change in gain and its effects on the maximum visualization depth is shown in figure 4.
(a) Frequency 2,2 MHz
(b) Frequency 3,6 MHz
Figure 4. Graph of the effect of gain changing at a fixed frequency of 2.2 MHz and 3.6 MHz to the maximum visualization depth of ultrasound image.
Gain is image brightness level settings so that objects appear clearly on the screen [11]. Thus, the use of gain is very influential in the ultrasonic wave reception signal amplification. The decrease of gain causes the image darker and become less detail, while the increase of gain causes the image brighter so that the gain effect the quality of penetration/visualization of ultrasound image.
From the graph in Figure 4., it shows that as the gain increased, the maximum value of the visualizations depth will tend to increase. At a fixed frequency of 2.2 MHz, maximum visualization depth is 9.97 cm at the lowest gain, 30 dB and increased up to 13.2 cm at the highest gain value used, 60 dB. The same thing happened in the determination of the visualization depth of ultrasound image with a fixed frequency of 3.6 MHz. The visualization depth for gain 35 dB is 10.08 cm, while using 60 dB gain result on 13.12 cm of visualization depth.
Conclusion
From the study, it shows that gain affect the depth of visualization of the ultrasound image. As a result of the increased gain, then the image is getting brighter and visualization depth value becomes greater as anechoic cylinder object on the phantom for QC purposes apparent visualization depth. Instead by using a low gain, objects appear darker on ultrasound images so that the depth of visualization becomes lower. By using fixed frequency of 2.2 MHz, maximum visualizations depth is 9.97 cm for 30 dB of gain and increased up to 13.2 cm for 50 dB of gain. By using fixed frequency of 3.6 MHz, the maximum visualizations depth is 10.08 cm for 30 dB of gain and increase up to 13.12 cm for 50 dB of gain.
Acknowledgements
The author thank the National Hospital (RSN) of Diponegoro University for providing facility during data collection, also for those who have helped in this study.
References
[1] Lewin, A.P., 2004, Quo vadis medical ultrasound?, Ultrasonics 42:1-7.
[2] Jasaitiene, D., Valiukeviciene, S., Linkeviciute, G., Raisutis, R., Jasiuniene, E., dan Kazys, R., 2010, Principles of high-frequency ultrasonography for investigation of skin pathology, Journal of the European Academy of Dermatology and Venereology.
[3] Pillen, S., 2010, Skeletal muscle Ultrasound, European Journal Translational Myology 1 (4): 145-155.
International Journal of Applied Engineering Research ISSN 0973-4562 Volume 10, Number 13 (2015) pp 33449-33452 © Research India Publications. http://www.ripublication.com
33452 [5] Tyovenda, A.A., Aiyohuyin, E.O., dan Akaagerger,
N.B., 2013, Diagnostic Ultrasound Quality Assurance by Means of Machine Output Parameters, International Journal of Science and Technology Vol 3, No.5.
[6] Dudley, N.J., Griffith, K., Houldsworth, G., Holloway, M., dan Dunn, M.A., 2001, A Review of Two Alternative Ultrasound Quality Assurance Programmes, European Journal of Ultrasonografi 12: 233-245.
[7] Fallo, F., Adi, K., dan Suryono, 2014, Perancangan Model Pengukuran Jarak Menggunakan Computer-Aided pada Kontrol Kualitas Ultrasonografi, Berkala Fisika, Hal 13-20.
[8] Sudarsih, K., Budi, W.S., dan Suryono, 2014, Analisis Keseragaman Citra Pada Pesawat Ultrasonografi (USG), Berkala Fisika Vol.17, No.1, Hal 33-38.
[9] Goodsitt, M.M., dan Carson, P.L., 1998, Real-time B-mode ultrasound quality control test procedures, Report of AAPM Ultrasonografi Task Group No.1, Depertement of Radiology, University of Michigan. [10] Aksoy Pelin, dan DeNardis Laura., 2008,
Information Technology in Theory, Thomson Learning, hal. 154.