This ar t icle was dow nloaded by: [ Univer sit as Dian Nuswant or o] , [ Rir ih Dian Prat iw i SE Msi] On: 29 Decem ber 2013, At : 19: 03
Publisher : Rout ledge
I nfor m a Lt d Regist er ed in England and Wales Regist er ed Num ber : 1072954 Regist er ed office: Mor t im er House, 37- 41 Mor t im er St r eet , London W1T 3JH, UK
Accounting and Business Research
Publ icat ion det ail s, incl uding inst ruct ions f or aut hors and subscript ion inf ormat ion:
ht t p: / / www. t andf onl ine. com/ l oi/ rabr20
Earnings management and the distribution of
earnings relative to targets: UK evidence
Pel ham Gore a , Pet er F. Pope a & Ashni K. Singh aa
Lancast er Universit y
Publ ished onl ine: 28 Feb 2012.
To cite this article: Pel ham Gore , Pet er F. Pope & Ashni K. Singh (2007) Earnings management and t he dist ribut ion of earnings rel at ive t o t arget s: UK evidence, Account ing and Business Research, 37: 2, 123-149, DOI: 10. 1080/ 00014788. 2007. 9730065
To link to this article: ht t p: / / dx. doi. org/ 10. 1080/ 00014788. 2007. 9730065
PLEASE SCROLL DOWN FOR ARTI CLE
Taylor & Francis m akes ever y effor t t o ensur e t he accuracy of all t he infor m at ion ( t he “ Cont ent ” ) cont ained in t he publicat ions on our plat for m . How ever, Taylor & Francis, our agent s, and our licensor s m ake no r epr esent at ions or war rant ies w hat soever as t o t he accuracy, com plet eness, or suit abilit y for any pur pose of t he Cont ent . Any opinions and view s expr essed in t his publicat ion ar e t he opinions and view s of t he aut hor s, and ar e not t he view s of or endor sed by Taylor & Francis. The accuracy of t he Cont ent should not be r elied upon and should be independent ly ver ified w it h pr im ar y sour ces of infor m at ion. Taylor and Francis shall not be liable for any losses, act ions, claim s, pr oceedings, dem ands, cost s, expenses, dam ages, and ot her liabilit ies w hat soever or how soever caused ar ising dir ect ly or indir ect ly in connect ion w it h, in r elat ion t o or ar ising out of t he use of t he Cont ent .
Accountin8 and
zyxwvutsrqponmlkjihgfedcbaZYXWVUTSRQPONMLKJIHGFEDCBA
Biisiiirss Rrserirdi, Vol. 37.zyxwvutsrqponmlkjihgfedcbaZYXWVUTSRQPONMLKJIHGFEDCBA
zyxwvutsrqponmlkjihgfedcbaZYXWVUTSRQPONMLKJIHGFEDCBA
No. 2. pp. 123-150. 2iN7zyxwvutsrqponmlkjihgfedcbaZYXWVUTSRQPONMLKJIHGFEDCBA
123Earnings management and the distribution
of earnings relative to targets: UK evidence
Pelham Gore, Peter F. Pope, Ashni K. Singh*
Abstract-In this paper we provide new evidence on discontinuities in the distribution of reported earnings, using a large sample of UK firms. We examine the discontinuity phenomenon in the context of earnings management. We report that the empirical distribution of earnings before discretionary working capital accruals does not reflect the unusually high frequencies of small surpluses and unusually low frequencies of small deficits relative to targets found in the distribution of actual (reported) earnings, i.e. after discretionary working capital accruals. We find that discretionary working capital accruals have the effect of significantly increasing the frequencies of firms achieving earnings targets both overall and by small margins. Thus, we document an explicit link between working capital accruals-based earnings management and the discontinuities observed in the empirical distribution of earnings rel- ative to targets. We also examine earnings management before and after the issuance of FRS 3 ‘Reporting Financial Performance’ and find evidence that FRS 3 altered earnings management strategies adopted by companies.
Key words: Accounting manipulation, discretionary accruals, earnings management.
Data availability: Data are available from the public or commercial sources identified in the paper.
1. Introduction
The corporate scandals of the late 1990s and early
2000s seriously undermined public confidence in financial reporting and hence in financial markets. Suspicions that reported earnings numbers cannot
be relied upon, and that they are managed, are widespread. Academic interest in this area began before the causes ce‘ltbre occurred and has since grown, focusing on investigations into why and how earnings management is conducted. One par- ticular line of research centres on the finding that the empirical distribution of earnings relative to basic targets displays discontinuities at zero. In
particular, evidence that small negative earnings levels, changes and surprises occur with unexpect- edly low frequency and small positive earnings levels, changes and non-negative surprises occur with unexpectedly high frequency (Hayn, 1995;
Burgstahler and Dichev, 1997; Degeorge et al.,
zyxwvutsrqponmlkjihgfedcbaZYXWVUTSRQPONMLKJIHGFEDCBA
*
The authors are at Lancaster University. They wish to thank Beatriz Garcia Osma for assistance, and Steven Young, two reviewers. participants in sessions at the British Accounting Association Annual Conference 200 I ,Nottingham, the European Accounting Association Annual Congress 2001. Athens, and the American Accounting Association Annual Meeting 2001, Atlanta for comments. They are grateful to the Institutional Brokers Estimate System, a service of IIBIEIS International Inc., for providing us with analyst earnings forecast data as part of a broad academic program to encourage earnings expectations research. All other data we use are available from public sources. Correspondence should be addressed to Professor Peter F. Pope, International Centre for Research in Accounting, the Management School, Lancaster University, Lancaster, LA I
4YX, UK Tel: +44- 1524-593978, Fax: +44- 1524-594334.
E-mail: p .pope 63
zyxwvutsrqponmlkjihgfedcbaZYXWVUTSRQPONMLKJIHGFEDCBA
lancaster.ac .ukThis paper was accepted for publication in March 2007.
1999; Burgstahler and Eames, 2003, 2006). One potential explanation of this behaviour is earnings management to beat benchmarks, e.g. to avoid losses. Consistent with this explanation, Burgstahler and Dichev (1997) find that both operating cash flow and working capital accruals (WCA) rise sharply when reported earnings is just above zero. Evidence on benchmark beating earnings has been used in extensively in subsequent earnings management research (see, for example, Payne and Robb, 2000; Beaver et al., 2003,2004; Dichev and Skinner, 2002; Beatty et al., 2002; Leuz et al., 2003; Leone and Van Horn, 2005; Phillips et al., 2003; Frank and Rego, 2004; Roychowdhury, 2006). However, recent research has raised doubts about whether earnings management does indeed explain the observed discontinuities in the distri- bution of earnings (e.g. Dechow et al., 2003; Degeorge et al., 1999; Durtschi and Easton, 2005). In this paper we contribute to this literature in two main ways. First, we analyse an extensive non-US dataset for the first time in the literature, thereby confirming that the discontinuities previously re- ported in the literature are not specific to the US setting. Second, we introduce new tests lending support to the hypothesis that the discontinuities in earnings distributions are associated with accruals- based earnings management in our sample.
Using a variety of tests, Dechow et al. (2003) are unable to find systematic evidence of accruals management connected to discontinuities in earn- ings distributions for their US sample. When they compare small profit firm-years with all others, they find that the former have higher average dis- cretionary accruals (DACC), cash flows and total
124
zyxwvutsrqponmlkjihgfedcbaZYXWVUTSRQPONMLKJIHGFEDCBA
accruals than the latter. However, when they com- pare small profit firm-years with small loss firm- years, they find insignificant differences between the two groups. Dechow et al. (2003) also compare zero earnings surprise firm-years with all others and with small negative surprise firm-years. They find that zero surprise firm-years have higher DACC and WCA than all other firm-years and higher WCA than small negative surprise firm- years. However, Dechow et al. (2003) find that the difference between average DACC for zero and small negative surprise firm-years is statistically insignificant. They conclude that earnings man- agement to achieve targets via real (operating) de- cisions is a more likely explanation for the discontinuities.
Degeorge et al. (1999) suggest that the distribu- tional irregularities could be a manifestation of scaling earnings. Durtschi and Easton (DE) (2005) also suggest that scaling is important in under- standing the discontinuities in the distribution of deflated earnings per share. DE argue that use of beginning of year stock price to deflate earnings per share can induce discontinuities for two rea- sons. First stock price depends on earnings - the
stock prices for firms with small losses are system- atically lower than stock prices for small profits. Second, loss firms are more likely to have missing values for beginning of year stock prices in their data, resulting in potential selection bias. DE argue that both these effects can lead to 'spurious' dis- continuities in the distribution of scaled earnings that are unconnected to earnings management. Beaver et al. (2004) suggest that the asymmetric treatment of profits and losses and the recognition of special items together might account for up to two thirds of the discontinuity. However, they do not rule out the possibility of other factors being important, including abnormal accruals (p.34). In contrast, Jacob and Jorgensen (2005) show that fourth-quarter earnings are considerably more volatile. While annual earnings measured over the fiscal year display the expected discontinuities, these discontinuities are not evident in different annual periods ending in quarters one, two or there of the fiscal year. Overall, Jacob and Jorgensen (2005) conclude that their results are consistent with manipulation of fiscal year earnings.
ACCOUNTING AND BUSINESS RESEARCH
In summary, there is no clear consensus in the recent literature as to whether discontinuities in earnings distributions reflect earnings manage- ment or are research design biases. In this paper we undertake a detailed examination of earnings management around earnings thresholds, using a large sample of UK firms. We focus on earnings management involving manipulation of working capital accruals. In contrast to Dechow et al. (2003) we present evidence consistent with eam- ings management to achieve targets. In particular we show that adjustment of earnings for discre- tionary accruals eliminates the discontinuity around earnings targets.
Accounting manipulation of working capital ac- cruals (WCA) suggests itself as a potentially pop- ular technique for achieving earnings targets. Healy ( 1985: 103) points out that accrual manipu- lation is less costly and more feasible on a multi- period basis than accounting method changes as a means of transferring earnings between periods. Further, DeFond and Jiambalvo (1994: 158) view WCA as more susceptible to manipulation than non-working capital accruals. In this study, we in- vestigate the links between the discretionary com- ponent (termed discretionary accruals, hereafter DACC) of WCA, the frequency of earnings target achievement and the observed discontinuity in the distribution of earnings relative to basic targets.' The targets we consider are the achievement of positive earnings levels and changes and the avoidance of negative earnings surprises. Our pri- mary objective is to determine whether DACC, a frequently used proxy for earnings management, contribute significantly to the unexpectedly high frequencies of positive, particularly small positive, earnings levels, changes and surprises.' We also wish to obtain an insight into the overall impact of DACC on the distribution of earnings relative to targets, and hence to provide evidence on whether manipulation of the accruals process is an impor- tant earnings management tool.
Our paper is novel because i t provides specific evidence on the manner in which firms use DACC with reference to basic earnings targets. Prior stud- ies have typically used DACC as a proxy for eam- ings management without specifying the manner in which firms use DACC to manage earnings. For example, Becker et al. (1998) and Francis et al.
( 1999), although both hypothesising that Big
zyxwvutsrqponmlkjihgfedcbaZYXWVUTSRQPONMLKJIHGFEDCBA
5(then Big
zyxwvutsrqponmlkjihgfedcbaZYXWVUTSRQPONMLKJIHGFEDCBA
6) auditors constrain earnings manaoe-ment more effectively than non-Big
zyxwvutsrqponmlkjihgfedcbaZYXWVUTSRQPONMLKJIHGFEDCBA
5 auditors, in-terpret this prediction differently. Becker et al.
( 1998) imply that
zyxwvutsrqponmlkjihgfedcbaZYXWVUTSRQPONMLKJIHGFEDCBA
signed DACC are negatively as-sociated with the presence of Big 5 auditors while Francis et al. (1999) imply that it is crbsoltrte
DACC that are negatively associated with the presence of Big 5 auditors. This reflects different underlying assumptions about the manner in
9
~
'
We define DACC as the discretionary component of total working capital accruals. DACC are also defined. elsewhere in the literature. as the discretionary component of total accru-als including long-term accruals such as depreciation. We use the expression DACC in referring,!: other studies that use that expression even if they define it ditterently from us. I n Section
3. we explain our definition of DACC and the estimation tech- nique we use.
See footnote 6 for a detailed expliaution of our usage
zyxwvutsrqponmlkjihgfedcbaZYXWVUTSRQPONMLKJIHGFEDCBA
of positive and negative.Vol.
zyxwvutsrqponmlkjihgfedcbaZYXWVUTSRQPONMLKJIHGFEDCBA
37 No. 2. 2007which firms use DACC to manage earnings? A further contribution of the paper is to provide evidence on whether the phenomenon of disconti- nuities in the distribution of earnings extends beyond the US corporate environment and GAAP regime. In recent years, there has been heightened interest in the impact of different economic envi- ronments and GAAP regimes on the attributes of accounting earnings (Pope and Walker 1999; Ali and Hwang 2000; Ball et al. 2000), and on the in- cidence of earnings and forecast management (Brown and Higgins 2001). In addition, Leuz et al. (2003) provide evidence of a correlation between loss avoidance and accruals-based measures of earnings management. This paper extends and deepens this growing international accounting lit- erature by reporting detailed evidence of the links between earnings discontinuities and accruals ma- nipulation based on a large sample of UK firms.
The UK context is interesting for a number of reasons. Firstly, the incentives for earnings man- agement differ from those in the US (the basis of most research to date). Ball et al. (2000: 25-29) point out that the UK has the least regulated and least litigious accounting environment among the common-law countries they study, and that corpo- rate debt is primarily private in the UK. According to Ball et al. (2000), these factors imply a reduced demand for timely incorporation of bad news into accounting earnings reported by UK firms. Such lower demand for timely reporting of bad news al- lows managers greater flexibility compared to the US to manage earnings through timing of recogni- tion. In seeming contrast, Brown and Higgins
(2001) cite evidence that UK managers have vast-
zyxwvutsrqponmlkjihgfedcbaZYXWVUTSRQPONMLKJIHGFEDCBA
ly smaller holdings of stock options than their U.S. counterparts, and thus suggest that UK managers have less incentive to manipulate earnings to avoid reporting bad news than US managers. However,
in their 2005 paper, Brown and Higgins suggest that the impact of differences in expectations man- agement behaviour between countries may partial- ly explain the apparent differences in incentives for earnings management.“
Another UK-specific feature is the regime change that occurred regarding the reporting of ex-
traordinary items. Prior to the issuances of FRS
zyxwvutsrqponmlkjihgfedcbaZYXWVUTSRQPONMLKJIHGFEDCBA
3(Accounting Standards Board, 1992), the majority of extraordinary debits concerned restructurings of
I25
Alternatively. or additionally, it implies different assump- tions on the loss function of auditors.
‘The literature of which this latter paper forms a part exam-
ines the manipulation by company management of analyst ex- pectations. i.e. seeking to guide downwards expectations. rather than having to (or in addition to) managing earnings up- wards.
We use the term non-discretionary earnings to mean earn- ings before DACC. or unmanaged earnings ignoring earnings management effected other than through DACC.
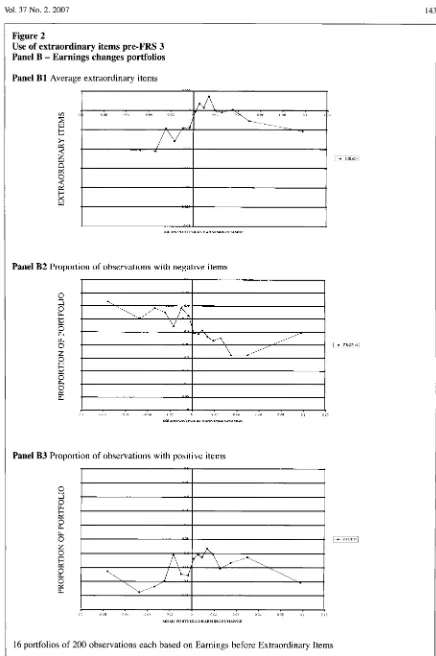
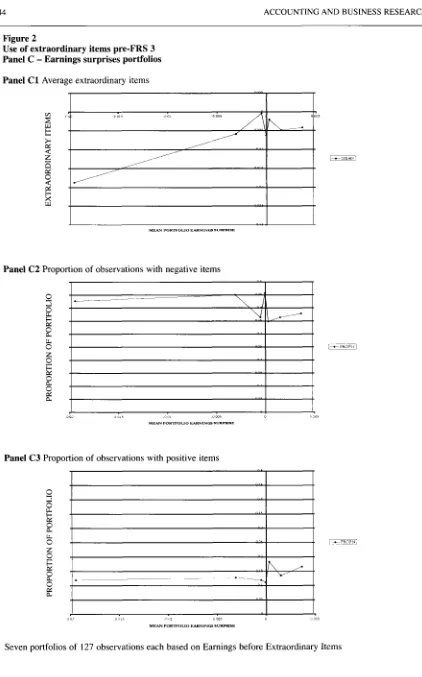
businesses, i.e. seemingly not extraordinary in na- ture, whereas many apparently extraordinary cred- its were treated as merely ‘exceptional’ and taken as ‘above the line’ income. One of the reasons given for the issuance of FRS 3 was thus to elimi- nate the use of extraordinary items as a means of earnings management. We are thus able to exam- ine the use of extraordinary items as an earnings management tool, both pre- and post-FRS 3 .
Our results indicate that the earnings levels, changes and surprises of UK firms, like those of
US firms, are distributed discontinuously around
zero. Specifically, we observe unusually low inci- dence of small negative earnings levels, changes and surprises, and unusually high incidence of small positive earnings levels, changes and sur- prises. However, non-discretionary earnings lev- els, changes and surprises for the same sample are distributed without this discontinuity at zero, sug- gesting that the discontinuity in the earnings distri- bution is attributable to DACC.5 We further document that DACC have the effect of signifi- cantly increasing the incidence of small positive earnings levels, changes and surprises. DACC also have the effect of reducing the incidence of both positive and negative earnings levels, changes and surprises of large magnitude.
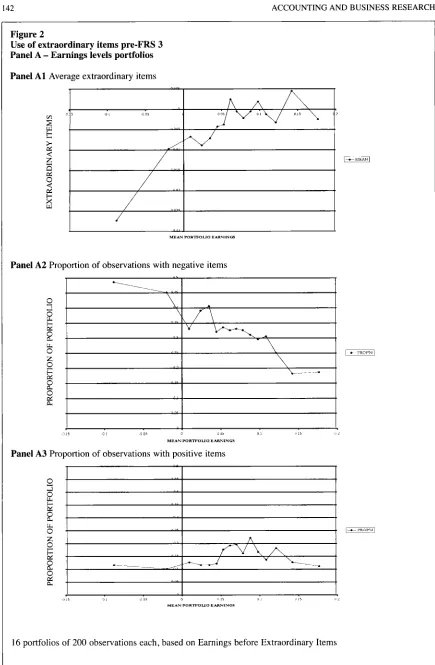
Further, we report evidence that exact zero earn- ings surprises are associated with unusual variance in DACC, suggesting idiosyncratic use of DACC to meet forecasts exactly. We also find that exact zero earnings surprises are associated with rela- tively low average extraordinary items, high inci- dence of negative extraordinary items, and low incidence of positive extraordinary items. This re- sult is consistent with exact zero earnings surpris- es being achieved with the aid of misclassification of extraordinary items.
The main contributions of this paper can be sum- marised as follows. Firstly, we provide a previous- ly undocumented general empirical explanation of the discontinuity observed at zero in the distribu- tion of earnings relative to targets. Specifically, we report that accounting manipulation by the gener- ality of (non-financial) companies through DACC is a significant contributor to this discontinuity. Secondly, we quantify the extent to which firms achieve earnings targets with the aid of DACC. The paper thus also contributes further to the methodological debate by providing support for the use of DACC as a proxy for earnings manage- ment. However, this evidence also indicates that the extent to which, and direction in which, firms use DACC to manage earnings varies with the re- lationship between earnings before DACC and basic earnings targets. This has implications for the interpretation of previous studies, and design of future studies, using DACC to proxy for earn- ings management. The evidence we report also
126
zyxwvutsrqponmlkjihgfedcbaZYXWVUTSRQPONMLKJIHGFEDCBA
contributes to the literature examining the circum- stances under which firms seek to manage earn- ings (e.g., Nelson et al. 2003).
ACCOUNTING AND BUSINESS RESEARCH
discontinuities would be consistent with, but not necessarily proof of, earnings management to achieve targets. Thus, we test the following predic-
tion:
zyxwvutsrqponmlkjihgfedcbaZYXWVUTSRQPONMLKJIHGFEDCBA
H1: The frequency of small negative earnings levels (changes, surprises) is lower than ex- pected and the frequency of small positive earnings levels (changes, surprises) is higher than expected under a smooth distribution6
To the extent that DACC cause the discontinuity in the earnings distribution, the removal of DACC from earnings is expected to reduce the discontinu- ity. Specifically, we predict that the distributions of non-discretionary earnings do not display disconti- nuities around earnings targets, and test the fol- lowing prediction:
H2: The frequencies of small negative non-dis- cretionary earnings levels (changes, surpris- es) and small positive non-discretionary earnings levels (changes, surprises) are equal to the frequencies expected under a smooth distribution
Further, the use of DACC to achieve targets will be reflected in DACC having the effect of increas- ing the proportion of firm-years achieving earn- ings targets. This implies the following prediction:
H3: The proportion of firm-years with positive earnings levels (changes, surprises) is larger than the proportion of firm-years with posi- tive non-discretionary earnings levels (changes, surprises)
The previous evidence on the distribution of earnings relative to targets suggests that earnings management to achieve targets occurs most exten- sively when the shortfall from target is small. In particular, it is suggested that firms seek to manage earnings to transform small deficits into small sur- pluses relative to targets. Thus, we test the follow-
ing predictions:
zyxwvutsrqponmlkjihgfedcbaZYXWVUTSRQPONMLKJIHGFEDCBA
2. Research design
Prior research has typically approached the ques- tion of whether firms use DACC to achieve earn- ings targets by examining average DACC conditional on either earnings or non-discretionary earnings relative to target. For example, DeFond and Park (1999) report that firms use DACC to
achieve earnings in excess of forecasts by 2 to
zyxwvutsrqponmlkjihgfedcbaZYXWVUTSRQPONMLKJIHGFEDCBA
3cents per share. They find that DACC are income- increasing on average if the earnings surprise is less than 2 cents, income-decreasing if the earn- ings surprise is more than 3 cents, and insignifi-
cantly different from zero if the earnings surprise is 2 or 3 cents. Cheng (2000) also investigates the relationship between DACC and earnings surpris- es and observes that firms with non-discretionary earnings below forecasts report positive DACC on average, while firms with non-discretionary earn- ings above forecasts report negative DACC on av- erage. This approach does not address the extent to which DACC are used successfully to manage earnings from below to above targets. It also does not answer the question of whether the discontinu- ity in the distribution of earnings relative to targets is specifically caused by DACC. If earnings man- agement underpins observed discontinuities in earnings distributions, then earnings management should be used by more firms to move from below to above target than in the opposite direction. The finding that firms with small profits have higher DACC than firms with small losses does not pro- vide such a demonstration. It is possible that at least as many firms move from non-discretionary (pre-managed) profits to reported (post-managed) losses as move from non-discretionary losses to re- ported profits while at the same time finding that firms with non-discretionary profits (losses) have negative (positive) DACC.
We first examine whether earnings levels, changes and surprises are distributed with a dis- continuity at zero, similar to Burgstahler and Dichev (1997) and Degeorge et al. (1999). Such
For the purpose of efficient expression, we use the terms negative and positive to describe earnings and non-discre- tionary earnings relative to target. Strictly, our usage of positive (negative) in the context of earnings levels, non-dis- cretionary earnings levels, earnings changes and non-discre- tionary earnings changes refers to observations greater than (less than or equal to) zero. Our usage of positive (negative) in the context of earnings surprises and non-discretionary earn- ings surprises refers to observations greater than or equal to (less than) zero. This is in accordance with our assumption that firms seek to achieve positive earnings levels and changes and avoid negative earnings surprises, and with the conse- quential design of our empirical tests.
H4:
H5:
The proportion of firm-years with small pos- itive earnings levels (changes, surprises) is larger than the proportion of firm-years with small positive non-discretionary earnings levels (changes, surprises)
The proportion of firm-years with small neg- ative earnings levels (changes, surprises) is smaller than the proportion of firm-years with small negative non-discretionary earn- ings levels (changes, surprises)
One important caveat must be noted with respect to the last prediction. It is based on the assumed earnings management objectives of achieving pos- itive earnings levels and changes and avoiding negative earnings surprises. It does not take ac- count of other earnings management strategies,
Vol. 37 No. 2. 2007
e.g., reducing the magnitude of earnings changes or surprises, which firms might simultaneously pursue. This would have implications for H5. Specifically, the use of DACC to smooth income might result in DACC increasing the proportion of firm-years with small negative earnings changes and reducing the proportion of firm-years with large negative earnings changes. We regard the question of whether firms use DACC to dampen earnings levels, changes or surprises as an empiri- cal issue to be taken into account when presenting and discussing our results.
127
that classification of extraordinary items can be used as a means to manage earnings before ex- traordinary items makes it especially interesting to study whether DACC are also used to manage this earnings measure. For completeness, we also re- port evidence on pre- and post-FRS 3 periods, on using earnings after extraordinary items (EAXI) and on the use of extraordinary and special items
to achieve earnings targets (see Section
zyxwvutsrqponmlkjihgfedcbaZYXWVUTSRQPONMLKJIHGFEDCBA
5 ) .For the purposes of tests on earnings surprises, we obtain actual and forecasted earnings from I/B/E/S." We restrict the sample to those consen- sus forecasts based on at least three individual forecasts, and use the median forecast from the last available month before the earnings announce- ment as the proxy for forecasted earnings. We re- quire at least three individual forecasts so as to ensure that the median is a reliable measure.14 We use the median instead of the mean so as to min- imise the effect of individual forecasts with unusu-
al errors having excessive influence on the
zyxwvutsrqponmlkjihgfedcbaZYXWVUTSRQPONMLKJIHGFEDCBA
3.
Sample and data
We test the above empirical predictions, and pro- vide related evidence, on a sample comprising all UK quoted non-financial firms over the years 1989 to 1998.' We exclude financial firms because of our interest in working capital accruals, the accru- al generating process being considerably different in financial firms (Peasnell et al., 2000:318). We further restrict the sample to accounting periods of approximately one year in duration, defined as not less than 350 or more than 380 days. We impose this requirement because accounting flow vari- ables such as earnings are incomparable if they re- late to periods of different duration.8
Our primary data source for tests on earnings levels and changes is Datastream. For these tests, we measure earnings (EARN) in a hybrid manner across implementation of an important UK report- ing standard, FRS 3.9 In pre-FRS 3 accounting pe- riods, we measure EARN as earnings before extraordinary items. In post-FRS 3 accounting periods, we measure EARN as earnings before ex- traordinary and special or non-operating excep- tional items.'O The special items we exclude are items that could have been extraordinary pre-FRS
3, are exceptional post-FRS
zyxwvutsrqponmlkjihgfedcbaZYXWVUTSRQPONMLKJIHGFEDCBA
3 , and are required byFRS 3 to be disclosed separately on the face of the income statement." We measure scaled earnings level (E) as EARN,/TA,-I, and scaled earnings
change (AE) as (EARN, -
zyxwvutsrqponmlkjihgfedcbaZYXWVUTSRQPONMLKJIHGFEDCBA
EARN,-I)/TA,-I.Our analysis of earnings before extraordinary items is consistent with Degeorge et al. (1999) but contrasts with Burgstahler and Dichev (1997) who examine earnings after extraordinary items. Theory is unclear about which earnings measure managers seek to manipulate, or how this measure is identified. We focus on earnings before extraor- dinary items because the investment analyst com- munity would appear to make wider use of earnings measured before extraordinary items.I2 This increases the incentive for firms to manage earnings before extraordinary items relative to basic targets. Further, there is UK evidence that earnings before extraordinary items is less timely in reflecting bad news than earnings after extraor- dinary items (Pope and Walker, 1999). The fact
'We use Datastream live and dead UK quoted equity lists, UKQl and DEADUK. These lists are based on issued securi- ties and include a number of instances where individual firms are listed more than once as a result of multiple issues. We identify these cases and retain in the sample only one equity class per firm-year.
'
Of our final earnings level sample of 10,197 firm-years, 1561 (15.3%) observations have less than 365 or more than 366 days.FRS 3 was issued on 29 October 1992, voluntary compli- ance being immediately optional and mandatory compliance required in relation to accounting periods ending on or after 22 June 1993. FRS 3 redefined ordinary and extraordinary activ- ities with the effect of abolishing extraordinary items in the UK.
lo Our pre-FRS 3 EARN is Datastream account code
(DS) 625, and our post-FRS 3 EARN
zyxwvutsrqponmlkjihgfedcbaZYXWVUTSRQPONMLKJIHGFEDCBA
i s DS625-(DS1083- DS1094-DS1097). We measure other variables in terms ofDatastream account codes as follows. WCA is A(DS376- DS375)-A(DS389-DS309), REV is DS 104, TA is DS392, XI is DS193 and SI is DS1083-DS1094-DS1097.
" These items, listed in para. 20 of FRS 3, are profits or losses on sale or termination of operations, costs of fundamen- tal reorganisations or restructuring, and profits or losses on
sale of fixed assets. Ernst & Young (1999) uses the terminolo- gy non-operating exceptional to describe these items. Exclusion of these items from our post-FRS 3 measure of earnings closely resembles the adjustments made by Lin and Walker (2000) in their post-FRS 3 construct of headline eam- ings.
''
I/B/E/S International Inc. (1996:6) points out that ana- lysts generally make forecasts of earnings on a continuing basis, i.e., excluding extraordinary and other non-operating items. Similarly, SIP 1 (1993) excludes extraordinary and sev- eral other non-maintainable items from the definition of head- line earnings. Lin and Walker (2000) report that, in terms of explaining stock prices, headline or maintainable earnings per- forms generally better than FRS 3 earnings, which includes non-operating exceptional or formerly extraordinary items.l 3 We only have access to YB/E/S data for 1990 onwards.
Perhaps because of this and contrary to Brown and Higgins (2001). we do not find a time-dependent bias in the occurrence of exact forecasts.
''
The median forecast horizon, i.e. period between fore- casts and earnings announcements, is 28 days128 ACCOUNTING AND BUSINESS RESEARCH
zyxwvutsrqponmlkjihgfedcbaZYXWVUTSRQPONMLKJIHGFEDCBA
Table 1
Descriptive statistics Panel A
Earnings level sample N=10,197
Et 0.055 0.062 0.101 0.024 0.089
NDE, 0.055 0.059 0.1 17
zyxwvutsrqponmlkjihgfedcbaZYXWVUTSRQPONMLKJIHGFEDCBA
4.oo
1 0.114 DACC, 0.ooo
0.000 0.039 -0.040 0.078zyxwvutsrqponmlkjihgfedcbaZYXWVUTSRQPONMLKJIHGFEDCBA
Mean Median Q3 Ql Std. Dev.
Panel B
Earnings change sample N= 10,209
AEt 0.007 0.008 0.028 -0.014 0.063 DACC, 0
.ooo
0.ooo
0.039 -0.04 1 0.078Mean Median Q3 Ql Std. Dev.
NDAE, 0.007 0.005 0.055 4 . 0 4 5 0.100
Panel C
Earnings surprise sample N=4,380
ES, 4 . 0 0 1 0.001 0.003 -0.001 0.013 NDES, 0.002 0.002 0.034 -0.030 0.060 DACC, 4 . 0 0 3 4.002 0.029 4 . 0 3 4 0.058
Mean Median Q3 Ql Std. Dev.
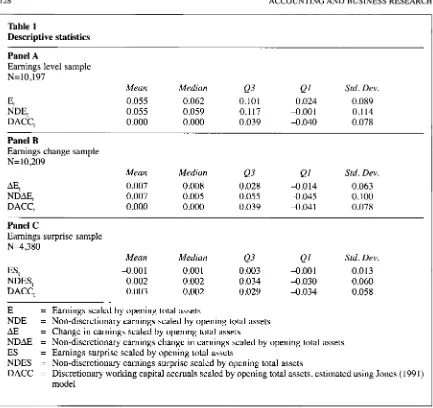
E = Earnings scaled by opening total assets
NDE = Non-discretionary earnings scaled by opening total assets AE = Change in earnings scaled by opening total assets
NDAE = Non-discretionary earnings change in earnings scaled by opening total assets ES = Earnings surprise scaled by opening total assets
NDES = Non-discretionary earnings surprise scaled by opening total assets
DACC = Discretionary working capital accruals scaled by opening total assets, estimated using Jones (1991) model
measure of central tendency. Thus, we measure the earnings surprise (ES) as actual earnings minus the median forecast scaled by opening TA.
We estimate DACC by applying a cross-section-
zyxwvutsrqponmlkjihgfedcbaZYXWVUTSRQPONMLKJIHGFEDCBA
l 5 Collins and Hribar (2002) express the concern that meas-
uring accruals as the change in balance sheet accounts intro- duces measurement error into total accruals, primarily as a result of mergers, acquisitions and discontinued operations. They state that the error in total accruals measured through the balance sheet approach is unlikely to be correlated with the as- sumed drivers of accruals in the Jones (1991) model, resulting in the measurement error being captured entirely by the resid- ual or discretionary accruals estimate. We believe their conjec- ture on the correlation between the measurement error and change in revenue, in particular, is counter-intuitive. Change in total consolidated revenue is, a priori, no less susceptible to influence by mergers, acquisitions and discontinued opera- tions than change in working capital balances. In any case, measuring total accruals using the cash flow statement, which is the approach preferred by Collins and Hribar (2002), is it- self not unproblematic. The difference between operating profit and operating cash flow usually includes a number of idiosyncratic accruals that cannot be classified systematically as either discretionary or non-discretionary.
a1 version of the Jones (1991) model to working capital accruals. Under this model, normal or non- discretionary accruals are assumed to be a function of designated factors or drivers. The component of accruals not explained by these drivers is denoted as abnormal or discretionary. In the original Jones (1991) formulation, total accruals are modeled as a function of the change in total sales (AREV) and gross property, plant and equipment (PPE). The former is argued to drive short term accruals or WCA and the latter to drive long term accruals, most notably depreciation.
Our focus is on the discretionary component of WCA. We believe that long term accruals such as depreciation are unlikely to be an effective means of managing earnings given their visibility and the ability of the market to observe, and unwind the earnings implications of, any attempt to manipu- late them (Young 1999:842). We measure total WCA as the change in non-cash working ~apita1.I~ We then estimate the following cross-sectional OLS regression for each Datastream level-6 indus- try-year, using all valid firm-years with available
[image:7.540.55.488.78.486.2]Vol.
zyxwvutsrqponmlkjihgfedcbaZYXWVUTSRQPONMLKJIHGFEDCBA
37 No.zyxwvutsrqponmlkjihgfedcbaZYXWVUTSRQPONMLKJIHGFEDCBA
2.2007 data but requiring a minimum of six observationsper regression:16
W C A ~ ~ , / T A l j f - ! =
hJf+
~ l J f A R E V I J f / T A I J f - ~ + E I J , ( l )where i, j and t are firm, industry and time sub- scripts respectively. This regression facilitates par- titioning of WCA into non-discretionary accruals
(NDACC) and DACC. NDACC are measured as
the predicted component of WCA and DACC as
the residual resulting from this regression. Thus:
zyxwvutsrqponmlkjihgfedcbaZYXWVUTSRQPONMLKJIHGFEDCBA
DACCIJ,= WCAIJ,/TAlJt I - NDACC,,
zyxwvutsrqponmlkjihgfedcbaZYXWVUTSRQPONMLKJIHGFEDCBA
( 2 )= WCAIJl/ TAIJf- I - (boJl +
b
I JI mEVIJ,/ TAIJl- Iwhere
6,
andPI
are the industry-year OLS param- eters estimated above.In our use of the Jones (199 1) model rather than available alternatives, we are guided by Peasnell et al. (2000). They evaluate the specification and power of alternative methods of estimating DACC using UK data. The results they report suggest that, on the whole, alternative models currently available are not superior to the Jones (1991) model in terms of ability to detect plausible levels of earnings management. Our measure of WCA and the DACC estimation technique closely re- semble those used by Peasnell et al. (2000).
Having estimated DACC as described above, we measure non-discretionary earnings (NDE), non- discretionary earnings change (NDAE) and non- discretionary earnings surprise (NDES) as
E-DACC, AE-DACC and ES-DACC respectively.
Our earnings levels tests are conducted on an earn- ings level sample defined as all observations from the above-described main sample for which E,
NDE and DACC are available, and having deleted
the extreme%iles of E, NDE and DACC. Our earn- ings change and surprise samples are defined in a similar manner, with E (NDE) being replaced by
AE (NDAE) and ES (NDES) respectively.
These criteria result in earnings level, change and surprise samples of 10,197, 10,209 and 4,380 observations respectively. Basic descriptive statis- tics on these samples are presented in Table 1. Mean (median) E, AE and ES are 0.055 (0.062),
0.007 (0.008) and -4.001 (0.001) for the earnings level, change and surprise samples respectively. As expected, mean (median) DACC is zero (zero) for both the earnings level and change ~amp1es.l~
129
However, the earnings surprise sample has mean
(median) DACC of -0.003 (4,002).
zyxwvutsrqponmlkjihgfedcbaZYXWVUTSRQPONMLKJIHGFEDCBA
l6 DeFond and Jiambalvo ( I 994) and Young (1999) also re-
quire a minimum of six observations.
l7 Given that DACC is estimated as an OLS residual, the
population average is zero by construction.
The high frequencies shown in the extreme upper and lower bins in all panels of Figure 1 are a result of truncating the range of the graphs and combining the remaining bins.
l9 We use increasingly narrow bands or bin widths as we
move from earnings levels to changes to surprises because of the degree of concentration around zero in these respective distributions.
4.
Results
zyxwvutsrqponmlkjihgfedcbaZYXWVUTSRQPONMLKJIHGFEDCBA
4 . 1 . Distribution of earnings and
non-discretionary earnings relative to target
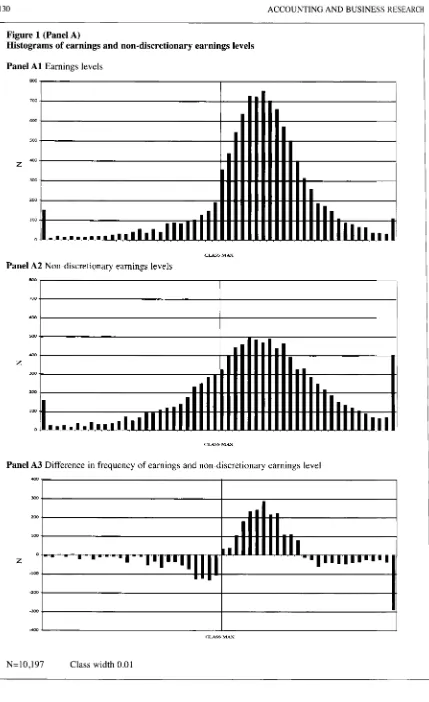
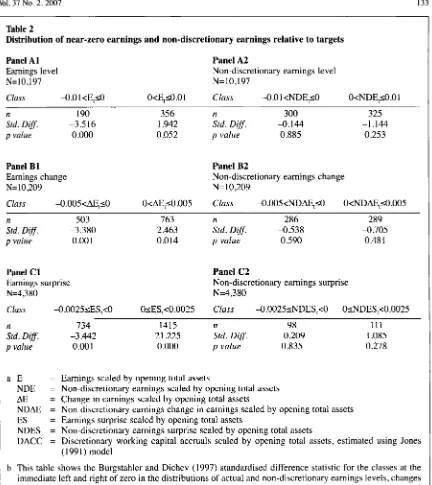
We predict in H 1 that earnings relative to targets will be distributed discontinuously around zero, consistent with firms managing earnings to avoid small deficits and achieve small surpluses. We fur- ther predict in H2 that the exclusion of discre- tionary accruals from current period earnings will cause the discontinuity around zero to disappear. The evidence on these hypotheses is reported in Figure 1 and Table 2. Figure 1 presents histograms of reported and non-discretionary earnings levels, changes and surprises. It also shows the differ- ences between the frequency of reported earnings and non-discretionary earnings relative to target in each class, thus illustrating the impact that DACC have on the distribution of earnings relative to tar- gets.I8 Table 2 reports the Burgstahler and Dichev (1997) standardised difference statistics relating to the classes at both immediate sides of zero in the distributions reported in Figure 1 . I 9
The distribution of earnings levels, shown in Figure 1 Panel A1 reveals a distinct discontinuity at zero. The frequency at the immediate left of zero is low and that on the immediate right of zero is high relative to expected frequencies under a smooth distribution. As predicted, Panel A2 shows that the distribution of non-discretionary earnings levels is relatively smooth around zero. There is little disparity between the frequencies immediate- ly adjacent to zero. Panel A3 confirms that DACC have the effect of increasing the frequency of small positive earnings and decreasing the fre- quency of small negative earnings. In addition,
DACC have the effect of reducing the frequency
of both large positive and large negative earnings. Table 2 Panels A1 and A2 confirm the visual im- pressions regarding the impact of DACC around zero earnings. Panel A1 indicates that the actual frequency of the class to the immediate left of zero in the earnings distribution is significantly less than the expected frequency of that class under the null hypothesis of a smooth distribution. On the other hand, Panel A2 indicates that the actual fre- quency of the class to the immediate left of zero in the non-discretionary earnings distribution is in- significantly different from its expected frequency. This confirms our H1 and H2 predictions that earnings is distributed discontinuously around zero, while non-discretionary earnings is not.
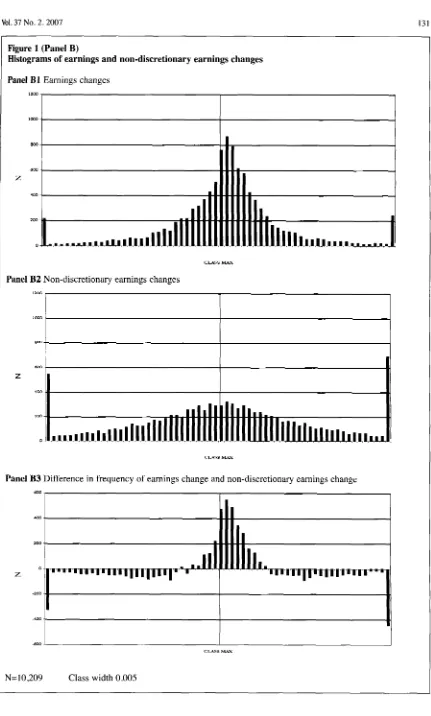
Figure 1 Panel B1 shows the distribution of earnings changes. This histogram reveals a discon- tinuity at zero, caused by the frequency at the im- mediate right of zero appearing to be higher and that at the immediate left of zero lower than ex-
130 ACCOUNTING AND BUSINESS KESEAKCH
zyxwvutsrqponmlkjihgfedcbaZYXWVUTSRQPONMLKJIHGFEDCBA
Figure 1 (Panel A)
Histograms of earnings and non-discretionary earnings levels
Panel A1 Earnings levels
zyxwvutsrqponmlkjihgfedcbaZYXWVUTSRQPONMLKJIHGFEDCBA
z
CLASS MAS
Panel A2 Non-discretionary earnings levels
zyxwvutsrqponmlkjihgfedcbaZYXWVUTSRQPONMLKJIHGFEDCBA
800
zyxwvutsrqponmlkjihgfedcbaZYXWVUTSRQPONMLKJIHGFEDCBA
7w
zyxwvutsrqponmlkjihgfedcbaZYXWVUTSRQPONMLKJIHGFEDCBA
-ua
z
zyxwvutsrqponmlkjihgfedcbaZYXWVUTSRQPONMLKJIHGFEDCBA
YK)
2ca
lw
0
Panel A3 Difference in frequency of earnings and non-discretionary earnings level
ua
CLASS MAX
N= 10,197 Class width 0.01
Vol.
zyxwvutsrqponmlkjihgfedcbaZYXWVUTSRQPONMLKJIHGFEDCBA
37 No. 2. 2007zyxwvutsrqponmlkjihgfedcbaZYXWVUTSRQPONMLKJIHGFEDCBA
131Figure 1 (Panel B)
Histograms of earnings and non-discretionary earnings changes
Panel B1 Earnings changes
zyxwvutsrqponmlkjihgfedcbaZYXWVUTSRQPONMLKJIHGFEDCBA
C L G S W K
Panel B2 Non-discretionary earnings changes
zyxwvutsrqponmlkjihgfedcbaZYXWVUTSRQPONMLKJIHGFEDCBA
200
zyxwvutsrqponmlkjihgfedcbaZYXWVUTSRQPONMLKJIHGFEDCBA
0
Panel B3 Difference in frequency of earnings change and non-discretionary earnings change
6W
200
0
zyxwvutsrqponmlkjihgfedcbaZYXWVUTSRQPONMLKJIHGFEDCBA
z
N= 10,209
c u s s MA..
Class width 0.005
[image:10.540.52.483.57.773.2]I32 ACCOUNTING AND BUSINESS RESEARCH
zyxwvutsrqponmlkjihgfedcbaZYXWVUTSRQPONMLKJIHGFEDCBA
Figure 1 (Panel C)
Histograms of earnings and non-discretionary earnings surprises
Panel C1 Earnings surprises
zyxwvutsrqponmlkjihgfedcbaZYXWVUTSRQPONMLKJIHGFEDCBA
24.20
zyxwvutsrqponmlkjihgfedcbaZYXWVUTSRQPONMLKJIHGFEDCBA
I I I
C W S MIN
Panel C2 Non-discretionary earnings surprises
zyxwvutsrqponmlkjihgfedcbaZYXWVUTSRQPONMLKJIHGFEDCBA
2000-
zyxwvutsrqponmlkjihgfedcbaZYXWVUTSRQPONMLKJIHGFEDCBA
1640 -
I
CLASS MlN
Panel C3 Difference in frequency of earnings surprise and non-discretionary earnings surprises
1600
l2w
zyxwvutsrqponmlkjihgfedcbaZYXWVUTSRQPONMLKJIHGFEDCBA
4C U 5 5 MI'U
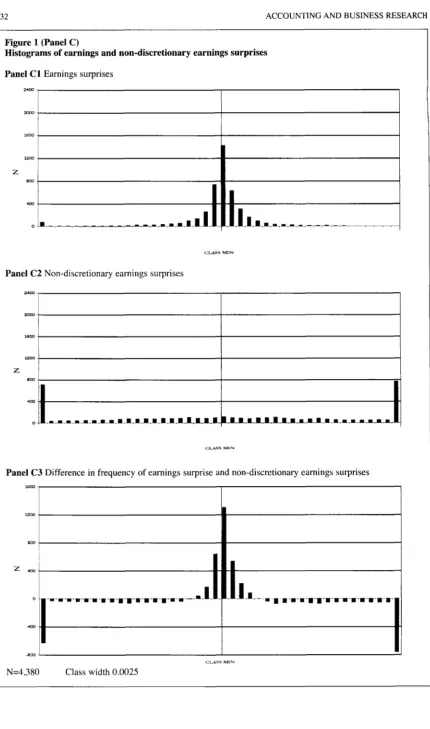
N=4.380 Class width 0.0025
[image:11.540.55.485.64.793.2]Vol.
zyxwvutsrqponmlkjihgfedcbaZYXWVUTSRQPONMLKJIHGFEDCBA
37 No. 2.2007 133Table 2
Distribution of near-zero earnings and non-discretionary earnings relative to targets Panel A1
Earnings level N= 10.1 97
Panel A2
Non-discretionary earnings level
N= 10,197
zyxwvutsrqponmlkjihgfedcbaZYXWVUTSRQPONMLKJIHGFEDCBA
Class -0.0 I <E,sO O<E,sO .O I Class
zyxwvutsrqponmlkjihgfedcbaZYXWVUTSRQPONMLKJIHGFEDCBA
-0 .O 1 <NDE,sO O<NDE,sO.O 1zyxwvutsrqponmlkjihgfedcbaZYXWVUTSRQPONMLKJIHGFEDCBA
n 190 356
zyxwvutsrqponmlkjihgfedcbaZYXWVUTSRQPONMLKJIHGFEDCBA
n 300 325Std. Diff. -3.516 1.942 Std. Diff. -0.144 -1.144
p value 0.000 0.052 p value 0.885 0.253
Panel B1
Earnings change N=10,209
Panel B2
Non-discretionary earnings change N= 10,209
Class 4.005<AEIs0 O<AE,sO .005 Class 4 .OOkNDAE,sO O<NDAE,sO.OOS
n 503 763 n 286 289
Std. Diff. -3.380 2.463 Std. Diff. -0.538 -0.705
p value 0.001 0.014 p value 0.590 0.48 I
Panel C1
Earnings surprise N=4,380
Panel C2
Non-discretionary earnings surprise N=4,380
Class -0.0025sES1<0 OsES,<0.0025 Class 4.0025sNDES1<O OsNDES,<O.0025
n 734 1415 I7 98 1 1 1
Std. Dix. -3.442 2 1.225 Std. Diff. -0.209 1.085
p value 0
.oo
1 0.000 p value 0.835 0.278 a E = Earnings scaled by opening total assetsNDE = Non-discretionary earnings scaled by opening total assets AE = Change in earnings scaled by opening total assets
NDAE = Non-discretionary earnings change in earnings scaled by opening total assets ES = Earnings surprise scaled by opening total assets
NDES = Non-discretionary earnings surprise scaled by opening total assets
DACC = Discretionary working capital accruals scaled by opening total assets, estimated using Jones (1991) model
b This table shows the Burgstahler and Dichev (1997) standardised difference statistic for the classes at the immediate left and right of zero in the distributions of actual and non-discretionary earnings levels, changes and surprises scaled by opening total assets. This statistic is measured as the difference between the actual and expected frequencies in the class concerned, standardised by the standard deviation of this difference. The expected frequency of each class is assumed to be the mean of the two immediately adjacent classes. In other words, if the number of observations in class i is denoted by ni, the probability of an observation occurring in class i denoted by pi, and the total number of observations in the sample denoted by N, the test statistic for class i is given by:
c This statistic is evaluated against the standardised normal distribution. d All p values reported are two-tailed
[image:12.540.54.486.77.562.2]134
zyxwvutsrqponmlkjihgfedcbaZYXWVUTSRQPONMLKJIHGFEDCBA
pected. As predicted, the distribution of non-dis- cretionary earnings changes shown in Panel B2 does not have a similar discontinuity at zero. The frequencies at the immediate sides of zero appear indistinguishable from each other, and the entire distribution appears symmetrical around zero. The distribution of actual earnings changes has rela- tively heavy density over a range of small positive earnings changes. Panel B3 shows that DACC have the effect of increasing the frequency of small positive earnings changes, increasing the frequency of small negative earnings changes to a lesser extent, and reducing the frequency of large positive and negative earnings changes.
Evidence confirming our H 1 and H2 predictions regarding the effect of DACC on the discontinuity in the distribution of earnings changes is presented
in Table 2. Panel B 1
zyxwvutsrqponmlkjihgfedcbaZYXWVUTSRQPONMLKJIHGFEDCBA
indicates that the frequency ofthe class to the immediate left of zero in the earn- ings change distribution is significantly less than expected had the distribution been smooth. However, this is not the case in the distribution of non-discretionary earnings changes. Panel B2 shows that the frequency to the immediate left of zero is insignificantly different from that expected under a smooth distribution.
In Figure 1 Panel C1, we present the distribution of earnings surprises. This distribution reveals high concentration around zero, with more than 85% of all firm-years reporting earnings surprises
within a 1.25% of TA band around zero.
Consistent with our H1 prediction the frequency to the immediate right of zero is markedly greater than that at the immediate left of zero. Panel C2 re- ports the distribution of non-discretionary earnings surprises, with little observable disparity between frequencies immediately either side of zero. This distribution is dispersed over a wide range, consis- tent with DACC being used to manage earnings to- wards forecast and with analysts anticipating a significant part of DACC. This is confirmed in Panel C3, which indicates that DACC have the ef- fect of causing convergence of earnings and fore- casts. Specifically, DACC increase the frequency of small magnitude surprises and reduce the fre- quency of large magnitude surprises. It is also clear from this panel that DACC increase the fre- quency of small positive surprises to a greater ex- tent than small negative surprises.
Table 2 Panel C1 confirms that the frequency of the class to the immediate left of zero in the earn- ings surprise distribution is significantly less than expected under the null hypothesis of a smooth distribution. In contrast, the actual frequency of this class in the non-discretionary earnings sur-
prise distribution (Panel
zyxwvutsrqponmlkjihgfedcbaZYXWVUTSRQPONMLKJIHGFEDCBA
C2) is insignificantly dif-ferent from the expected frequency. This is consistent with our H1 and H2 predictions that earnings surprises are distributed discontinuously
ACCOUNTING AND BUSINESS RESEARCH
around zero while non-discretionary earnings sur- prises are not.
In summary, therefore, we find that earnings lev- els, changes and surprises are distributed with vis- ible and statistically significant discontinuities around zero. Specifically, in each of these distribu- tions, the frequency to the immediate right of zero is greater than expected and the frequency to the immediate left of zero lower than expected under a smooth distribution. We find, further, that the dis- tributions of non-discretionary earnings levels, changes and surprises are not discontinuous in this manner around zero. This suggests that the discon- tinuity in the distribution of earnings relative to
basic targets is caused by DACC.
zyxwvutsrqponmlkjihgfedcbaZYXWVUTSRQPONMLKJIHGFEDCBA
4.2. Proportions ofBrm-years achieving and missing earnings targets as a result of DACC
We predict in H3 that DACC have the effect of increasing the proportion of firm-years reporting positive earnings levels, changes and surprises. We further predict in H4 and H5 that DACC increase the proportion of small positive earnings levels, changes and surprises, and reduce the proportion of small negative earnings levels, changes and sur- prises. These predictions are based on the hypoth- esised use of DACC to achieve basic earnings targets.
Preliminary evidence on these predictions is ob-
tained from Figure
zyxwvutsrqponmlkjihgfedcbaZYXWVUTSRQPONMLKJIHGFEDCBA
1 as discussed above. This fig-ure indicates that DACC increase the proportion of positive and, particularly, small positive earnings levels, changes and surprises, consistent with pre- diction. Also consistent with prediction, DACC re- duce the proportion of small negative earnings levels. However, contrary to prediction, DACC in- crease the proportion of small negative earnings changes and surprises. While the graphical evi- dence in Figure l clearly illustrates the effects of DACC, it does not indicate the statistical signifi- cance of these effects.
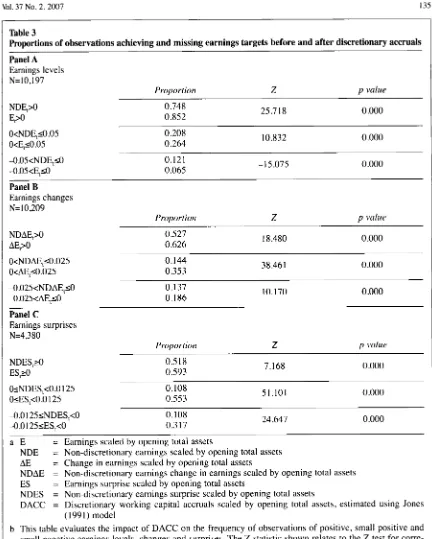
Table 3 reports the results of formal tests of the predictions we make in H3, H4 and H5. Panel A shows that DACC (which are mean zero: see foot- note 17) have the effect of significantly increasing the proportion of positive earnings levels from 74.8 to 85.2%. DACC also significantly change the proportions of firm-years with positive and negative earnings levels within 0.05 of opening TA. In the case of positive earnings levels within this range, the proportion increases from 20.8 to 26.4%. In the case of negative earnings levels within the same range, the proportion decreases from 12.1 to 6.5%. These changes are consistent with the prediction that DACC are used to manage earnings to achieve positive earnings levels and, in particular, to transform small negative earnings into small positive earnings.
Table 4 shows the impact of DACC in arriving at
Vol. 37 No. 2.2007
zyxwvutsrqponmlkjihgfedcbaZYXWVUTSRQPONMLKJIHGFEDCBA
135zyxwvutsrqponmlkjihgfedcbaZYXWVUTSRQPONMLKJIHGFEDCBA
Table 3
Proportions of observations achieving and missing earnings targets before and after discretionary accruals Panel A
Earnings levels
N= 10,197
zyxwvutsrqponmlkjihgfedcbaZYXWVUTSRQPONMLKJIHGFEDCBA
Proportion
zyxwvutsrqponmlkjihgfedcbaZYXWVUTSRQPONMLKJIHGFEDCBA
Z p valueNDE,>O ESO
0.748
0.852 25.718 0.000 O<NDE,sO.OS
O<E,s0.05
0.208
0.264 10.832 0.000 0.121
0.065
zyxwvutsrqponmlkjihgfedcbaZYXWVUTSRQPONMLKJIHGFEDCBA
- -15.075 0.000Panel B
Earnings changes N=10,209
Proportion Z p value
NDAE,>O AE,A
0.527
0.626 18.480 0.000 O<NDAE,s0.025
O<AE,s0.025
0.144
0.353 38.461 0
.ooo
0.1370.186 10.170 0
.ooo
Panel C
Earnings surprises N=4,380
Proportioil Z p value
NDES,rO ES,rO
0.5 I8
0.593 7.168 0
.ooo
OsNDES,<O.O I25OsES,<O.O 125
0.108
0.553 51.101 0.000 24.647 0.000 -O.O125sNDES,<O 0.108
-0.0125sES,<O 0.317 a E = Earnings scaled by opening total assets
NDE = Non-discretionary earnings scaled by opening total assets AE = Change in earnings scaled by opening total assets
NDAE = Non-discretionary earnings change in earnings scaled by opening total assets ES = Earnings surprise scaled by opening total assets
NDES = Non-discretionary earnings surprise scaled by opening total assets
DACC = Discretionary working capital accruals scaled by opening total assets, estimated using Jones
b This table evaluates the impact of DACC on the frequency of observations of positive, small positive and small negative earnings levels, changes and surprises. The Z statistic shown relates to the Z test for corre- lated proportions described by Kanji ( 1 9 9 3 , 4 8 4 9 ) . This test evaluates the impact of a given intervention on the proportion of observations satisfying a given criterion by measuring and comparing the proportion before and after the intervention. If the number of observations moving from no to yes relative to the crite- rion of interest is denoted by b, the number moving from yes to no denoted by c , and the total number of observations denoted by N, the test statistic is given by:
(1991) model
( h - c )
zyxwvutsrqponmlkjihgfedcbaZYXWVUTSRQPONMLKJIHGFEDCBA
/ NzyxwvutsrqponmlkjihgfedcbaZYXWVUTSRQPONMLKJIHGFEDCBA
( h + c , ) - ( h - c , ) 2 / N
zyxwvutsrqponmlkjihgfedcbaZYXWVUTSRQPONMLKJIHGFEDCBA
d
N ( N - I )c This statistic is evaluated against the standardised normal distribution. d All p values reported are two-tailed.
136
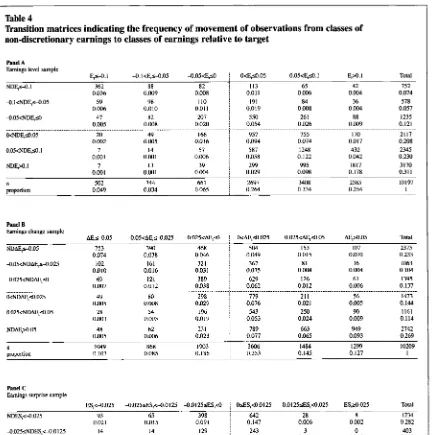
the earnings reported by firms. It takes the form of transition matrices (one each for levels, changes and surprises): rows show broad classes of non- discretionary (pre-managed) earnings, columns show such classes of reported earnings. Intersections of rows and columns show the num- ber of firm-years (and proportion of the total) moving from a particular NDE, (NDAE,, NDES,) class to a particular E, (AE,, ES,) class.
Panel A presents details of the frequency with which firms move from specific classes of non-
discretionary earnings, e.g
.
zyxwvutsrqponmlkjihgfedcbaZYXWVUTSRQPONMLKJIHGFEDCBA
NDE IzyxwvutsrqponmlkjihgfedcbaZYXWVUTSRQPONMLKJIHGFEDCBA
-0.1, to specif-ic classes of actual reported earnings, e.g. 0
<
E, I0.05. We would expect that firms use DACC to move from negative non-discretionary earnings to positive reported earnings, and for this to be par-
ticularly so for firm-years close to targets. Panel
A
zyxwvutsrqponmlkjihgfedcbaZYXWVUTSRQPONMLKJIHGFEDCBA
reveals that 14% of the entire sample move from negative non-discretionary earnings to positive earnings as a result of DACC. This compares to only 3.6% of the sample moving in the opposite direction, i.e. from positive non-discretionary earnings to negative earnings as a result of DACC?O thus emphasising the directionality in the use of DACC. Focusing specifically on those firms falling just short of target, i.e. in the range -0.05 <
NDE, I 0, the effect is even more pronounced:
72.8% of such firms report positive actual (post DACC) earnings ((550
+
261+
88) / 1,235),whereas only 11 .l% of those firms with NDE, just above break even, i.e. 0 <NDE, 10.05, move to negative earnings ((20 +49
+
166) / 2,117). Of par- ticular interest is the movement of firms closest to break even. Here 5.4% of the entire sample moves from negative non-discretionary earnings within 0.05 of opening TA to positive earnings within the same range, (i.e. the 550 firm-years in the lower left comer of the upper right quadrant). Although only a small proportion of the total sample, these 550 firm-years represent 44.5% of the 1,235 firm- years within this range.Table 4 Panel B reports the impact of DACC on the proportion of firm-years achieving and missing positive earnings changes. DACC significantly in- crease the proportion of firm-years achieving pos- itive earnings changes from 52.7% based on NDAE, to 62.6% based on reported earnings, i.e. row totals 1,473
+
1,161+
2,742 as a proportion of the total of 10,209 compared to the proportion rep- resented by the column totals 3,606+
1,484+
1,299. As with earnings levels, focusing specifical- ly on those firms falling just short of target, i.e.ACCOUNTING AND BUSINESS RESEARCH
-0.025
<
NDAE, I 0, reveals that 58.5% of suchfirms report positive actual (post DACC) earnings changes ((629
+
126+
61) / 1,395, whereas only29% of those firms with NDAE, just above target, i.e. 0 < NDAE, 10.025, move to negative actual earnings changes ((49
+ 80 +
298) / 1,473), again confirming a clear directional bias in movements. DACC also significantly increase the proportion of firm-years with small positive earnings changes, i.e. within 0.025 of opening TA from 14.4to 35.3%, i.e. row total of 1,473 for 0
<
NDAE,50.025 compared to column total of 3,606 for 0 <
zyxwvutsrqponmlkjihgfedcbaZYXWVUTSRQPONMLKJIHGFEDCBA
AE,
50.025.These results are consistent with DACC being used to achieve positive earnings changes. However, contrary to prediction, DACC signifi- cantly increase the proportion of negative earnings changes within 0.025 of opening TA from 13.7%
(row total of 1,395 for -0.025 < NDAE, I 0 to
18.6% (equivalent AE, column total of 1,903). This result reflects the visual impression conveyed by Figure 1.
One potential reason for DACC increasing the proportion of firm-years with small negative earn- ings changes is the use of DACC to smooth earn- ings. Smoothing would be reflected by the use of DACC to dampen fluctuations in earnings, i.e., to reduce the magnitude of earnings changes. Table 4
Panel B shows that 789 (i.e. 468
+
321), or 41.5%,of the 1,903 firm-years with actual negative earn- ings changes within 0.025 of opening TA use DACC to reduce the magnitude of a larger nega- tive earnings change. If these observations were excluded, the proportion of firm-years with small negative earnings change would move from 13.7
(row total, as before) to 10.9% (the -0.025
<
AE,
I
) column total of 1,903 minus the 789 firm-years specified above) as a result of DACC. In other words, if firm-years dampening the magnitude of large negative earnings change are excluded, DACC have the effect of reducing the proportion of firm-years with small negative earnings changes, as predicted.
It is important to note that, even if firm-years dampening the magnitude of large positive earn- ings change are excluded, DACC still have the predicted effect of increasing the proportion of firm-years with small positive earnings changes. In this case, the proportion concerned increases from 14.4 to 22.3% (compare row total of 1,473 as before with column total 3,606 minus 789
+
543,the firms reducing large NDE changes by the use of DACC)
.
Table 4 Panel B also indicates that 20.2% of the entire sample use DACC to move from negative to positive earnings changes, i.e. the cases in the top right-hand quadrant. These 2,059 firm-years repre- sent 42.6% of all firm-years with negative non-dis- cretionary earnings changes, i.e. 2,059 as a
2o The 14 % comprise those observations in the upper right
quadrant of the panel, i.e., those firms having negative NDE
but reporting positive E (I13
+
191+
550+
65+
84 +2 61 +42
+
36+
88) / 10197. The 3.6 % comprise those observations in the lower left quadrant, i t . those having positive NDE butreporting negative E (20
+
7+
7+
49+
I4+
I3+
I66+
5zyxwvutsrqponmlkjihgfedcbaZYXWVUTSRQPONMLKJIHGFEDCBA
7+ 39) / 10197.Vol.
zyxwvutsrqponmlkjihgfedcbaZYXWVUTSRQPONMLKJIHGFEDCBA
37 No. 2.2007 137Table 4
'kansition matrices indicating the frequency of movement of observations from classes of
non-discretionary earnings to classes of earnings relative to target
zyxwvutsrqponmlkjihgfedcbaZYXWVUTSRQPONMLKJIHGFEDCBA
Panel A
zyxwvutsrqponmlkjihgfedcbaZYXWVUTSRQPONMLKJIHGFEDCBA
Earnings level sample
N D W . 1 362 88 j 113 65 [email protected] -O.I<E,s4.05 4 . 0 5 < E , d ~ O<E$.05 0.05<E,d.I
0.006 82 I
0.036 0 SiQ9 0.008 j 0.011
4.I<NDE,sO.O5 59 98 110 ! , 191 84 0.006 0.010 0.011 j 0.019 0.008
4 . 0 5 < N D E , d 47 82 207 j
zyxwvutsrqponmlkjihgfedcbaZYXWVUTSRQPONMLKJIHGFEDCBA
550 26 1zyxwvutsrqponmlkjihgfedcbaZYXWVUTSRQPONMLKJIHGFEDCBA
[image:16.540.55.487.86.521.2]0.005 0.008 0.020 i 0.054 0.026 0.002 0.005 0.016 0.094 0.074
... ~~ ... ~~ ...
O<NDE,d.OS 20 49 166 j 957 755 O.OS<NDE,d. I 7 14 57 ~ 587 1248
0.001 0.001 0.006 j 0.058 0.122
NDEp3.I 7 I3 39 j 299 995
0.001 0.001
zyxwvutsrqponmlkjihgfedcbaZYXWVUTSRQPONMLKJIHGFEDCBA
0.004 1 0.029 0.098n 502 344 66 1 ! 2697 3408 vromrtion 0.049 0.034 0.065 i 0.264 0.334
F0.l Total 42 752
0.004 0.074 36 578 0 .004 0.057
88 1235 0.009 0.121
I70 2117 0.017 0.208 432 2345 0.042 0.230 1817 3170 0.178 0.31 I 2585 10197 0.254 1 . .. .... . ... ... .... ... .... .... .... . ... .... ... ....
Panel B
zyxwvutsrqponmlkjihgfedcbaZYXWVUTSRQPONMLKJIHGFEDCBA
Earnings change sample
4 s O . 0 5 4.05<aE,~O.025 4 . 0 2 5 & , d j 0 4 E , d . 0 2 5 0.025&$.05 AE9.05 Total
NDAE+4.05 753 390 468 j 504 153 I07 2375 0.074 0.038 0.046 ~ 0.049 0.015 0.010 0.233
4.05<NDAEpX.025 I02 161 321 ! , 362 81 36 1063
0.010 0.016 0.031 j 0.035 0.008 0.004 0.104
4.025<NDAE$l 69 121 389 ~ , 629 I26 61 1395
O&DAE,d.O25 49 80 298 j 779 21 I 56 1473 0.005 0.008 0.029 j 0.076 0.021 0.005 0.144
0.007 0.012 0.038 j 0.062 0.012 0.006 0.137
... ~.. ... ... > ...
0.025<NDAE$l.05 28 54 196 1 543 250 90 1161 0.003 0.005 0.019 j 0.053 0.024 0.009 0.114
N D w . 0 5 48 62 231 ~ , 789 663 949 2742
0.005 0.006 0.023 j 0.077 0.065 0.093 0.269 n 1049 868 1903 3606 1484 I299 10209 proportion 0.103 0.085 0.186 I 0.353 0.145 0.127 1
Panel C
Earnings surprise sample
ES,<4.025 -0025&S,<4.0125 4).0125sES,<O i O&S,<O.O125 0.0125~ES,<O.025 [email protected] Total NDES,<-0025 93 65 398 j 642 28 8 1234 0.021 0.015 0.091 ~ 0.147 0.006 0.002 0.282
4.025dNDES,<4.0 I25 14 14 129 i 243 3 0 403 4.0125WDES,d) 9 12 147 i , 290 12 4 474
0.003 0.003 0.029 i 0.055 0.001 0 . W 0.092 0 002 0.003 0.034 ! 0.066 0.003 0.001 0.108
... ... > ... ~ ...
O&TDES,<O.OI 25 6 14 147 j 286 19 I 473
0.001 0.003 0.034 i 0.065 0.004 0 .W 0.108
0.0 I25sNDES,<O.025 5 12 123 j 281 I I 0 432 0.001 0.003 0.028 i 0.064 0.003 O.Oo0 0.099
[email protected] 29 I20 445 I
proportion 0.036 0.054 0.317 i 0.553 0.032 0.008 1 ~ 681 67 22 1364
0.015 0.005 0.311 n 156 237 1389 i 2423 1 4 0 35 4380
0.007 0.027 0.101 j 0.155
E = Earnings scaled by opening total assets
NDE = Non-discretionary earnings scaled by opening total assets AE = Change in earnings scaled by opening total assets
NDAE = Non-discretionary earnings change in earnings scaled by opening total assets
FS = Earnings surprise scaled by opening total assets
NDES = Non-discretionary earnings surprise scaled by opening total assets
DACC = Discretionary working capital accruals scaled by opening total assets, estimated using Jones (1991) model
138
zyxwvutsrqponmlkjihgfedcbaZYXWVUTSRQPONMLKJIHGFEDCBA
proportion of the relevant row totals of 2,375
zyxwvutsrqponmlkjihgfedcbaZYXWVUTSRQPONMLKJIHGFEDCBA
+
1,063
+
1,395. Again focusing specifically on those firms close to the target, in this case match- ing the prior year’s result; of the entire sample, 6.2% of all firm-years move from negative non- discretionary earnings changes within 0.025 of opening TA to positive earnings changes within a similar range (i.e. the bottom left figure in the upper right quadrant). Of the 1,395 firm-years with small negative non-discretionary earnings changes within this range, 58.5% actually report positive earnings changes with the aid of DACC ((629+
126
+
61) / 1,395).In a similar manner, in Table 4 Panel C, we as- sess the impact of DACC on the proportion of firm-years meeting and missing analyst forecasts. This panel indicates that DACC significantly in- crease the proportion of firm-years with positive earnings surprises from 51.8 to 59.3%, i.e. the row totals 473
+
432+
1,364 (being the firm-years with NDES above zero) compared to the column totals 2,423+
140+
35 (the firm-years with ES above zero), both totals being divided by 4,380. Strikingly, and in accordance with our prediction, DACC greatly increase the proportion of firm- years with small positive earnings surprises, with- in 0 .O 125 of opening TA, from 10.8 to 55.3 % (i .e.the row total for 0 < NDES,
zyxwvutsrqponmlkjihgfedcbaZYXWVUTSRQPONMLKJIHGFEDCBA
s 0.0125 compared tothe column total for 0 < ES,
zyxwvutsrqponmlkjihgfedcbaZYXWVUTSRQPONMLKJIHGFEDCBA
I 0.0125, However,contrary to prediction, DACC increase the propor- tion of firm-years with negative earnings surprises within a similar range from 10.8 to 31.7%.
As suggested earlier for earnings, this last point is potentially explained by the use of DACC to re- duce the magnitude of large negative earnings sur- prises. Table 4 Panel C shows that DACC have the effect of facilitating 12% of the sample (398
+
129) moving from a larger negative surprise to one within 0.0125 of opening TA. However, even if these observations are excluded, DACC still have the effect of increasing the proportion of small negative earnings surprises from 10.8% (the row total, as before) to 19.6% (the column total of 1,389 minus 398
+
129), contrary to prediction. Clearly, however, the increase is less dramatic when these observations are excluded.Tabl