PT DSN Tbk 9-M onth 2014 Results Update
he DSN Group was originally established as a wood products manufacturer. We identified an opportunity to expand into the plantation sector in 1997, building upon our established relationships within the local communities. Both of these business segments are showing growth, but the palm oil business is growing, and will continue to grow, at a higher rate.
Palm oil accounted for 64% of total revenue in 2013, up from 59% in 2012, and 73% of 9-month 2014 revenue driven by recently higher CPO average selling prices.
Our history of expansion has accelerated in recent years, with the acquisition of eight new oil palm estates since 2010.
We also took a controlling interest in Tanjung Kreasi Parquet Industry, a manufacturer of globally branded engineered flooring in 2012. hese subsidiaries provide long-term
opportunities for expansion in both of our core businesses.
Crude Palm Oil
Palm Kernel
Palm Kernel Oil
Block Board
Engineered Doors
Engineered Floors
Re ve nue 9Mo ' 14 2013 2012 2011 2010
Palm O il 73% 64% 59% 55% 55%
Estate Pro vince
DBL 2013 Pap ua
DIL 2009 N. Kal.
SWA 2001 E. Kal. DAN 1997 E. Kal. DIN 1997 E. Kal. DWT 2007 E. Kal. KPS 2011 E. Kal.
MAL 2012 W. Kal. RUT 2012 W. Kal.
KAP 2010 W. Kal. PSA 2010 W. Kal. DPS 2010 W. Kal.
PUL 2012 E. Kal.
PWP 2004 C. Kal.
To tal Ye ar
Acq uire d
Land Are a (' 000 Ha) Ave rag e Ag e (Yrs) Yie ld
To tal Plante d Mature Availab le HGU Panitia B
Ijin Lo kasi
To tal Are a
Mature Are a*
2013 (t/ ha) 16.7
- - 16.7 - -
-8.0
2.4 - 5.5 1.2 -
-16.9
15.3 15.3 1.6 13.7 13.7 30.4 10.0
9.0 8.9 1.0 7.9 7.9 25.9 9.8
8.7 8.7 1.0 7.9 7.9 28.2 13.6
10.1 7.3 3.5 4.3 5.2 22.4 6.2
5.2 2.1 1.0 2.9 5.4 12.7
15.0
- - 15.0 - - -12.7
- - 12.7 - -
-14.9
1.2 - 13.7 1.2 - -10.6
0.4 - 10.2 1.0 - -6.1
0.7 - 5.4 0.1 -
-17.0
- - 17.0 - -
-15.2
8.4 5.7 6.7 4.4 5.2 19.7
172.5
61.5 48.0 111.1 38% 8% 54% 7.3 8.9 26.4
* As o f ye ar-e nd 2014 Land Rig hts Status
0 10 20 30 40 50 60
We st
Kalimantan
Ce ntral
Kalimantan
No rth
Kalimantan
East
Kalimantan
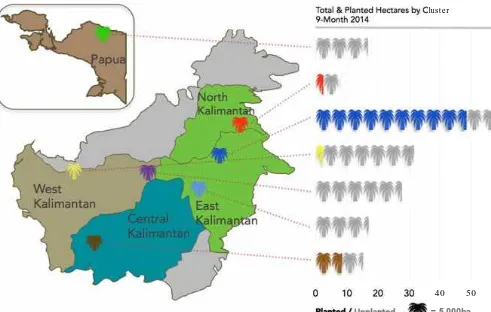
Our estates are clustered across East, West and Central
Kalimantan, with planting to date concentrated in the East
Pap ua
To tal & Plante d He ctare s b y Cluste r 9-Mo nth 2014
Planted/Unplanted = 5,000ha
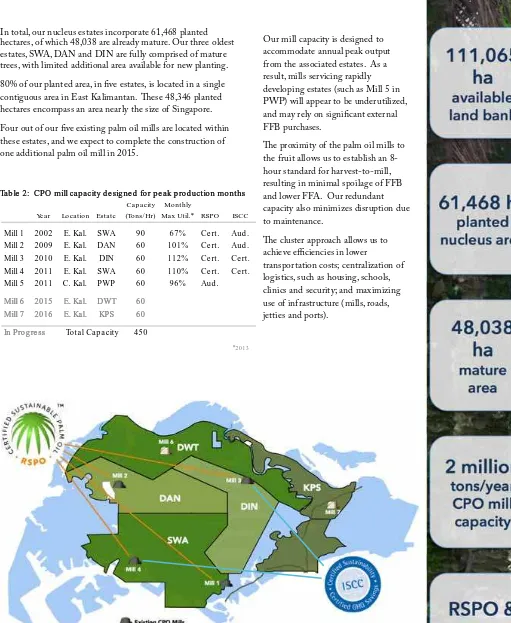
Cap acity Mo nthly
Ye ar Lo catio n Estate (To ns/ Hr) Max Util.* RSPO ISCC Mill 1 2002 E. Kal. SWA 90 67% Ce rt. Aud . Mill 2 2009 E. Kal. DAN 60 101% Ce rt. Aud . Mill 3 2010 E. Kal. DIN 60 112% Ce rt. Ce rt. Mill 4 2011 E. Kal. SWA 60 110% Ce rt. Ce rt. Mill 5 2011 C. Kal. PWP 60 96% Aud .
Mill 6 2015 E. Kal. DWT 60 Mill 7 2016 E. Kal. KPS 60 In Pro g re ss To tal Cap acity 450
*2013
M ill 2
M ill 3
DWT
SWA DAN
M ill 1 M ill 4
M ill 6
M ill 7
Trans - East Kalimantan Road Existing CPO M ills
Planned CPO M ills
DIN
KPS
Our most developed cluster - with 5 estates, 4 CPO M ills and
56,000 ha - is nearly the size of Singapore
Our mill capacity is designed to accommodate annual peak output from the associated estates. As a result, mills servicing rapidly developing estates (such as Mill 5 in PWP) will appear to be underutilized, and may rely on significant external FFB purchases.
he proximity of the palm oil mills to the fruit allows us to establish an 8-hour standard for harvest-to-mill, resulting in minimal spoilage of FFB and lower FFA. Our redundant capacity also minimizes disruption due to maintenance.
he cluster approach allows us to achieve efficiencies in lower
transportation costs; centralization of logistics, such as housing, schools, clinics and security; and maximizing use of infrastructure (mills, roads, jetties and ports).
Tab le 2: CPO mill cap acity d e sig ne d fo r p e ak p ro d uctio n mo nths In total, our nucleus estates incorporate 61,468 planted hectares, of which 48,038 are already mature. Our three oldest estates, SWA, DAN and DIN are fully comprised of mature trees, with limited additional area available for new planting.
80% of our planted area, in five estates, is located in a single contiguous area in East Kalimantan. hese 48,346 planted hectares encompass an area nearly the size of Singapore.
Four out of our five existing palm oil mills are located within these estates, and we expect to complete the construction of one additional palm oil mill in 2015.
111,065
ha
available
land bank
61,468 ha
planted
nucleus area
48,038
ha
mature
area
2 million
tons/ year
CPO mill
capacity
Our plantations have a young age pro
fi
le and will deliver
productivity growth in coming years
Planted / Planned = 500 ha
We added 5,800 hectares of nucleus in 2013, out of a total of 9,170 hectares planted during the year. hrough Q3 2014, we have planted an additional 3,606 hectares of nucleus and 2,488 hectares of plasma.
We intend to maintain the current pace of expansion through 2016, with roughly 10,000 hectares planted each year, including nucleus and plasma.
In total, our 61,468 hectares of planted nucleus were an average age of 7.3 years at the end of Q3 2014. his will drop to 7.0 years by year-end based upon our proposed planting schedule.
By 2016, our average age is expected to increase to 7.5 years. DSN Nucle us Planting Histo ry (‘000 ha)
0 2 4 6 8
'16
'15
'14
'13
'12
'11
'10
'09
'08
'07
'06
'05
'04
'03
'02
'01
'00
'99
'98
'97
'96
Mid -Ye ar vs. Ye ar-End Stand ard
In 2011, the Co mp any ad o p te d a Mid -Ye ar Stand ard (MYS) ap p ro ach to d e te rmining the ag e o f o ur p lantatio ns fo r acco unting p urp o se s. Using the MYS, tre e s p lante d in H2 o f the p re vio us ye ar and H1 o f the curre nt ye ar will b e co nsid e re d 1-ye ar o ld at the clo se o f the ye ar – a re aso nab le e stimate o f the ave rag e amo unt o f time the se tre e s have b e e n in the g ro und .
We have p re se nte d o ur p lanting histo ry with an H1/ H2 b re akd o wn, sho uld yo u care to ap p ly Ye ar-End Stand ard ap p ro ach inste ad . All o f the d ata p re se nte d within o ur financial re p o rts and this p re se ntatio n make use o f the MYS fro m 2011 to the p re se nt.
Our strong commitment to our plasma holders is one critical element in the success of DSN’s palm oil activities, generally fostering easier acquisition of land, facilitating title conversion, and minimizing the prospect of local disturbances or social unrest.
Our BoT model, encompassing 75% of our plasma areas, has resulted in higher FFB yields and, therefore, higher revenues for our plasma cooperatives. DSN still benefits from the milling margin and gains assurance that the loans to plasma holders can be repaid.
5% of total FFB revenues are retained by DSN as a
management fee. Of the remainder, 30% is paid to the plasma holder, while 70% services bank loans and funds extended by DSN for upkeep and maintenance of the estate prior to breaking even.
DSN typically funds the development of plasma estates through bank loans with repayment schedules comprising a 4-year grace period and 6-4-year repayment.
Our cost to maturity is roughly $5,000 per hectare, with an
additional $2,000 per hectare for mill construction
7.0 years
Annual Planting Pe rfo rmanceNucle us Estate s
As our plantations age, we intend to implement a planting schedule sufficient to maintain a favorable long-term maturity profile. In general, our cost to maturity for new planting is roughly $5,000 to $5,500 per hectare.
Cap ital Exp e nd iture s 2013 2012 2011 2010
Immature Plantatio ns 335 294 353 224 Co nstructio n in Pro g re ss 182 482 282 128
O the rs 146 131 308 133
To tal 663 907 942 485
We also plan to match the increased FFB production over time with appropriate increases in CPO processing capacity. A new mill is required for every 10,000 additional mature hectares. At a cost of roughly $18 - $20 million per mill, this adds another $1,800 to $2,000 to development costs per hectare.
Immature
Yo ung Mature
Prime Mature
O ld Mature
0 2 4 6 8 10 12 14
0 5 10 15 20 25 30 35
0 2 4 6 8 10 12 14 16 18 20 22 24 26
Our planting schedule through 2016 implies an average
10% annual growth in FFB to 2 million tons in 2020
Assuming no p lanting afte r 2016 = 500 ha Ag e o f Tre e s
FFB Yie ld (t/ ha) Ag e Pro file (‘000 ha)
So urce : Ind o ne sian Palm O il Re se arch Institute
Class II
Class III
Class I
0.0 0.5 1.0 1.5 2.0
'10 '11 '12 '13 '14 '15 '16 '17 '18 '19 '20
FFB Vo lume (mn t)
Class II
Class III
= DSN Annual Nucle us Yie ld
Summary Maturity Pro file (Mid -Ye ar Stand ard ) and Yie ld Pro je ctio n Mature Are a (%)
Ye ar-End Yo ung Prime O ld To tal ' 000 ha % Δ Avg Ag e
2010 43.0 38.3 18.7 - 57.0 26.7 7.5
2011 34.6 46.6 18.8 - 65.4 32.3 21 7.7
2012 26.3 49.5 24.2 - 73.7 38.4 19 8.0
2013 24.6 46.8 28.7 - 75.4 43.6 14 8.4
2014 25.2 41.9 32.9 - 74.8 48.0 10 8.9
2015 28.7 33.8 34.9 2.6 71.3 50.8 6 9.6
2016 30.7 28.3 35.2 5.8 69.3 54.7 8 10.1
2017 23.5 27.9 42.3 6.2 76.5 60.4 10 10.4
2018 15.1 29.7 47.0 8.2 84.9 67.1 11 10.7
2019 5.9 33.3 51.2 9.6 94.1 74.3 11 10.9
2020 - 35.6 53.3 11.1 100.0 82.2 11 11.2 Mature Are a Immature
Are a (%) Class II Class III % Δ
20.9 18.5
21.5 19.0 3
21.9 19.5 3
22.8 20.3 4
23.7 21.2 4
24.9 22.3 5
25.3 22.7 2
25.0 22.5 -1
24.6 22.2 -1
24.3 21.8 -2
24.1 21.6 -1
Stand ard FFB/ ha
0
Immature
Yo ung Mature
Prime Mature
0
Our target is to achieve lab standard FFB yields on a
commercial scale within each of our estates
Our five largest estates (DAN, DIN, SWA, PWP and DWT) have performed better than the standard expected yields over the past few years. DSN’s estates are generally a combination of Class II and Class III type soils. We have neither Class I soil (largely found in volcanic areas such as Sumatera) nor Class IV soil. As a matter of policy, we do not plant in peat soil. Our performance is driven by a disciplined approach to standard agronomic practices, ranging from selecting the best seeds, to formulating multiple unique fertilizer blends, to the use of cover crops to retain soil and natural predators to control mice and caterpillars, thereby allowing us to minimize the use of harmful pesticides.
In 2013, DSN produced 1.15 million tons FFB from nucleus estates, with an additional 88 thousand tons from plasma operations. In aggregate, FFB output increased by 22% during the year, with a nucleus yield of 26.4 tons per hectare versus 25.5 tons in the preceding year.
hrough Q3 2014, our nucleus estates produced 920 thousand tons FFB. his aggregate increase of 11% comes from higher yields (up 1.1%) and a larger mature area (up 10.1%).
Plasma yields rose by 13.2% from the same period in 2013, with mature areas growing by 26.2% and total output up by 42.9%.
Pro d uctio n Pe rfo rmance - Mills
O ur 5 mills achieved an aggregate O ER of 24.3% last year,
resulting in a CPO yield of 6.4 tons per mature hectare
In total, FFB processed and CPO produced each increased by 31% in 2013, yielding a stable Oil Extraction Rate (OER) of 24.3%.
Palm Kernel production rose 21% to 43,277 tons in 2013. Sales declined, however, to 15,623 tons as our newly commissioned Palm Kernel Oil mill began to utilize this output directly. In our first year of operation, our PKO mill produced 13,500 tons, and generated sales of 9,400 tons of PKO.
For 9-months 2014, we achieved an OER of 23.9%, slightly below the previous year’s 9-month performance. Palm kernel production rose 28% to 39 thousand tons, while PKO output reached 12.8 thousand tons, up from 8.6 thousand tons in 9-month 2013.
We processed a total of 1,381 thousand tons of FFB in 2013, 90% of which was sourced from our own nucleus or plasma estates.
External purchases increased by nearly 182% in order to better utilize capacity at our newest Mill 5, servicing the PWP estate. By Q3 2014, we had processed 1,206 thousand tons of FFB, up 26.1% from Q3 2013. Of that total, 83% was sourced from our nucleus and plasma operations.
Our CPO production quality remained exceptional over the course of 2013, with aggregate Free Fatty Acid (FFA) levels of just 2.65%.
hrough 9-months 2014, over 65% of our production was sold as Super CPO, with FFA levels below 3%. his output services refiners’ higher-quality products, and as such we receive a minimum of a 1.0% premium over spot prices for these sales.
5
DSNG CPO Q uarte rly ASP, 2010-2014
Expanding domestic re
fi
ning capacity, coupled with our
high-quality product, ensures robust demand for our CPO
Our customers are primarily Indonesia. We expect Astra’s new refinery on Sulawesi Island to become a customer in the near future as well. Our contracts are open tender, with SMART and Wilmar typically offering better pricing - due to refinery location –and terms
For 9-months 2014, we sold 294 thousand tons of CPO, 23% higher than the same period in 2013. Our average selling price of Rp8.5 million per ton was 28% above 9-month 2013 and 20.9% higher than the average for the full year.
O ur cash cost of sales for CPO declined 11% in 2013,
partially offsetting the broadly lower ASPs
3.8
million rp/ t
in 2013
Co st o f Sale s 2013 2012 2011 2010
CPO Sale s (' 000 t) 336.2 252.5 189.7 135.3
Fe rtilize r 288.7 326.7 193.7 161.1
Lab o r 336.0 274.3 166.1 107.2
O the rs 244.7 224.3 227.4 210.8
FFB Purchase d 294.1 179.1 69.0 30.1
Milling 99.5 65.1 33.6 39.4
To tal cash co st 1,263.0 1,069.5 689.7 548.6
Cash Co st/ To n 3.76 4.23 3.64 4.05
% o f to tal 2013 2012 2011 2010
Fe rtilize r 22.9% 30.5% 28.1% 29.4%
Lab o r 26.6% 25.6% 24.1% 19.5%
O the rs 19.4% 21.0% 33.0% 38.4%
FFB Purchase d 23.3% 16.7% 10.0% 5.5%
Milling 7.9% 6.1% 4.9% 7.2%
Cash Co st o f Sale s (IDR b n) Our cash cost in 2013 declined to Rp3.76 million per ton of
CPO sold, a drop of 11.3% from 2012.
Absolute fertilizer costs fell by nearly 12%, despite an increase in planted and mature hectares, and account for roughly 23% of total cash costs.
We purchase compound fertilizer – comprised of potash, nitrogen, and phosphate – under annual contracts with four-monthly delivery. Our unit costs per ton ranged from $525 to $570 in 2013. New contracts covering our entire 2014 supply have already been concluded at prices between $320 and $425 per ton.
DSN is also a leading wood products manufacturer with
reputable brand names & long-standing client relationships
Custo me r Name Typ e Pro d ucts Re latio nship Ge o g rap hy
S.A. Shahab & Co mp any Pte Ltd Trad e r Pane ls 11 ye ars Mid d le East Sumito mo Fo re stry Co mp any Ltd . Trad e r Pane ls 8 ye ars J ap an Vintag e Hard wo o d Flo o ring Distrib uto r Eng ine e re d Flo o ring 9 ye ars Canad a J iang su Skyrun Arse r Co ., Ltd Trad e r Pane ls 3 ye ars China Asia Trad ing , Inc Trad e r Pane ls 7 ye ars J ap an Asso ciate d Lumb e r & Trad ing , Ltd Trad e r Pane ls 5 Ye ars J ap an PKF Glo b al Trad e r Eng ine e re d Do o rs 15 ye ars UK Plyq ue t Ho lzimp o rt Distrib uto r Eng ine e re d Flo o ring 17 ye ars Euro p e Te ka Ko re a Co ., Ltd Distrib uto r Eng ine e re d Flo o ring 12 ye ars So uth Ko re a Be ijing Te ka Ho ly Eag le Co rp o ratio n Distrib uto r Eng ine e re d Flo o ring 11 ye ars China To p 10 Ind ustrial and Co mme rcial Custo me rs
DSN is the fourth largest wood products manufacturer in Indonesia, producing panels, engineered floors and doors.
We have initiated a move into higher value, higher margin products through the recent acquisition of TKPI, which specializes in engineered flooring. We continue to leverage on our long standing relationships with customers to across the world to leverage this new business initiative.
9M-2014 9M-2013 YoY Δ%
Sale s Vo lume
Pane l (m3) 149,873 195,105 -23.2 Eng ine e re d d o o rs (p cs) 37,777 40,525 -6.8 Eng ine e re d flo o rs (m2) 878,967 792,209 11.0
Ave rag e Se lling Price (IDR mn)
Pane l (m3) 4.32 3.85 12.3 Eng ine e re d d o o rs (p cs) 1.19 1.02 17.1 Eng ine e re d flo o rs (m2) 0.36 0.30 20.7
2013
244,642
51,989 1,073,412
3.97
1.06
0.31
4,000,000
m2/ annum
fl
ooring
capacity
450,000
m3/ annum
panel
capacity
Our diverse exposure to customers in different segments and geographies has protected us to from adverse economic impacts as we maintain and grow our wood products business.
For wood products, we have sufficient capacity to meet our current growth plans. We intend to more than double production volume in engineered flooring from 1.1 million m2 in 2012 to 2.6 million m2 by 2015, while our plant currently has capacity to produce up to 4 million m2.
We will be optimizing our wood products efficiency by relocating and consolidating our operations in Surabaya and Gresik to a new panel products processing plant in Lumajang by 2015. his is closer to our satellite plants and will reduce our transportations costs.
11.0%
growth in
fl
ooring
sales volume
20.7%
increase in
Q 3 2014 De b t Po sitio n IDR Bn
To tal De b t 3,253 Ne t De b t 2,392
Eq uity 2,161
EBITDA 1,026
Financial Ratio s:
De b t/ Eq uity 1.5 Ne t De b t/ Eq uity 1.1 Ne t De b t/ EBITDA 1.8
Lo ans O utstand ing IDR Bn US$ MM
Re vo lving Lo an 289 28 Curre nt Po rtio n o f LT De b t 305 11 Lo ng Te rm De b t 1,896 22 Finance Le ase s 2 1
To tal 2,202 34 To tal (IDR b n) 9-Mo ' 14 9-Mo ' 13 2013 2012 2011 2010
Re ve nue 3,726 2,681 3,842 3,411 2,778 1,751 EBITDA 1,026 549 888 666 665 297 EBITDA Marg in 27.5% 20.5% 23.1% 19.5% 24.0% 17.0%
Ne t Pro fit 522 123 216 252 374 162 Ne t Marg in 14.0% 4.6% 5.6% 7.4% 13.5% 9.3%
Palm O il
Re ve nue 2,711 1,651 2,478 1,997 1,524 971 EBITDA 1,023 505 885 614 652 307 EBITDA Marg in 37.7% 30.6% 35.7% 30.8% 42.8% 31.7%
Pro fit Be fo re Tax 795 259 517 416 547 260 PBT Marg in 29.3% 15.7% 20.9% 20.9% 35.9% 26.8%
Wo o d Pro d ucts
Re ve nue 1,016 1,030 1,364 1,414 1,254 780 EBITDA 69 83 73 123 63 26 EBITDA Marg in 6.8% 8.1% 5.4% 8.7% 5.0% 3.3%
Pro fit Be fo re Tax (5) (16) (80) 33 12 (5) PBT Marg in -0.5% -1.6% -5.9% 2.3% 0.9% -0.6%
DSN’s 9-month revenue of Rp3,726 billion is 39% than
2013, with EBITDA growing by 87% as margins expand
The d e cline in Ne t Pro fit in 2013, d e sp ite sig nificant incre ase s in re ve nue and EBITDA, is larg e ly d ue to the imp act o f ye ar-e nd d e p re ciatio n o f the rup iah ag ainst the d o llar. The mark-to -marke t o f o ur $70 millio n FX lo ans o utstand ing re sulte d in an unre alize d FX lo ss o f Rp 172 b illio n.
No te : Annual Financial State me nts are aud ite d b y Sid d harta & Wijaja, Re g iste re d Pub lic Acco untants, and a Me mb e r Firm o f KPMG Inte rnatio nal.
39%
YTD growth
in total
revenue
1.1x
Net debt to
equity
Rp1,026
billion in
EBITDA
37.7%
EBITDA
margin in
palm
business
Rp522
billion in net
pro
fi
t
1.8x
Net debt to
Our commitment to social and environmental responsibility
is integral to the sustainability of our operations
Corporate Social Responsibility
DSN is committed to a wide range of CSR programs, and we continuously engage and support the communities within which we operate.
We maintain active partnerships with more than 20 cooperatives of smallholders near our plantations to manage a total of 12,666 ha of planted area under our Plasma Program. his program helps increase the productivity of our plasma by leveraging on DSN’s expertise in plantation operations.
We exclusively employ local contractors and cooperatives for all of our transportation, construction, and other non-core services. We have been instrumental in fostering the development of these small businesses and rely on them to the extent that we do not own any trucks for the transport of FFB to our mills.
We continue to promote literacy by making education accessible through the establishment of schools in our plantation areas as well as community learning centers in the surrounding villages with the help of the University of Sanata Dharma.
We have also provided free medical services to all our employees and our local communities since we started operations, with a network of clinics across our estates.
Our successful implementation of these and other CSR programs has resulted in no demonstrations or operational disturbances over the last 3 years by the local population or NGOs.
Environmental Responsibility
We and our subsidiaries involved in the palm oil business are members of the Roundtable on Sustainable Palm Oil (RSPO), and strive to comply with global RSPO and the Indonesian Sustainable Palm Oil (“ISPO”) principles.
We have received RSPO certification for our SWA, DAN and DIN palm oil plantations along with their respective mills, and have completed the RSPO and ISPO audit process in December 2013 for all our mills and their respective estates. We have also completed the ISCC audit, facilitating sales of our CPO for biofuels.
We are also committed to protecting our environment. We have set aside 6,600 hectares of land, or an area roughly equivalent to 10% of our total planted area, for conservation purposes. We comply with various domestic and international
environmental standards in our wood products manufacturing processes, and seek to ensure that all the logs and sawn timber purchased for our operations are produced from sustainable forest resources.
9-M onth 2014 Summary Financials
EBITDA 1,026 549 86.9 327 430
% margin 27.5 20.5 32.4
EBITDA 1,023 505 102.8 351 413
% margin 37.7 30.6 39.8 43.1
Financial Po sitio n Q 3-2014 Q 2-2014
Palm O il Summary 9M-2014 9M-2013 YoY Δ% Q 3-2014 Q 2-2014
9-M onth 2014 Operations Summary
0.0 0.2 0.4 0.6 0.8 1.0 1.2 1.4 1.6 1.8 2.0
14-J un-13 14-Se p -13 14-De c-13 14-Mar-14 14-J un-14 14-Se p -14 DSNG Daily Share Price (rp / share ) & Trad ing Vo lume (share s)
DSNG Share Price vs. IDX & Ag ri Ind e x
DSNG
Ag ri
IDX
Fo r ad d itio nal info rmatio n,
p le ase re fe r to o ur we b site at:
www.d sn.co .id
If yo u have ad d itio nal q ue stio ns
o r re q ue sts, yo u may co ntact us
at:
inve sto r.re latio ns@d sng ro up .co .id
DSNG Share ho ld e rs (%) O e to mo Family 29.8Rachmat Family 27.0
Salim Lim Family 8.9
Sub ianto Family 7.5 Co mmissio ne rs & Dire cto rs 9.6 O the rs & Pub lic 17.2
as o f 30 Se p te mb e r 2014
0 500 1,000 1,500 2,000 2,500 3,000 3,500 4,000