The long-run performance of initial public offerings:
comparison between shari’ah and non shari’ah-based firms
Suherman1 and Agung D. Buchdadi2
1,2 Faculty of Economics State University of Jakarta
Mail address: Building R, jalan. Rawamangun Muka, Jakarta Timur, Indonesia Telp.: +62 21 4721227, fax.:+62 21 4706285
e-mail: [email protected] e-mail: [email protected]
Comments welcome
comparison between shari’ah and non shari’ah-based firms
Abstract
This paper empirically investigates the difference of the performance between shariah-based and non shariah-based firms that listed on the Jakarta Stock Exchange (JSX) during the period July 2001 to December 2005. The results show that, when using equally-weighted cumulative abnormal return (EW-CAR) and equally-weighted buy-and-hold abnormal return (EW-BHAR), the long-run performance of IPOs return between shariah and non shariah firms are significantly different. However, the significance disappears when the returns are calculated with value-weighted cumulative abnormal return CAR) and value-weighted buy-and-hold abnormal return (VW-BHAR). Further, the results show that shariah-based firms outperform the market in almost every month for two years, except month 7 and 10 when using VW-CAR. However, non shariah-based firms
In recent years, the academic community has closely examined and intensely debated the performance of IPOs, particularly in the long-run. The analysis of the long-run returns is directed towards a methodological approach. Thus, Barber and Lyon (1997), Kothari and Warner (1997), Brav and Gompers (1997), Fama (1998), Lyon, Barber and Tsai (1999), Loughran and Ritter (2000), Gompers and Lerner (2003), Ang, Gu, and Hochberg (2005), and Ahmad-Zaluki, Campbell, and Goodacre (2007) have argued that the method of performance measurement influences both the magnitude of the abnormal returns as well as the size and power of the statistical test.
Our research sheds additional light on the performance of IPOs by empirically examining the long-run performance of shariah-based IPOs. We therefore add to the growing body of evidence on the long-run performance of new issuers. The study of IPOs in the Islamic capital market is of interest because IPOs in Islamic capital market are smaller than those launched in non Islamic capital market. Furthermore, the characteristics of shariah-based firms are different from the characteristics of non shariah-based firms. We thus hope to shed light on whether the characteristics and the institutional setting of shariah-based firms might affect IPO performance. This research makes two distinct contributions to the literature concerning the long-run performance of IPOs. First, we use based and non shariah-based firms as sample. Second, we use two different measures to calculate the abnormal return : cumulative abnormal returns and buy-and-hold abnormal returns.
2. Literature Review
Behavioral economists have demonstrated that individuals often violate Bayes’ Rule and rational choice theories when making decisions under uncertainty in experimental settings (Kahneman and Tversky, 1982). In a similar vein, financial economists have also discovered long-run pricing anomalies that have been attributed to investor sentiment. Behavioral theories posit that investors give too much weight to recent results and trend. Eventually, overoptimistic investors are disappointed and subsequent returns decline.
Ibbotson (1975), after examining one random selected security from each month in the sixties, found a saucer shaped pattern. There were positive returns near the offering, followed by below market returns, with the fourth year returns tending towards normal. Performance for the first 48 months was below normal. The distribution of returns was highly skewed (most returns negative, but a few very high), indicating that these investments were individually very risky. Given the small sample size and the high standard deviations, the shortfall in performance was not statistically significant.
Ritter (1991) examined the returns from 1,526 initial public offerings made between 1975 and 1984. The three-year return was 34.47%. A control sample of 1,526 firms matched for industry and size returned 61.86% over the same three years. Brav, Geczy, and Gompers (2000) contend that test of underperformance based on buy-and-hold abnormal returns are biased towards rejecting the null hypothesis of no underperformance.
Loughran (1993) examined the returns from 3,556 IPOs during 1967 -1987 and found an average six year total return of 17.29% compared with 76.23% for the NASDAQ index during an identical period, showing results appreciably worse than Ritter had found for his three year tests. Strong underperformance was also found in comparison with firms of similar size on both the New York Stock exchange and on NASDAQ. A regression equation for July 1973- December 1988 had a statistically significant negative coefficient for having had a IPO within six years, even though the exchange and the book to market ratio were controlled for.
Loughran & Ritter (1995) examined initial public offering from 1970-1990. They found that the average rate of return was only 5% per year for the five years after issuance, compared to 12 percent for firms of comparable size. The results are even worse for the median firms, where after five years, the 4,753 initial public offerings had a negative return of 39%, while the size matched firms had a positive return of 16% for the five years. They calculate that the forgone return was $39 billion dollars, making the underperformance of economic significance.
Servaes & Rajan (1997) examined initial public offerings from 1975-1987. They found a found a five year raw return of 24%. This represented a 47% underperformance when compared against NYSE/ AMEX index, a 17% underperformance against the smallest decile from the NYSE / AMEX, and a 41% underperformance against firms matched by size and industry.
The underperformance is not limited to the United States. Levis (1993) examined the three year performance of 712 UK IPOs issued between 1980 and 1988 and found underperformance that varied between 8.3% and 23.0%, depending on the benchmark chosen. Uhlir (1989) found an underperformance of 7.4% after one year for German issues 1977-1987. Finn & Higham (1988) examined 93 Australian IPOs for 1966-1978. They found that buying at the end of the listing month and holding to the end of the first year earned 6.52% below the indices, but that this loss was not quite statistically significant. Kunz & Aggarwal (1994) found 42 Swiss IPOs between 1983 and 1989 experienced an underperformance of 6.1 %. Keloharju (1993) found that the average Finnish IPO lost 22.4% from the first market trading to three years later, versus 1.6% average decline for the market index. The US pattern of underperformance appears to extend to other countries.
The underperformance effect is not limited to developed countries, but also extends to emerging markets. Manurung and Soepriyono (2006) argue that Indonesian IPO had an underperformance of 19% after three years. While Pujihardjanto (2003) examined the one year performance of 124 Indonesian IPOs issued between 1992-1998 and found underperformance of 9,8%. Aggarwal, Leal, & Hernandez (1993) found that Brazilian IPOs had an underperformance of 47% after three years. For Chile, the underperformance after three years averaged 23.7%, while for Mexico the underperformance after one year was 19.6%.
Dawson (1987) examined the one year market adjusted returns for initial public offerings in Hong Kong, Singapore, and Malaysia during 1978-1984, and found those in Hong Kong were down 9.3%, and those in Singapore were down 2.7%. However, neither decline was statistically significant. In contrast, there was a positive statistical significant overperformance in Malaysia of 18.2%. The author points out that the Malaysian index he used was not a market wide one, but an industrial one. The one exception to the pattern of underperformance is India where Shah (1995) finds (in a large data set with 2056 IPOs from 1991-1995), that the IPOs typically outperform the market for the first 200 trading days, and then decline. After 400 days they are approximately at the level of the first trading day.
Ahmad-Zaluki, Campbell, and Goodacre (2007) investigate the long run performance of 454 Malaysian IPO companies that listed on the KLSE during the period 1990 to 2000. The results show that Malaysian IPOs significantly overperform their benchmarks when performance is measured using both equally-weighted cumulative abnormal returns and buy-and-hold abnormal returns, except when matched companies are used as the benchmark. However, this significant overperformance disappears when returns are calculated on a value-weighted basis.
Gompers and Lerner (2003) examine the performance for up to five years after listing of nearly 3,661 IPOs in the United States from 1935 to 1972. The sample displays some evidence of underperformance when event-time buy-and-hold abnormal returns are used. The underperformance disappears, however, when cumulative abnormal returns are utilized.
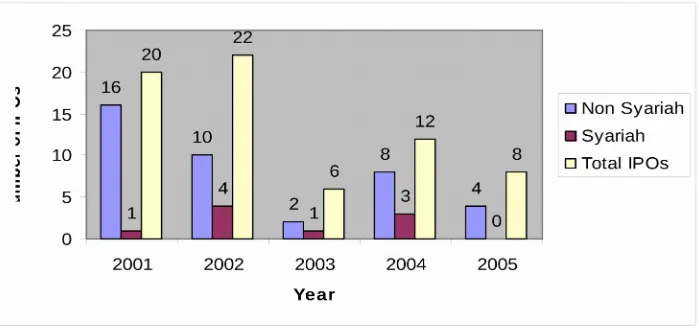
3. Methodology 3.1. Sample
firms. The first covers 8 companies, and the latter consists of 37 companies. Shariah-based firms are those included in Jakarta Islamic Index (JII), at least one period (one semester). JII is published twice a year. For the first time JII was published in July 2001. Data were taken from JSX statistics, www.e-bursa com, and www.jsx.co.id.
3.2. Long-Run of IPOs Performance Analysis
We use two different measures to analyze the long-run abnormal performance: cumulative abnormal returns and buy-and-hold abnormal returns.
Cumulative Abnormal Returns
Cumulative abnormal returns (CAR) are one method of evaluating the long-run performance of a portfolio securities. The return on a security or index is defined as:
ri,t = (pi,t – pi,t-1)/pi,t-1
where pi,t and pi,t-1are the prices of the security at the end of the current and previous periods,
respectively. The benchmark-adjusted return for stock i in event month t is defined as;
ari,t = ri,t – rm,t
where ri,t is the return for firm i in period t and rm,t is the return on a benchmark (IHSG and
LQ45 market indices) for the same period. The average adjusted return for a portfolio of n stocks in period t is the mean of the benchmark-adjusted returns.
n
ARt = ( ∑ ari,t ) / n
i=1
The cumulative adjusted return is therefore the sum of the average adjusted returns for each period;
t
CARt = ∑ ARs
s=1
If a firm is delisted before the end of the observation period, the average adjusted return on the portfolio for the period in which the firm is delisted and subsequent periods is the mean return for the remaining firms. Thus, the cumulative adjusted return on a portfolio is the equal-weighted return on the portfolio with monthly rebalancing.
One problem with using equal-weighted portfolios of securities when calculating CARs is that few investors would ever invest the same amount of money in each security they held. An alternative portfolio strategy would be to hold a quantity of each security proportional to firm’s market capitalization. Thus, we define the value-weighted average adjusted return (VWAR) as:
n n
VWARt = ( ∑ MKTCAPi,t-1 x ari,t ) / ∑ MKTCAPi,t-1
i=1 i=1
The value-weighted average adjusted return is calculated by weighting each adjusted return by the firm’s market capitalization (MKTCAPi) in the previous period. The cumulative value-weighted average adjusted return is thus:
t
s=1
Again, if a firm is delisted before the end of the two year observation period, it is excluded from the calculation of value-weighted average returns in subsequent months. This measure reflects the return an investor would obtain by investing in IPO firms in proportion to each firm’s market capitalization with monthly rebalancing.
Buy-and-Hold Abnormal Return (BHAR)
The use of ‘independent’ monthly rebalancing introduced by Ritter (1991) may introduce a downward bias in long-run CARs. Buy-and-hold abnormal returns are therefore used to reduced the statistical bias in the measurement of cumulative performance (Conrad and Kaul, 1993). Adopting the calculation used by Loughran and Ritter (1995), the 2-year holding period return for company i is defined as the geometrically compounded return on the stock in time t as:
min(T, delist)
BHRi,T = Π (1 + ri,t) - 1
t=start
where ri,t is the monthly raw return on company i in event month t, start is the first event
listing month and min (T, delist) is the earlier of the last month of JSX-listed trading or the end of the two-year window. This measures the total return from a buy-and-hold strategy where a stock is purchased at the first closing market price on the day of listing and held until the earlier of (i) its 1-, or 2-year anniversary, or (ii) its delisting.
The mean buy-and-hold abnormal return for both the IPO companies and their benchmarks are calculated as:
The benchmark adjusted buy-and-hold abnormal return for each company is calculated as :
min(T, delist) min(T,delist)
BHARi,t = [ Π (1 + ri,t) – 1 ] - [ Π (1 + rm,t) – 1 ]
t=start t=start
where BHARi,t is the benchmark adjusted buy-and-hold abnormal return of company i in event month t, ri,t is the company’s monthly raw return, and rm,t is the relevant monthly benchmark return. A positive (negative) value of BHAR indicates that IPOs outperform (underperform) a portfolio benchmarks.
The mean buy-and-hold abnormal return for a period t is defined as :
nt
BHARt = ∑ wi BHARi,t
i=1
In this section we present analysis of the returns of shariah-based and non shariah-based firms in event time. Table 1 present the BHAR for the two years following the issue.
Insert Table 1 about here.
The data shows that equally-weighted (EW) BHAR (Panel A) are quite high in the one year following the issue for shariah-based firms. They reach 73.65% when the benchmark used is IHSG, and 71.87% when the benchmark is LQ45. However, they are not significant (t-statistic=1.39 and 1.65). For non shariah firms, the results show that they significantly underperform at 1% (t-statistic= -2.66) after one year following the issue (the benchmark is IHSG). For the benchmark LQ45, they also significantly underperform at 1% (t-statistic= -2.81%). For the two years following the issue the results are the same; shariah firms outperform but insignificant (t-statistic=1.26 and 0.96) for the benchmark IHSG and LQ45, and non shariah firms significantly underperform at 1% (statistic= -6.10 and -6.23). The t-test for the two mean independent samples show that the long-run performance of IPOs initial return between shariah and non shariah firms is significantly different at 5% (t-statistic=2.27 and 2.27) with the benchmark IHSG and LQ45.
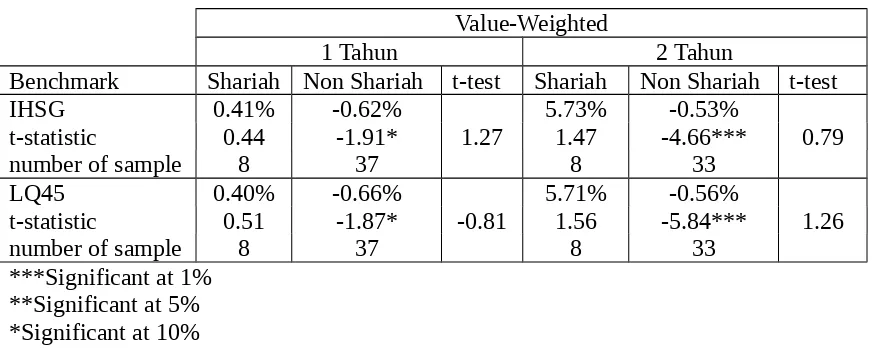
Value-weighted (VW) BHAR (Panel B) for non shariahs firm are significantly underperformed for the one and two years following the issue with the benchmark both IHSG and LQ45. One year after IPO, the returns reach -0.62% statistic= -1.91) and -0.66% (t-statistic= -1.87), significant at 10%, with the benchmark IHSG and LQ45. Two years following the issue, the firms significantly underperform the market at 1% (t= - 4.66 and -5.84). For shariah-based firms, the results show that they outperform the market but insignificant for the one and two years following the issue.
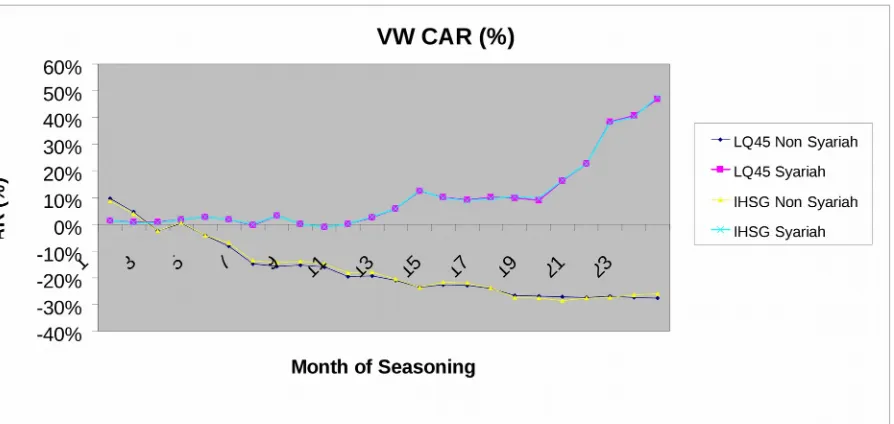
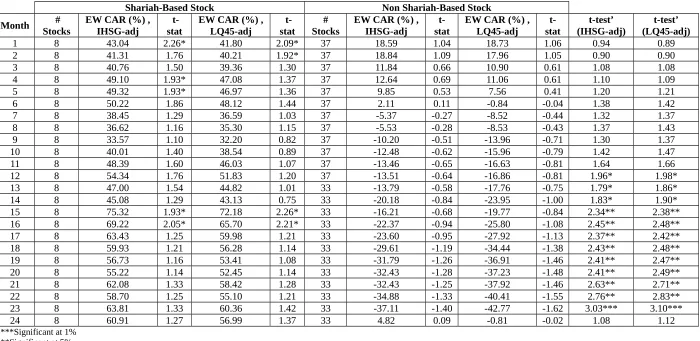
Table 2 presents EW-CAR from month 1 to month 24. For shariah-based firms, the results show that each month for two years the portfolio outperform the market with the highest return is 75.32% in month 15 (sig. at 10% with t-statistic=1.93), and the lowest is 33.57% in month 9 (t-statistic=1.10) with the benchmark is IHSG. For the benchmark LQ45, every month the portfolio outperform. The return reaches the highest 72.18% (t-statistic= 2.26) in month 15, and the lowest 32.20% (t-statistic= 0.82) in month 9.
Insert Table 2 about here.
For non shariah-based firms, Table 2 shows that, on average, the portfolio underperform except month 1 to 6. The highest underperformance is -37.11% (t-statistic= -1.40) and -42.77% (t-statistics= -1.62) in month 23 with the benchmark IHSG and LQ45. Surprisingly, there is no significant performance from month 1 to 24. Because of outlier, IHSG-adjusted EW-CAR reach 4.82% in month 24, meanwhile in month 23 it underperforms -37.11%. We, then, compare the performance of non-shariah and shariah firms. In the short run, statistically there is no difference between them. But begins month 12 to 23, the mean of two independent samples are significant at level of 1%, 5% and 10%, respectively.
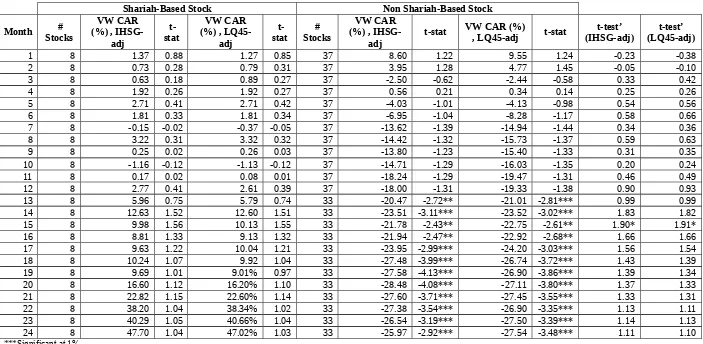
The best performance is 47.02% statistic=1.03)) in month 24 and the worst is -1.13% (t-statistic= -0.12) in month 10. For non shariah-based firms, it is found that the portfolios underperform in almost every month except month 1, 2 and 4. The underperformance is statistically significant in month 13 to months 24. Further, we test the difference of CARs between shariah-based and non shariah-based firms, and it is found that the difference is insignificant except in month 15.
Insert Table 3 about here.
5. Conclusion
References
Aggarwal, R., dan Rivoli, P., 1990, “Fads In the Initial Public Offerings Market?”, Financial Management, vol.19, pp.45-57
Aggarwal, R., R. Leal, dan F. Hernandez, 1993, “The aftermarket performance of initial public offerings in Latin America”, Financial Management, 22, pp.42-53.
Ahmad-zaluki, N., Campbell, K., dan Goodacre, A., 2007, “The Long run share price performance of Malaysian initial public offerings (IPOs)”, Journal of Business Finance & Accounting, vol. 34., Iss.1-2, pp. 78.
Ang, A., Gu, Li, dan Hochberg Y., 2005, “Is IPO underperformance a peso problem?”, Working Paper, National Bureau of Economic Research (NBER)
Barber, B, and Lyon, J., 1997, “Detecting long run abnormal stock returns: the Empirical power and specification of test statistics,” Journal of Financial Economics, 43, pp.341-372.
Brav, A., dan Gompers, P.A. 1997, “Myth or Reality? The Long-Run Underperformance of Initial Public Offerings: Evidence from Venture and Nonventure Capital-Backed Companies”, Journal of Finance, vol.56, pp.1791-1821.
Brav, A., Geczy, C., dan Gompers, P.A. 2000, “Is the abnormal return Following Equity Issuances Anomalous?”, Journal of Financial Economics, vol.56, pp.209-249.
Conrad, J., and Kaul, G., 1993, “Long-Term Market Overreaction or Biases in Computed Returns?” Journal of Finance, 48, pp.39-63.
Dawson, S.M., 1987, “Secondary stock market performance of initial public offers, Hong Kong, Singapore, and Malaysia: 1978-1984”, Journal of Business Finance and Accounting, vol.40, pp.65-162
Fama, E. F., 1998, “Market efficiency, long term return, and behavioral finance”, Journal of Financial Economics, 49, pp.283-306.
Finn, Frank J. & Higham, Ron, 1988, "The performance of unseasoned new equity issues-cum-stock exchange listings in Australia", Journal of Banking & Finance, vol. 12, pages 333-351.
Gompers, P.A., dan Lerner, J., 2003, “The Really long run performance of initial public offerings: The pre-Nasdaq Evidence”, Journal of Finance, vol.58, pp.1355-1392. Ibbotson, R., 1975, “Price performance of common stock new stocks,” Journal of Financial
Economis, 2, pp.235-272.
Kahneman, D., and Tversky A., 1982, Judgment under uncertainty: heuristic and biases, Cambrigde University Press.
Keloharju, M., 1993, “The winner’s curse, legal liability, and the long-run price performance of initial public ooferings in Finland”, Journal of Financial Economics, 34, pp.251-277. Kothari, S. and Warner, J., 1997, “Measuring long horizon security price performance,”
Journal of Financial Economics, 43, pp.301-340.
Kunz, R.M., dan R. Aggarwal, 1994, “Why initial public offerings are underpriced: Evidence from Switzerland”, Journal of Banking and Finance, 18, pp.705-724.
Levis, M. 1993, “The long run performance of initial public offerings: the UK experience 1980-1988”, Financial Management, Spring.
Loughran, Tim, 1993, "NYSE vs NASDAQ returns : Market microstructure or the poor performance of initial public offerings?", Journal of Financial Economics, 33, pp. 241-260,
Lyon, J., Barber, B., and Tsai, C., 1999, “Improved methods for tests of long run abnormal stock returns,” Journal of Finance, 54, no.1, pp.165-201.
Manurung, A. H., dan Soepriyono, G., 2006, “Hubungan antara imbal hasil IPO dan faktor-faktor yang mempengaruhi kinerja IPO di BEJ”, Usahawan, No.3, th. XXXV, maret, hal.14-26
Pujiharjanto, 2003, “Underpricing pada penawaran umum perdana di Bursa Efek Jakarta: Studi empiris emiten yang listing periode 1992-1998”, disertasi, Universitas Padjadjaran, tidak publis.
Ritter, J. R. 1991, “The long run performance of initial public offerings”, Journal of Finance, vol.46, pp.3-27.
Servaes, Henri dan Rajan, Raghuram, 1997, “Analyst Following of Initial Public Offerings,”
Journal of Finance, 52, pp. 507-29
Shah, A., 1995, "The Indian IPO Market: Empirical Facts," working paper, Centre for Monitoring Indian Economy, Bombay, India.
Teoh, Siew Hong, Welch, Ivo, dan T.J. Wong, 1998, “Earnings management and the long-run market performance of initial public offerings”, Journal of Finance, 53, pp.1935-1974. Uhlir, H., 1989, Going public in F.R.G., in A Reappraisal of the Efficiency of Financial
Sources: BEJ Jakarta
Figure 2 Equally-Weighted Cumulative Abnormal Return over 24 months for shariah and non shariah-based companies.
TABLE 1. One and two years holding period buy-and-hold abnormal return
Panel A. EW-Buy-and-Hold Abnormal Return
Equally-Weighted
1 Tahun 2 Tahun
Benchmark Shariah Non Shariah t-test Shariah Non Shariah t-test
IHSG 73.65% -25.68% 57.53% -75.63%
t-statistic 1.39 -2.66*** 1.75 1.26 -6.10*** 2.27**
number of sample 8 37 8 33
LQ45 71.87% -23.81% 71.87% -23.81%
t-statistic 1.65 -2.81*** 1.76 0.96 -6.23*** 2.27**
number of sample 8 37 8 33
Panel B. VW-Buy-and-Hold Abnormal Return
Value-Weighted
1 Tahun 2 Tahun
Benchmark Shariah Non Shariah t-test Shariah Non Shariah t-test
IHSG 0.41% -0.62% 5.73% -0.53%
t-statistic 0.44 -1.91* 1.27 1.47 -4.66*** 0.79
number of sample 8 37 8 33
LQ45 0.40% -0.66% 5.71% -0.56%
t-statistic 0.51 -1.87* -0.81 1.56 -5.84*** 1.26
number of sample 8 37 8 33
Table 2. Equally-Weighted Cumulative Abnormal Return from month 1 to 24
Shariah-Based Stock Non Shariah-Based Stock
Month Stocks # EW CAR (%) ,IHSG-adj stat t- EW CAR (%) ,LQ45-adj stat t- Stocks# EW CAR (%) ,IHSG-adj statt- EW CAR (%) ,LQ45-adj statt- (IHSG-adj)t-test’ (LQ45-adj)t-test’
1 8 43.04 2.26* 41.80 2.09* 37 18.59 1.04 18.73 1.06 0.94 0.89
2 8 41.31 1.76 40.21 1.92* 37 18.84 1.09 17.96 1.05 0.90 0.90
3 8 40.76 1.50 39.36 1.30 37 11.84 0.66 10.90 0.61 1.08 1.08
4 8 49.10 1.93* 47.08 1.37 37 12.64 0.69 11.06 0.61 1.10 1.09
5 8 49.32 1.93* 46.97 1.36 37 9.85 0.53 7.56 0.41 1.20 1.21
6 8 50.22 1.86 48.12 1.44 37 2.11 0.11 -0.84 -0.04 1.38 1.42
7 8 38.45 1.29 36.59 1.03 37 -5.37 -0.27 -8.52 -0.44 1.32 1.37
8 8 36.62 1.16 35.30 1.15 37 -5.53 -0.28 -8.53 -0.43 1.37 1.43
9 8 33.57 1.10 32.20 0.82 37 -10.20 -0.51 -13.96 -0.71 1.30 1.37
10 8 40.01 1.40 38.54 0.89 37 -12.48 -0.62 -15.96 -0.79 1.42 1.47
11 8 48.39 1.60 46.03 1.07 37 -13.46 -0.65 -16.63 -0.81 1.64 1.66
12 8 54.34 1.76 51.83 1.20 37 -13.51 -0.64 -16.86 -0.81 1.96* 1.98*
13 8 47.00 1.54 44.82 1.01 33 -13.79 -0.58 -17.76 -0.75 1.79* 1.86*
14 8 45.08 1.29 43.13 0.75 33 -20.18 -0.84 -23.95 -1.00 1.83* 1.90*
15 8 75.32 1.93* 72.18 2.26* 33 -16.21 -0.68 -19.77 -0.84 2.34** 2.38**
16 8 69.22 2.05* 65.70 2.21* 33 -22.37 -0.94 -25.80 -1.08 2.45** 2.48**
17 8 63.43 1.25 59.98 1.21 33 -23.60 -0.95 -27.92 -1.13 2.37** 2.42**
18 8 59.93 1.21 56.28 1.14 33 -29.61 -1.19 -34.44 -1.38 2.43** 2.48**
19 8 56.73 1.16 53.41 1.08 33 -31.79 -1.26 -36.91 -1.46 2.41** 2.47**
20 8 55.22 1.14 52.45 1.14 33 -32.43 -1.28 -37.23 -1.48 2.41** 2.49**
21 8 62.08 1.33 58.42 1.28 33 -32.43 -1.25 -37.92 -1.46 2.63** 2.71**
22 8 58.70 1.25 55.10 1.21 33 -34.88 -1.33 -40.41 -1.55 2.76** 2.83**
23 8 63.81 1.33 60.36 1.42 33 -37.11 -1.40 -42.77 -1.62 3.03*** 3.10***
24 8 60.91 1.27 56.99 1.37 33 4.82 0.09 -0.81 -0.02 1.08 1.12
***Significant at 1% **Significant at 5% *Significant at 10%
Table 3. Value-Weighted Cumulative Abnormal Return from month 1 to 24
t-stat VW CAR (%), LQ45-adj t-stat (IHSG-adj)t-test’ (LQ45-adj)t-test’
1 8 1.37 0.88 1.27 0.85 37 8.60 1.22 9.55 1.24 -0.23 -0.38
14 8 12.63 1.52 12.60 1.51 33 -23.51 -3.11*** -23.52 -3.02*** 1.83 1.82
15 8 9.98 1.56 10.13 1.55 33 -21.78 -2.43** -22.75 -2.61** 1.90* 1.91*
16 8 8.81 1.33 9.13 1.32 33 -21.94 -2.47** -22.92 -2.68** 1.66 1.66
17 8 9.63 1.22 10.04 1.21 33 -23.95 -2.99*** -24.20 -3.03*** 1.56 1.54
18 8 10.24 1.07 9.92 1.04 33 -27.48 -3.99*** -26.74 -3.72*** 1.43 1.39
19 8 9.69 1.01 9.01% 0.97 33 -27.58 -4.13*** -26.90 -3.86*** 1.39 1.34
20 8 16.60 1.12 16.20% 1.10 33 -28.48 -4.08*** -27.11 -3.80*** 1.37 1.33
21 8 22.82 1.15 22.60% 1.14 33 -27.60 -3.71*** -27.45 -3.55*** 1.33 1.31
22 8 38.20 1.04 38.34% 1.02 33 -27.38 -3.54*** -26.90 -3.35*** 1.13 1.11
23 8 40.29 1.05 40.66% 1.04 33 -26.54 -3.19*** -27.50 -3.39*** 1.14 1.13
24 8 47.70 1.04 47.02% 1.03 33 -25.97 -2.92*** -27.54 -3.48*** 1.11 1.10