The Gambian Sole Stock Assessment
Final Report
Gambia-Senegal Sustainable Fisheries Project
(USAID/BaNafaa)
2
This publication is available electronically on the Coastal Resources Center’s website at http://www.crc.uri.edu. For more information contact: Coastal Resources Center, University of Rhode Island, Narragansett Bay Campus, South Ferry Road, Narragansett, Rhode Island 02882, USA. Tel: 401) 874-6224; Fax: 401) 789-4670; Email: [email protected]
The USAID/BaNafaa project is implemented by the Coastal Resources Center of the University of Rhode Island and the World Wide Fund for Nature-West Africa Marine Program Office (WWF-WAMPO) in partnership with the Department of Fisheries and the Ministry of Fisheries and Water Resources.
Citation: DeAlteris, J. Cessay, S. and A. Jallow. 2012. The Gambian Sole Stock Assessment:
Final Report. Gambia-Senegal Sustainable Fisheries Project (USAID/Ba Nafaa). Coastal Resources Center, University of Rhode Island, pp. 21
Disclaimer: This report was made possible by the generous support of the American people
through the United States Agency for International Development (USAID). The contents are the responsibility of the authors and do not necessarily reflect the views of USAID or the United States Government. Cooperative Agreement # 624-A-00-09- 00033-00.
Cover Photo: Catching sole (Left photo), Sole catches (Center), Processing sole plant (Left)
Photo Credit: Kathleen Castro, Gibril Gabis and Lina Kelpsaite, USAID/BaNafaa
3
Acknowledgements
4
Table of Contents
Acknowledgements ... 3
INTRODUCTION ... 5
Summary of Landings ... 6
ESTIMATION OF CATCH PER UNIT EFFORT... 7
Introduction ... 7
Methods ... 8
Results ... 8
ESTIMATION OF THE LEVEL OF EXPLOITATION ... 12
Introduction ... 12 Figure 1: Reported landings by artisanal and industrial sectors of mixed sole ... 6
Figure 2: Mean annual CPUE (kg/day) for sole fish in artisanal fishery in Gambian waters. ... 9
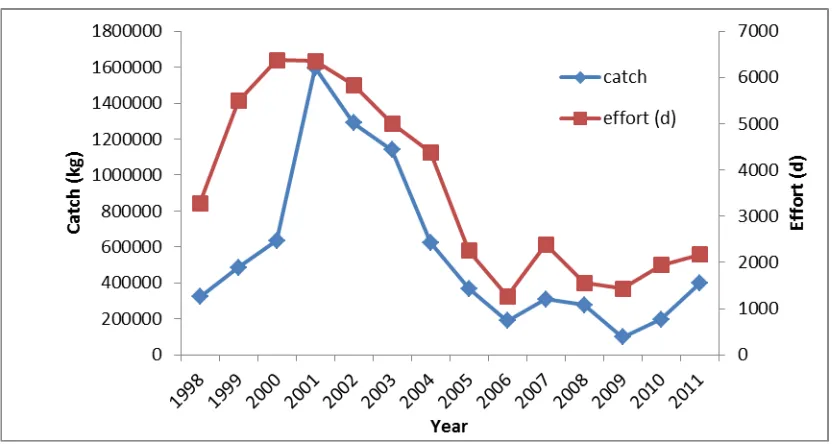
Figure 3: Time series of industrial sole catch (kg) and effort (days fishing) ... 10
Figure 4: Time series of summed industrial vessel catch data for sole ... 11
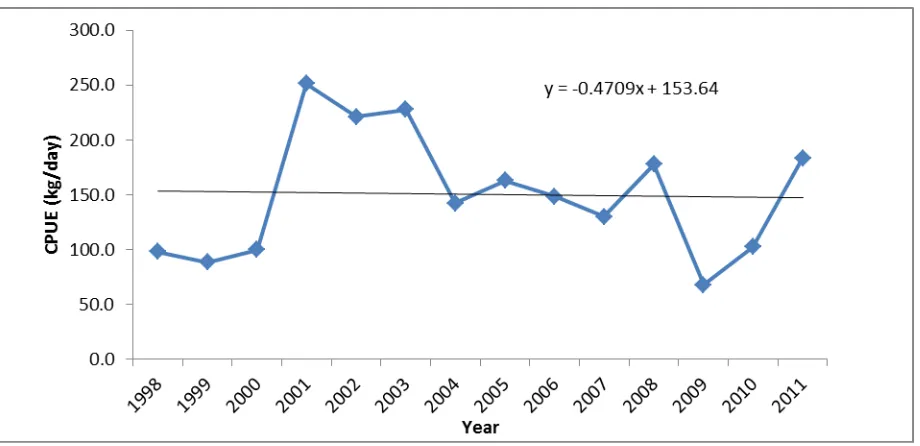
Figure 5: Mean annual CPUE (kg/day) for sole fish based on industrial fishery ... 11
Figure 6: Results of LCCA for red sole... 14
Figure 7: Results of LCCA for black sole ... 15
Figure 8: Results of YPR and SSBPR analysis for red and black sole. ... 16
List of Tables
Table 1: Industrial fishery data for the aggregated sole catch, effort and reported landings.. .... 10Table 2: The summarized weight distribution of red sole processed... 12
Table 3: Landing of mixed sole fish on 2006-2008 ... 13
Table 4: Red sole LCCA sensitivity analysis ... 15
Table 5: Black sole LCCA sensitivity analysis... 16
Table 6: Landings of aggregated sole fish as reported by the Gambia Dept of Fisheries. ... 17
5
INTRODUCTION
This stock assessment has been undertaken as part of the USAID- BaNafaa Project. Several studies of the sole resource and fishery have occurred previous to and concurrently with this assessment. These include a species identification survey, bycatch and gillnet characterization, gillnet selection, length-weight analyses, age and growth study, landings surveys (length frequency) and a local knowledge summary. A sole management plan has resulted from these efforts that was developed in a co-management process. A first stock assessment was performed on the Gambian sole as part of a MSC pre-assessment (Medley et al., 2008) establishing a partial baseline. With the new information gained from the USAID-BaNafaa Project , this is the second stock assessment was conducted as a collaborative effort between staff from the University of Rhode Island Fisheries Center and the Gambian Department of Fisheries.
6
Summary of Landings
Landings of all species sole fish are aggregated by the Department of Fisheries (DoFish) in the Gambia and are reported as either artisanal or industrial (Figure 1).
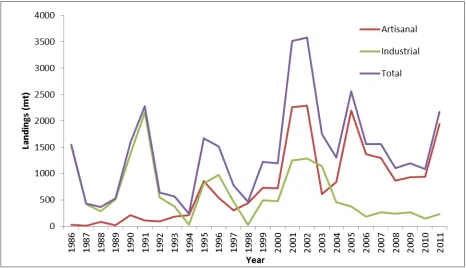
Figure 1:Reported landings by artisanal and industrial sectors of mixed sole fish in the Gambia in metric tons (mt) from 1986 to 2011.
Artisanal landing have slowly increased in the last 25 years with several major peaks followed by declines in 1995, 2001/2002 and 2005. Current landings by the artisanal fishery are about 1500 mt annually. In contrast, landings of the industrial fishery have slowly declined in the last 25 years with peaks in 1991, 1996 2001/2002. The current harvest of sole by the industrial fishery is about 200 mt annually, and these fish are landed in Senegal. The data on sole fish harvested by the industrial fishery in the
7
ESTIMATION OF CATCH PER UNIT EFFORT
Introduction
A catch per unit effort (CPUE) index is a critical input into a fish stock assessment. It provides a relative index of abundance and when combined with catch data for the stock can be used in a surplus productions model to estimate a trajectory of stock
biomass and exploitation. In Gambia, there is an abundance of data on the fisheries that has been collected over the last two decades, but only landings data is conveniently accessible for analysis. This section of this report presents the results of our effort to develop a fishery based CPUE index for the sole fish resource. While there are several species of sole that are harvested in the artisanal and industrial fisheries of the Gambia, two species dominate the catch: red sole (Cynoglossus senegalensis) and black sole (Synaptura cadenati). The Gambia fisheries statistics only note a species group in the landings, and that is referred to as sole fish. It has been reported by local artisanal fishermen that the red and black sole are spatially segregated in the coastal waters with black sole further offshore than red sole (Drammeh, et al, 2011). As the industrial trawl vessels are supposed to operate outside of 9 nm, the catches of the trawlers may not completely reflect the red sole abundance.
The artisanal fishery that uses a bottom set tangle/gill net accounts for the majority of the sole fish landings in the Gambia. Artisanal landings are estimated based on a
sampling procedure that accounts for various landing sites, fishing days and the number of boats fishing. However, a portion of the landings is taken by the industrial trawlers working off the coast in the Atlantic stratum and landed in Senegal. In the past, only the catches of these trawlers have been reported, but in the paper records that have been collected by the Industrial Fishery Sector group at DoFish, there is effort data
summarized by hours and days fishing by month for each fishing trawler operating in Gambian water. These vessels all have independent fishery observers on board, and they collect the data and report the catch data daily by radio to DoFish in Banjul. The monthly summaries of the original data tabulate the total catch of sole (kg), total effort (hours and days fishing), catch per unit effort (kg/h and kg/d) for the years 1998 to 2011. In a typical year there may have been 15 to 30 vessels with catch data reported daily, and totaled for the month and year. These trawlers target shrimp, and the entire demersal complex, and sole is considered a bycatch that is retained and sold.
8
sole, whereas the industrial index may be more appropriate for the black sole as noted previously.
Methods
For the artisanal index, the original paper port sampling records for 2008 through 2011 were available for review. The catch of individual sampled boats and the days fishing were extracted and summed for each year. The CPUE index for each year was
estimated by dividing the total catch by the days of effort. Neither the landings nor the effort are complete for the fishery, but are considered to be a representative sample of the fishery. Regression analysis was conducted on CPUE versus time to test the significance of the trend in CPUE.
For the industrial fishery, the original paper records were reviewed, and the data on sole catch and effort by vessel by year were extracted and entered into an EXCEL
spreadsheet. The entered data were reviewed, and independently compared to the original data. For each vessel, an annual CPUE was calculated, then the annual catch and effort data by vessel were summed, and finally an annual CPUE was calculated. Data were not available for 2003 and 2007 as the paper files were missing, and these were estimated by extrapolation from the published industrial catch data for sole. The summed catch data were compared to the published catch data for the industrial sector. However in that time series, the 2002 catch data for sole is missing, so the summed catch data from the original paper records was substituted. All results were plotted as time series for presentation and interpretation purposes. Regression analysis was conducted on CPUE versus time to test the significance of the trend in CPUE.
Results
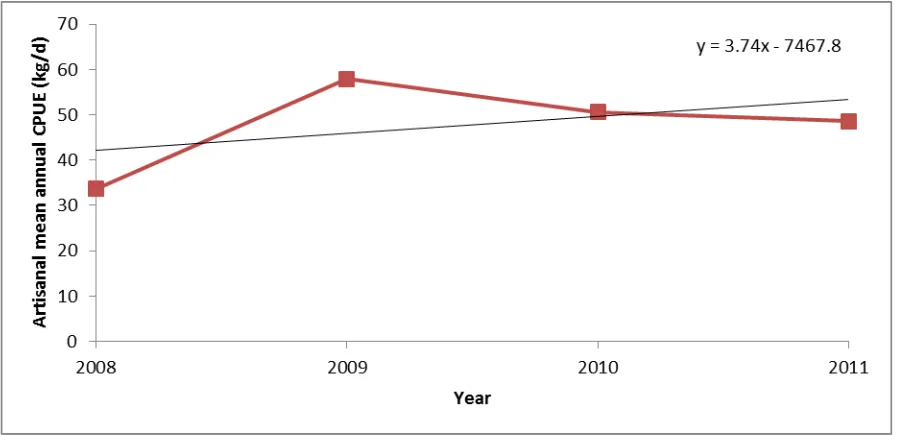
For the artisanal fishery, the CPUE index is shown in Figure 2 for the period 2008 to 2011. While there does appear to be a slight positive trend in the CPUE with time, the slope is not significant different from zero. It is interesting to note that the mean CPUE for the artisanal fishery is about 50 kg per day of fishing, and this is consistent with reports of the catch rates for the artisanal fishery in the MSC Sustainable Fisheries Certification Report (2008). However, it is has been reported that there has been changes in the nets used in the artisanal fishery and this may have changed the catchability of the gear, thus effecting the CPUE index (Gabis et al 2011a)
For the industrial fishery, the data collected and summarized are listed in Table 1. The highlighted cells represent data that was estimated by either interpolation or by
9
catches and increasing effort. The summed annual reported industrial vessel sole catch was compared to the published annual industrial sole catch in Figure 4, and there is good agreement in the catch data, suggesting confidence in further analysis. The industrial CPUE index (kg/day) for sole fish taken by dividing the annual reported catch by the effort that was required to produce that catch is shown in
Figure 2: Mean annual CPUE (kg/day) for sole fish in artisanal fishery in Gambian waters.
Figure 5. Recall that this can be relative index of abundance for the sole resource, and it indicates considerable temporal variation in sole stock abundance over the
observation period, 1998 to 2011. During the period 1998-2000 and again in 2009, sole stock abundance was relatively low, but during the periods 2001-2008 and 2011, sole stock abundance was relatively high. The mean CPUE for sole fish by the industrial fishery in the Gambia is about 150 kg/day. The trend in CPUE is slightly negative, but again the slope is not significantly different from zero, so in fact there is no long term trend in CPUE or relative abundance.
10
Year Catch Effort (h) Effort (d) CPUE(kg/h) CPUE(kg/d) Ind Landings (kg)
1998 321407 49291 3279 6.5 98.0 29670
1999 485723 82634 5490 5.9 88.5 490884
2000 636192 104456 6378 6.1 99.7 471736
2001 1597007 106646 6349 15.0 251.5 1250000
2002 1289248 101323 5830 12.7 221.1 1289248
2003 1139287 87000 5000 13.1 227.9 1139287
2004 623258 74612 4381 8.4 142.3 461900
2005 367118 36812 2253 10.0 162.9 371300
2006 188019 26730 1269 7.0 148.2 188100
2007 310049 2388 129.8 264040
2008 276222 26298 1553 10.5 177.9 242460
2009 97463 23589 1435 4.1 67.9 266700
2010 198397 32948 1939 6.0 102.3 147000
2011 397527 36737 2167 10.8 183.4 232000
Table 1: Industrial fishery data for the aggregated sole catch, effort and reported landings. Note that reported landings do not always agree with the actual catch data in the paper record. Highlighted cells were estimated by extrapolation or substitution. See Figure 4 also.
11
Figure 4: Time series of summed industrial vessel catch data for sole as reported to DOFish by radio, and the published or reported industrial catch data.
12
ESTIMATION OF THE LEVEL OF EXPLOITATION AS COMPARED TO
REFERENCE POINTS
Introduction
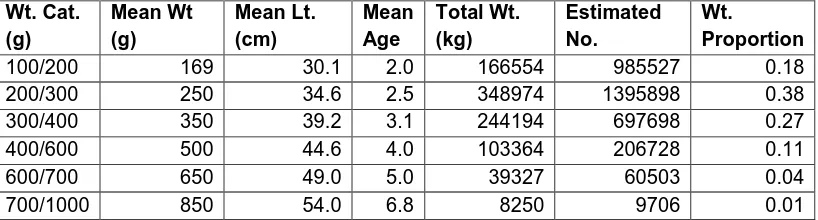
Medley et al. (2008) conducted an assessment of the level of exploitation of sole in Gambian waters based on catch curve analysis from data obtained from Atlantic Seafood, and compared that to reference points estimated from a SSBPR analysis. That analysis, as part of a sustainability pre-assessment (MSC Sustainable Fisheries Certification Report, 2008), was based on the weight distribution of landings processed by the company during the period 2006-2008 (Table 2).
Wt. Cat.
Table 2: The summarized weight distribution of red sole processed by Atlantic Seafood in the 2006-2008 period.
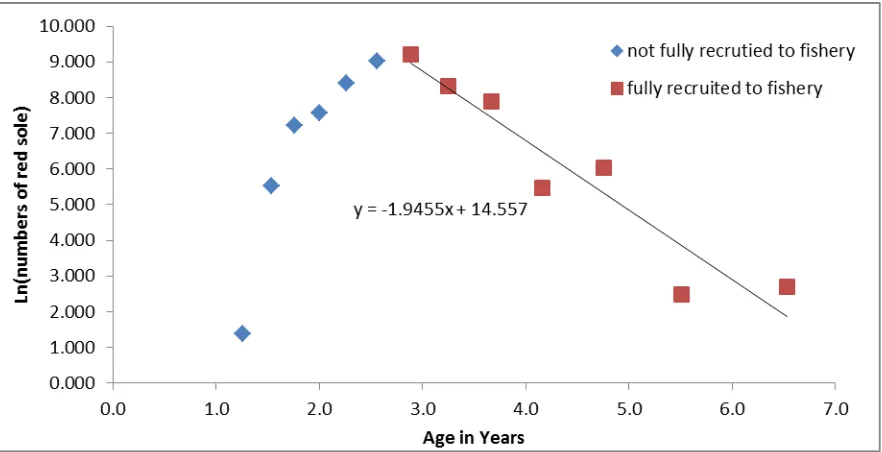
The results of the Length-Based Catch Curve Analysis (LCCA) of this red sole
processing data indicated that the slope of the linear regression of Ln (catch) versus the age was 1.124, or total mortality was 1.12, therefore, F was estimated to be 0.49. This analysis was based on the following input parameters for the life history characteristics: Linf=60 cm, K=0.34, and M=0.72. Based on this LCCA, the red sole stock was
determined to be not over-exploited, as the estimated F was less than the F 40% from the SSBPR analysis. Medley et al. (2008) also noted that the total proportion of two smallest weight categories (100-200, 200-300g) is 0.56, and the proportion of large fish >300g is 0.46. From these proportions they concluded that the proportion of large fish in the population is consistent with a fish stock that is not over-fished.
13
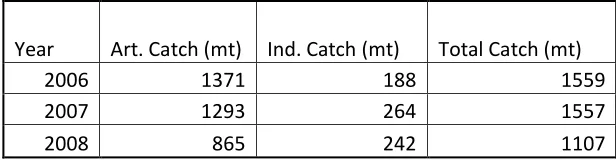
Year Art. Catch (mt) Ind. Catch (mt) Total Catch (mt)
2006 1371 188 1559
2007 1293 264 1557
2008 865 242 1107
Table 3: Landing of mixed sole fish on 2006-2008 as reported by the Gambia Department of Fishereis.
The purpose of this section of this report is to present the results of a similar analysis to that conducted by Medley et al. in 2008, but on more comprehensive data collected in 2010. The goal of this new analysis is the compare the estimated level of exploitation of sole fish in 2010 to management reference points.
Methods
The analyses included in this report were conducted in May 2012, but were based on data collected in 2010-2011 by the BaNafaa project at the artisanal landing sites and by Atlantic Seafood in its processing plant in Banjul, the Gambia.
Length-based Catch Curve Analysis was conducted on length frequency distributions collected at the beach landing sites in second half of 2010 and first half of 2011. These data were collected based on random samples of the catch, and measurements were made at 0.5 cm intervals and by month. Data were collected on the two dominant species landed: red sole (Cynoglossus senegalensis) and black sole (Synaptura cadenati). These data were expanded and resorted at 2.5 cm interval, and finally
summed for the 12 months. The lengths of the mean of the fish length categories were converted to mean age using a von Bertalanffy growth equation using specific value of Linf and K, the growth coefficient. To determine the total mortality, the natural log of the numbers captured was plotted versus the estimated age at mean length, where the slope of the linear regression trend line is the total mortality. The regression slope was estimated on fish that were fully recruited to the fishery as indicated by steadily
decreasing numbers in the catch. Fishing mortality was estimated by subtracting an estimate of natural mortality from total mortality.
14
were re-analyzed using alternative methods and omitting limited or outlying data points with limited observations to produce a range of maximum lengths (L∞) and growth coefficients (K).
Catch data for the artisanal and industrial fisheries were taken from published data provided by the Gambia Department of Fisheries. Data on the weight distribution of fish processed in 2010 were provided by Atlantic Seafood in Banjul.
Results
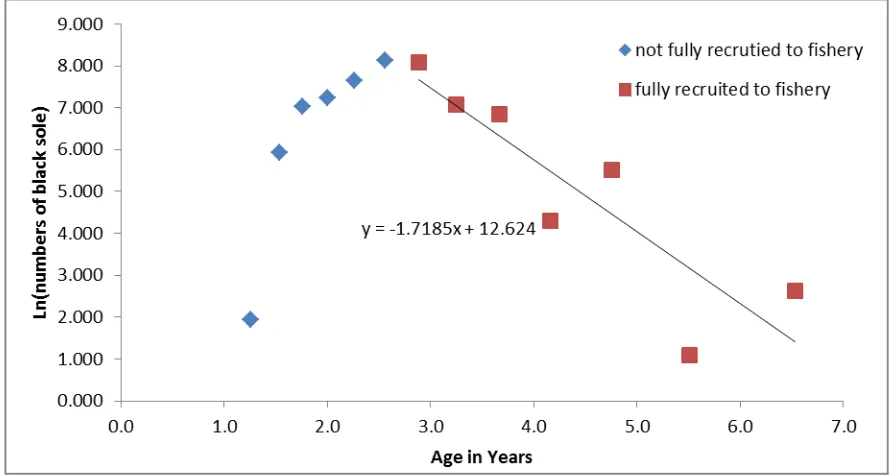
The length-frequency distributions of red and black sole measured at the landing sites were transformed into natural log of catch numbers versus age for the 2010-2011 catch data (Figures 6 and 7). More than 33,000 red sole and about 14,000 black sole were sampled and measured in the Banafa project. Note that the slope of the trend line depends on the assumed values of the growth function (Linf and K), that were used to convert the mean category length to an age. The series are divided into two sections those fish not fully recruited to the fishery, and those fish fully recruited to the fishery. The slope to the trend line of the natural log of the catch numbers versus the mean age is the total mortality.
15 Figure 7: Results of LCCA for black sole
A sensitivity analysis was conducted to determine the effect on the assumed values of Linf, K, and M on the resulting estimate of fishing mortality, F (Tables 4 and 5). The re-analysis of the Gabis et al (2011) data results in a range of values for L∞ of 40-51 cm , and K of 0.2-0.7. Recall the Medley et al. analysis in 2008 used values of 60, 0.34 and 0.7 for L∞ , K and M, respectively. In this study natural mortality was estimated to
possibly range from 0.4 to 0.6, and the age and growth study found a 5 year old black sole that was only 38 cm in length. Given that some sole are landed that exceed 50 cm in length, this suggests that sole are longer lived than assumed by Medley et al. (2008), and therefore M must be less than 0.7.
Table 4: Red sole LCCA sensitivity analysis
Linf= 65.0 65.0 60.0 60.0 57.0 55.0 55.0 55.0 53.0
K= 0.40 0.35 0.40 0.35 0.35 0.35 0.35 0.30 0.30
M= 0.4 0.4 0.5 0.5 0.5 0.5 0.6 0.6 0.6
Z= 3.9 3.4 2.9 2.5 2.0 1.6 1.6 1.3 0.9
F= 3.5 3.0 2.4 2.0 1.5 1.1 1.0 0.7 0.3
Risk Adverse Best
16 Table 5: Black sole LCCA sensitivity analysis
The results of the LCCA analysis suggests that the best estimate of fishing mortality (F) for red and black sole is 1.5 and 1.2, respectively, based on L∞ , K and M values of 57 cm, 0.35 and 0.5, for both species. The slope of the fully recruited numbers versus age was also re-calculated using an additional data point that included a slightly younger age, but this only changed the slope less that 0.1 units of total mortality, and therefore did not substantively change the outcome of the analysis.
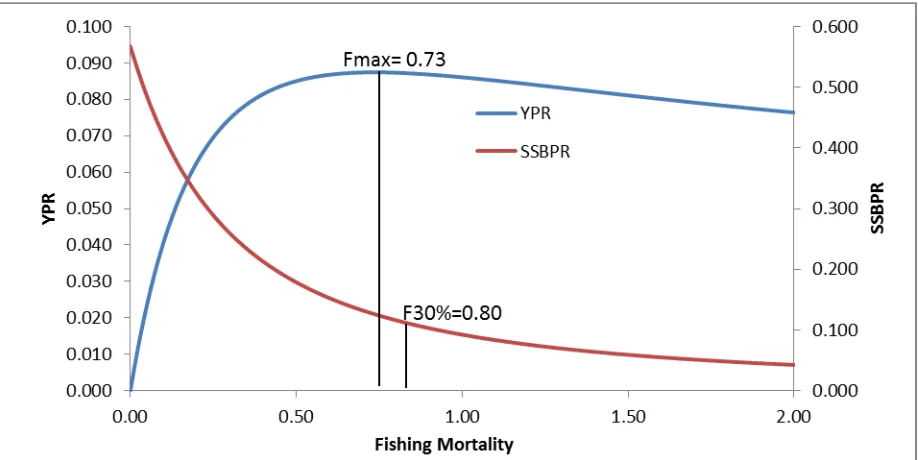
The results of the YPR and SSBPR analyses for red and black sole are summarized in Figure 7.
Figure 8: Results of YPR and SSBPR analysis for red and black sole.
Linf= 65.0 65.0 60.0 60.0 57.0 55.0 55.0 55.0 53.0
K= 0.40 0.35 0.40 0.35 0.35 0.35 0.35 0.30 0.30
M= 0.4 0.4 0.5 0.5 0.5 0.5 0.6 0.6 0.6
Z= 3.4 3.0 2.5 2.1 1.7 1.4 1.4 1.2 0.8
F= 3.0 2.6 2.0 1.7 1.2 0.9 0.8 0.6 0.2
Risk Adverse Best
17
The reference points for growth and recruitment overfishing, Fmax and F30%, for red and black sole are 0.73 and 0.80, respectively.
Comparing the results of the LCCA to the reference points estimated in the YPR and SSBPR analysis, both red sole and black sole were experiencing growth and
recruitment overfishing in 2010-2011.
The catch data for 2010 and 2011 from the Gambia Department of Fisheries ranged for 1085 to 2219 mt (Table 6).
Year Art. Catch (mt) Ind. Catch (mt) Total Catch (mt)
2010 938 147 1085
2011 1987 232 2219
Table 6: Landings of aggregated sole fish as reported by the Gambia Department of Fisheries.
Note that the catch of sole fish appears to increase dramatically in 2011, suggesting overfishing.
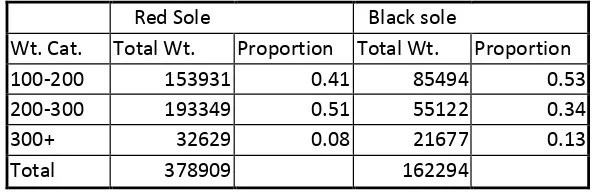
Finally, the weight distributions of red and black sole processed by Atlantic Seafood in 2010 are shown in Table 7. Note that it appears that Atlantic Seafood processed about 50% of the sole fish landed in the artisanal fishery in 2010.
Red Sole Black sole
Table 7: Weight distribution of red and black sole processed in 2010 at Atlantic Seafood.
These data indicate that the proportion of larger fish (>300 g) in the population is relatively small in 2010, 8% for red sole and 13% for black sole, as compared to 2006-2008, based on the data used by Medley et al. in his 2008 analysis.
18
19
SUMMARY, CONCLUSIONS AND RECOMMENDATIONS
Current landings of sole fish in the Gambia by the artisanal fishery are about 1500 mt annually and in the industrial fishery are about 200 mt annually. By comparison current landings of sole fish in Senegal are reported to be substantially greater. If the stock is a shared single stock then a joint assessment is preferable to just The Gambia alone. However, information from the local knowledge sessions indicated that sole seasonally move both from the north and the south to the Gambian waters (Drammeh et al., 2011), suggesting that there could be separate management units.
The mean CPUE for the artisanal fishery is about 50 kg per day of fishing, while the more efficient industrial fishery has a mean sole fish bycatch CPUE of about 150 kg per day of fishing. Neither index has a trend that is significantly different from zero,
suggesting that either the indices are not representative of relative stock abundance or that the relative stock abundance of the sole stocks has remained unchanged in the last decade. While the CPUE values appear to be representative, the lack of a significant negative trend is puzzling in light of the other analyses.
The results of the LCCA and reference point analyses presented in this report suggest that red and black sole are now over-exploited, as the estimated level of fishing
mortality is greater than both the growth and recruitment overfishing reference points. This is also confirmed by the lack of larger fish in the population, only 8-13% in 2010 as compared to 46% on 2006-2008. The overall catches of sole in 2010 do not appear to be excessive as compared to the 2006-2008 period, but the catches in 2011 appear to be high.
In conclusion, the data available for analysis do not allow for an estimate of stock size for either red sole, black sole, or for the species complex, or the estimation of the
biomass level at maximum sustainable yield (BMSY). But given the excellent data on the size distribution of fish landed in 2010 and 2011 in the artisanal fishery, and the analysis of this data using LCCA, it is clear that the sole fish stock in the Gambia is
over-exploited. This is confirmed by the lack of large fish (>300 g) in the processed fish data form Atlantic Seafood in 2010 as compared to 2006-2008. However it must be noted that this conclusion is must be reconciled with the lack of a significant negative trend in the CPUE indices for the artisanal and industrial fisheries. While this is puzzling, it is more than likely due to the limited data that used to estimate the CPUE indices. This results in uncertainty in these CPUE indices that has not been quantified.
20
stocks must be collected. For the management unit that includes the sole fish in the Gambia, it is clear that fishing mortality must be reduced, so as to allow the fish to grow to a larger size. This will increase the spawning biomass, and eventually increase the stock abundance. To reduce fishing mortality, fishing effort must be reduced, and this can be achieved through limiting new entrants into the fishery, and limiting the days of fishing allowed through closed seasons or reduced fishing weeks. Additional
investigations of the growth and maturity of sole fish are required so as to provide less uncertainty in these life history parameters.
REFERENCES
Agence Japonaise de Cooperation Internationale. 2006. Etude de l’evaluation et de la gestion des resources halieutiques en Republic du Senegal. Rapport final.
CRC. 2011. Identification of the sole resources of the Gambia. Coastal Resources Center, University of Rhode Island.pp 11.
Drammeh, O., E. Nichols, G. Gabis, and K. Castro. 2011. The use of local knowledge: application to the management of the sole fishery in the Gambia. Coastal Resources Center, University of Rhode Island. pp.19.
Gabis, G., C. Parkins, K. Castro. 2011a. Characterization of the sole fishery in the Gambia. Coastal Resources Center, University of Rhode Island. pp.13.
Gabis, G., L. Sanyang, I. Mateo, J. Burnett, and K. Castro. 2011b. Age determination of the black sole and red sole in the Gambia using otoliths. Coastal Resources Center, University of Rhode Island. Pp 11.
Haddon. 2001. Modelling and Quantitative methods in Fisheries. Chapman and Hall. NY.