Full Terms & Conditions of access and use can be found at
http://www.tandfonline.com/action/journalInformation?journalCode=vjeb20
Download by: [Universitas Maritim Raja Ali Haji] Date: 11 January 2016, At: 22:09
Journal of Education for Business
ISSN: 0883-2323 (Print) 1940-3356 (Online) Journal homepage: http://www.tandfonline.com/loi/vjeb20
Evaluating the Use of Random Distribution Theory
to Introduce Statistical Inference Concepts to
Business Students
Karen H. Larwin & David A. Larwin
To cite this article: Karen H. Larwin & David A. Larwin (2011) Evaluating the Use of Random Distribution Theory to Introduce Statistical Inference Concepts to Business Students, Journal of Education for Business, 86:1, 1-9, DOI: 10.1080/08832321003604920
To link to this article: http://dx.doi.org/10.1080/08832321003604920
Published online: 20 Oct 2010.
Submit your article to this journal
Article views: 78
ISSN: 0883–2323
DOI: 10.1080/08832321003604920
Evaluating the Use of Random Distribution Theory
to Introduce Statistical Inference Concepts to
Business Students
Karen H. Larwin
Youngstown State University, Youngstown, Ohio, USA
David A. Larwin
Kent State University at Salem, Salem, Ohio, USA
Bootstrapping methods and random distribution methods are increasingly recommended as better approaches for teaching students about statistical inference in introductory-level statis-tics courses. The authors examined the effect of teaching undergraduate business statisstatis-tics students using random distribution and bootstrapping simulations. It is the first such empirical demonstration employing an experimental research design. Results indicate that students in the experimental group—where random distribution and bootstrapping simulations were used to reinforce learning—demonstrated significantly greater gains in learning as indicated by both gain scores on the Assessment of Statistical Inference and Reasoning Ability and final course grade point averages, relative to students in the control group.
Keywords: bootstrapping, random distribution, statistical inference
INTRODUCTION
Discovering how students learn most effectively is one of the major goals of research in education. Over the last 30 years, many researchers and educators have called for re-form in the area of statistics education in an effort to more successfully reach the growing population of students across an expansive variety of disciplines, who are required to com-plete coursework in statistics (e.g., Garfield, Hogg, Schau, & Whittinghill, 2000; Higgins, 1999). Many of these stu-dents have very little interest in learning mathematics, and even less interest in learning statistics (Bradstreet, 1996; Gordon, 1995; Hollis, 1995). In light of this, reform efforts have proposed that statistics education should abandon the “information transfer model in favor of a constructivist ap-proach to learning” (Moore, 1997, p. 124) in an effort to help students develop an understanding of statistical concepts, be-yond the use of mathematical formulas.
Correspondence should be addressed to Karen H. Larwin, Youngstown State University, Department of Foundations, Research, Technology and Leadership, One University Plaza, Youngstown, OH 44555–0001, USA. E-mail: drklarwin@yahoo.com
The constructivist approach to learning is based on the premise that learning is the result of mental constructions in which students are able to incorporate new information by building on knowledge they already have acquired (Caine & Caine, 1991). Moore (1997) maintained that statistics is not a subcategory of mathematics, but rather it is a science, much like physics is a science. Statistics, like physics, can depend heavily on mathematical computations; however, un-like mathematics, statistics is the science of inference with different modes of thinking and concepts distinct from math-ematics. Moore posited that successful statistics education for the nonmath majors should include a balance of content, pedagogy, and technology.
Statistics is an important core course in most undergrad-uate business programs in the United States (Sirias, 2002). Although statistics is a core course in the sequence of busi-ness classes, many busibusi-ness students do not understand its relevance to their education or future job prospects (Zanakis & Valenzi, 1997). Many business students consider required statistics coursework to be “irrelevant to their discipline, diffi-cult, unattractive, and boring” (Selvanathan & Selvanathan, 1998, p. 1352). As a result, statistics professors are chal-lenged to present the required course content in such a way that students are motivated to engage material they initially
2 K. H. LARWIN AND D. A. LARWIN
believe is uninteresting and irrelevant (Conners, McCown, & Ewoldsen, 1998). In light of the significance of statistics and statistical reasoning in the field of business, pedagog-ical approaches that engage and entice this otherwise not-so-interested audience of future business graduates must be examined and researched.
Statistics is not a spectator sport, and learning about statis-tics should not be either. Over the last 10 years, research in statistics education has revealed that cooperative, activity-based, and technology-assisted learning are the primary ped-agogical approaches that have the potential to enhance stu-dents’ understanding, and, in effect, enhance student’s ability to effectively apply statistical concepts (Fernandez & Liu, 1999; Garfield, 2003; Garfield et al., 2002; Ware & Chastain, 1991; Yesilcay, 2000). Research indicates that a majority (over 66%) of the postsecondary level statistics professors surveyed in 2002 reported using constructivist approaches (Garfield et al.). However, although some studies examining the use of constructivist- or activity-based approaches to the teaching of statistics have shown some promise in improving student perceptions (e.g., Fernandez & Liu; Ware & Chastin; Yesilcay), more recent research (e.g., Onwuegbuzie, 2004) indicates that approximately 80% of students surveyed con-tinue to experience negative feelings and bad attitudes about their statistics education.
Recently, Rossman, Chance, Cobb, and Holcomb (2008) proposed that statistics education should move from the Ptolemaic curriculum, based on estimation procedures sup-ported by normal distribution theory, to the now techno-logically enabled random distribution theory approach. Tra-ditionally delivered statistics education is built around the concept of a normal distribution as approximating a sample distribution. The results that are computed are, at best, ap-proximations. But, with the availability and power of comput-ers today, Cobb (2007) maintained that statistics education should now evolve to the presentation of random distribution theory concepts, based on permutation tests, as the central paradigm for statistical inference (p. 12). He maintained that this approach is “simple and easier to grasp” (Cobb, p. 12) for the novice, and can encourage students to more easily embrace the logic of inference. Cobb, like Moore (1997, 2001), suggested that understanding the science of inference is fundamental to an authentic understanding of statistics and statistical applications.
Specifically, the random distribution theory approach al-lows for the rerandomizing of all possible combinations of outcomes to see what is typical and what is not. Accord-ing to Moore and McCabe (2005), resamplAccord-ing procedures represent one of the single most important developments in statistics education in a generation, without changing the fundamental reasoning of statistical inference. Resampling provides the teacher and learner with a visual presentation of random samples from the population that is not hindered by the need for normally distributed or large samples. Resam-pling helps to develop students’ understanding by providing
a medium through with students can carry out repetitions, while controlling for the number of repetitions as well as the sample size (del Mas, Garfield, & Chance, 1999). Once these repetitions are completed, students can describe and explain the behavior that they have observed with their data. Moore and McCabe maintained that these procedures are intuitively more appealing because they “appeal directly to the basis of all inference: the sampling distribution demonstrates for the student what would happen if we took many repeated samples under the same conditions” (p. 2). Researchers have found that with simulations abstract concepts such as sampling dis-tributions, confidence intervals, and conclusions regarding statistical significance become more conceptually clear to students (Rossman & Chance, 2006).
Rossman et al. (2008) developed a number of applet-type simulations that can facilitate the use of the random distri-bution theory approach in the classroom. Each of the learn-ing modules developed by Rossman et al. guide students through the ideas of randomization, repeating the random selection process through resampling, and making decisions as to whether or not the null hypothesis is plausible or should be rejected. This approach to introducing statistical inference provides students with a better chance of developing an un-derstanding of how to interpret the results of a study based on null hypothesis statistical testing; more specifically, to help them understand whatpvalues indicate. Students use these applet-type simulations to construct for themselves an un-derstanding of the connection between a randomly designed experiment, and the conclusions that result from the statisti-cal analysis.
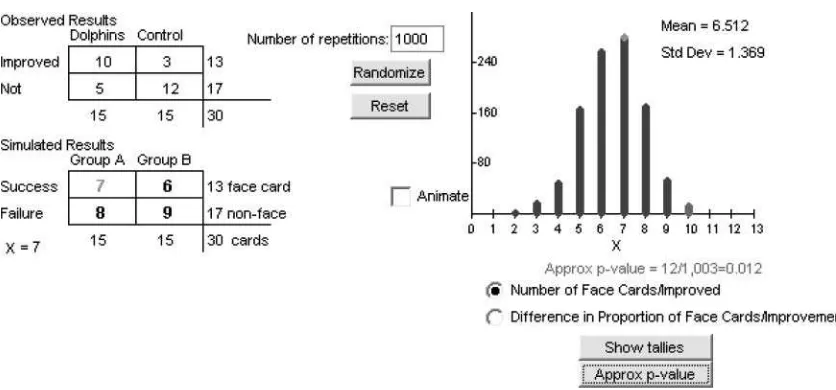
An example of one of the applets used in this investi-gation is presented in Figure 1 (http://www.rossmanchance. com/applets/Dolphins/Dolphins.html). In this simulation ac-tivity, the students are asked to consider a study conducted by Antonioli and Reveley (2005). The study examines the effec-tiveness of dolphin-mediated water therapy, relative to tradi-tional group therapy, in the treatment of mild to moderate de-pression. Students are presented with the results of the study and asked to explore whether it is possible that these findings indicate that dolphin-mediated water therapy resulted in sig-nificantly greater number of patients who showed substantial improvement, or whether the findings were simply the result of chance variation.
As can be seen in Figure 1, the observed results of the study are presented to the student. The simulation provides the student with the ability to repeatedly resample the 30 in-dividuals into the experimental and control group conditions, in an effort to see if resampling produces results as extreme as 10 improved patients in the experimental group, as was the case in the original study. The graph on the right half of Figure 1 depicts the results of one such resampling (n=
1000) and illustrates that the result of 10 patients showing improvement is clearly a rare outcome.
In the present study we sought to examine the impact of random distribution theory-based applications proposed by
FIGURE 1 Dolphin Applet example.
Cobb (2007) and developed by Rossman et al. (2008) relative to the impact of assignments based on normal distribution theory, on students’ understanding of statistical reasoning and statistical inference. Specifically, half of the students in an activity-based, cooperative learning facilitated undergrad-uate business statistics class were assigned to complete eight two-part sections of Rossman et al.’s learning modules. Their peers were asked to complete an assignment of equal diffi-culty level and time-commitment that was based on more traditional approaches. The goal of this investigation was to see if the introduction of the random distribution simulations did in fact impact student understanding of statistics and statistical inference, specifically in a statistics section that was constructed as an activity-based learning community. At present, there are no published studies in the available lit-erature in which the researchers employed an experimental design examining whether random distribution theory can facilitate students’ understanding of statistics and statistical inference. The present study is the first such attempt.
METHOD
Participants
Participants included second- and third-year undergraduate business students that ranged from 18 to 52 years of age (M = 20.82, SD =5.08), including 33 men (59.6%) and 21 women (40.4%). These university students were enrolled in a Monday-Wednesday-Friday morning business statistics course section. Students in this course were expected to de-velop the statistical tools used in business decision making, including but not limited to determination and interpretation of measures of central tendency, variance, probability, regres-sion and correlation analysis, hypothesis testing, frequency and probability distributions, and sampling issues. Students
were also introduced to graphical, tabular, and mathematical depictions of statistical information.
Instrumentation
The Assessment of Statistical Inference and Reasoning Abil-ity (ASIRA) was used to assess the students’ inferential and reasoning skills. Specifically, the ASIRA was constructed of 20 questions intended to measure both statistical reason-ing skills and understandreason-ing of statistical inference. The first 13 questions were adapted from the Statistical Reasoning Assessment (SRA) developed by Joan Garfield (2003) and further adapted for computer-administrated assessment. The last seven questions were adapted from an assessment de-veloped by Rossman et al. (2008), and were intended to measure a student’s understanding of statistical inference. This 20-question assessment took students approximately 25 min to complete. The same assessment was used for both the pre- and posttest measures. The Cronbach’s alpha, a test of internal consistency, for the pre and posttest measures was 0.79 and 0.84, respectively. A copy of the ASIRA inventory is found in Appendix A.
The student’s final course grade (based on 400 possible points) also was used to assess learning. The final course grade included 4 exam scores, 10 quiz scores, 4 application assignments, and 4 research-related assignments.
Procedure
At the beginning of the first class meeting, all students were asked to complete the ASIRA. Student names were randomly assigned to the treatment group (Random Distribution Appli-cations) or the control group (Normal Distribution Applica-tions). The original sample of students included 58 students; however, four students dropped out of the class within the first four weeks of the semester, leaving a final sample of
4 K. H. LARWIN AND D. A. LARWIN
54 students for the analyses. Students in the control and experimental groups were asked to complete their specific assignments independently, as an out-of-class homework as-signment. Other than the experimental group’s exposure to the learning modules, and the different assignments, students in both groups received the same instruction, and completed the same activities in and out of class, and completed the same quizzes each week of the semester.
The treatment group participants were given four assign-ments that were based on peer-reviewed research projects. These peer-reviewed research projects were a part of learn-ing modules developed by Rossman et al. (2008). Each one of the four assignments included two sections of Rossman et al.’s learning modules. These lessons asked students to review a brief discussion of a research project, and guided students through an application intended to develop and re-inforce student’s understanding of statistical inference.
The first assignment consisted of two mini-lessons that developed the ideas of random distribution theory using a study by Antonioli and Reveley (2005); the second assign-ment also consisted of two mini-lessons that were used to further reinforce the ideas of random distribution theory, and expanded to consideration of binomial distributions (using data from Hamlin, Wynn, & Bloom, 2007). The third as-signment also consisted of two mini-lessons and focused on random distribution with binomial models (using data from Todorov, Mandisodza, Goren, & Hall, 2005); and the fourth assignment incorporated bootstrapping procedures to further develop the idea of statistical inference (using data from Stickgold, James, & Hobson, 2000). For each of these as-signments, students read a brief description of a study, and then completed resampling procedures using playing cards or poker chips. Students responded to a few questions regard-ing their findregard-ings from their initial resamplregard-ing with the poker chips and playing cards. Students were then asked to use online applets that would repeat the resampling procedures upwards of 1000 times, and answer questions regarding their findings, based on the larger samples. On each exam, students in the treatment group were asked to respond to four ques-tions about each of the research studies and applets, which they completed.
The control group participants were also given four as-signments over the course of the semester in which they were to review and critique peer-reviewed published research projects. These assignments were estimated to require the same amount of time and the same amount of writing as the assignments given to the treatment group. Unlike the shortened research project summaries read by the treatment group as part of the learning modules, the control group par-ticipants’ assignments required that they read and respond to an entire research article. These papers incorporated the four primary topic areas being discussed during that partic-ular section of the course when the project was assigned. The four assignments included a paper by Richardson and Aguiar (2004); reporting only descriptive statistics, a study
by Materia et al. (2005) incorporating correlation analyses; a study including regression analyses by Troisi, Christopher, and Marek (2006); and a paper by Luskin, Aberman, and DeLorenzo (2006) including both at-test analysis and anal-ysis of variance (ANOVA). In a two-page response, students were asked to summarize the papers, discuss the sample and sampling procedures, the use of the data, and identify vari-ables and whether the varivari-ables were used appropriately by the researchers. Students were to defend their response with information from the class text and class notes and discus-sion. On each exam, students in the control group condition were asked to respond to four questions about each of the research studies that they reviewed.
The ASIRA was administered to the students during the first class meeting, and again during the last class meeting, in an effort to assess students’ inferential and reasoning skills. This assessment was taken at the beginning of the first and last class sessions, and was administered as a computer-adapted assessment.
RESULTS
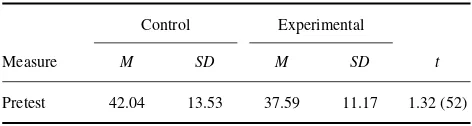
The data indicated that the control group performed slightly better on the pretest (M=42.04,SD=13.53) than did the treatment group (M=37.59,SD=11.17). The results from the pretest were examined in an effort to assess whether there were any pre-existing differences in the two study groups. An independent sample t test indicated that there were no significant differences in the pretest ASIRA scores of the students (n =54) from the two groups, t(52)=1.32,p =
.193. This data is presented in Table 1.
At the end of the semester, the ASIRA was readminis-tered to the same students (n =54). A repeated measures ANOVA was conducted and results indicated significant dif-ferences in students’ scores from pre- to posttest,F(1, 52)=
45.94, p<.001, partial η2=.469, with the pretest scores
being significantly lower (M=39.81,SD=12.49) than the posttest scores (M=53.15,SD=13.81). Additionally, sig-nificant differences were revealed between groups from pre-to posttest,F(1, 52)=17.56,p <.001, partial η2=.248.
The data are presented in Table 2.
Specifically, students in the control group showed signifi-cantly lower posttest scores on the ASIRA (M=47.22,SD=
13.25) relative to students in the treatment condition (M =
59.07,SD=11.85). An independent samplettest examining
TABLE 1
Pretest Means and Standard Deviations, by Group
Control Experimental
Measure M SD M SD t
Pretest 42.04 13.53 37.59 11.17 1.32 (52)
TABLE 2
Within- and Between-Groups Results
Source df MS F
Within groups 1 4800.00 45.94∗ ∗ ∗ Between groups 1 1792.59 17.56∗ ∗ ∗
Total 52 104.469 —
∗∗∗p <.001.
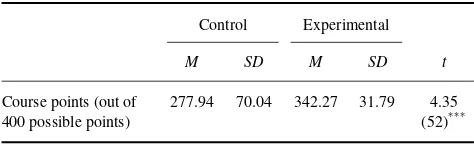
final grade point average by group also revealed significant differences,t(52)=4.35,p<.001; the control group ended
the semester with significantly fewer points (M =277.94, SD =70.04) relative to the treatment group (M =342.27, SD=31.79) based on a maximum of 400 total points. This data is presented in Table 3.
DISCUSSION
The present study demonstrated the effectiveness of pedagog-ical tools designed to introduce random distribution theory concepts to undergraduate business statistics students. Rel-ative to students in the control group who were exposed to teaching exercises based on traditional statistics instructional techniques employing normal distribution theory concepts, students in the experimental group exposed to teaching tech-niques based on random distribution theory concepts demon-strated greater mastery of course material as measured by final course point totals, and demonstrated superior gains on pre- and posttest measures of statistical inference and rea-soning skills. These findings are consistent with a growing consensus among statistical researchers and educators that statistics instruction would prosper from a shift in focus from normal distribution theory to random distribution theory. The present study represents the first empirical demonstration of the veracity of these assertions.
One possible limitation to the current investigation is the difference between the assignments for the experimental and control groups. The learning modules were originally writ-ten with three sections in each module. The decision was made to assign only two sections of the learning modules for each assignment, in an effort to make the time
neces-TABLE 3
Final Grade Point Average for Students in the Control Group Relative to Experimental Group
Control Experimental
M SD M SD t
Course points (out of 400 possible points)
277.94 70.04 342.27 31.79 4.35 (52)∗ ∗ ∗
∗∗∗p <.001.
sary to complete the assignment equivalent to the control group assignments. Students from prior semesters reported that the completion time for one section of the simulation assignment was approximately 30–45 min; students reported spending approximately 1 hr on their article assignments. An-other possible criticism of the experimental conditions of the present study might concern the fun factor of the simulation assignments relative to the article assignments. It is arguable that the greater fun and enjoyment associated with the exper-imental group exercises was responsible for the gains in the experimental group relative to the control group, rather than the shift in focus to the random distribution theory-based techniques. However, the control group articles were chosen because of their relevance to the students’ lives and the po-tential tie-in with the business students’ other coursework. Although reading and responding to an article may not be as entertaining for the student as working through activities with a computerized simulator, these articles do offer the student an opportunity to apply the knowledge covered in required course matter.
At the 2005 U.S. Conference on Teaching Statistics, Cobb (2005) insisted that statistics educators should stop focusing on classical methods of approximation, such asttests and F tests, and introduce the concepts of statistical inference with simulations and randomization. Cobb posited that with the present availability of computer technology, the time has come to leave behind the teaching of outdated approximation procedures based on assumptions of normal distribution the-ory. He maintained that the logic of inference should be intro-duced through randomization and bootstrapping techniques through which students can observe randomization proce-dures and how statistical conclusions come about through these randomization simulations.
In the present study we sought to incorporate the coop-erative learning approaches, heavily supported in the liter-ature, with the random distribution applications suggested by Cobb (2007). Although 30 years of research suggests that constructivist approaches to teaching statistics should improve student attitudes and learning, research continues to suggest that these approaches are not in fact alleviating the negative feelings shared by an overwhelming majority of students surveyed regarding their statistics education (e.g., Onwuegbuzie, 2004). The results of the present investiga-tion suggest that students can benefit from an introducinvestiga-tion to the ideas of statistical inference based on randomization and bootstrapping techniques. In addition to the much sup-ported constructivist pedagogy, random distribution simula-tions, such as those developed by Rossman et al. (2008), can help to improve student perceptions regarding the dif-ficulty and relevance of statistics to their future business careers.
According to Johnson and John (2003), the aim of busi-ness statistics coursework is to develop statistical thinking skills that help students to understand and interpret data. They maintained that in order to achieve this objective
6 K. H. LARWIN AND D. A. LARWIN
students must be engaged not only in the course informa-tion, but actively work at discovering the meaning of data, the importance and relevance of statistical concepts, and they must be actively involved in constructing an understanding of the influence of data where different distributions, different sample sizes, and differing degrees of variability are at play. The random distribution theory approach to teaching and learning statistics provides business professors with a tool that can engage students to construct an understanding of statistics at this level. Teaching traditional estimation ap-proaches may result in students who understand the subtle nuances of abstract statistical theory, but who also continue to struggle to actually use statistical methods to analyze data effectively. One student involved in the present study, as a participant in the experimental group, who had previously completed an AP statistics course in high school and an in-troductory level statistics class in his first year in college, indicated in an email: “although I have had statistics in the past, and did very well in those classes, I did not realize until now what I did not understand. The idea of ‘significantly different than what would be expected to occur by chance’ had no real meaning until I completed these simulation as-signments. So, thank you. I thought I might be bored in this class, but now I know that I really do understand the concepts that are foundational to statistics.”
Today’s business student is interested in more than the tra-ditional talk and chalk lecture, coupled with well-meaning assignments, followed by midterm and final exams. Activi-ties using random distribution theory, such as those presented here, can engage and intrigue students, and enhance their understanding and their performance in their present course-work and enhance their ability to think statistically in their future professional and academic careers.
REFERENCES
Antonioli, C., & Reveley, M. (2005). Randomized controlled trial of animal facilitated therapy with dolphins in treatment of depression.Behavior Modification,26(11), 1–13.
Bradstreet, T. E. (1996). Teaching introductory statistics courses so that non-statisticians experience statistical reasoning.The American Statistician,
The American Statistician,50, 69–78.
Caine, R. N., & Caine, G. (1991).Making connections: Teaching and the hu-man brain. Alexandria, VA: Association for Supervision and Curriculum Development.
Cobb, G. (2005, May).The introductory statistics course: A saber tooth cur-riculum?Plenary address at the 2005 United States Conference on Teach-ing Statistics, Columbus, OH. Retrieved from http://www.causeweb.org/ uscots/uscots05/plenary/
Cobb, G. (2007) The introductory statistics course: A ptolemaic curricu-lum? Technology Innovations in Statistics Education. Retrieved from http://repositories.cdlib.org/uclastat/cts/tise/vol1/iss1/art1
Conners, F., McCown, S., & Ewoldsen, B. (1998). Unique challenges in teaching undergraduate statistics.Teaching of Psychology,25, 40–42. Del Mas, R., Garfield, J., & Chance, B. (1999). A model of classroom
research in action: Developing simulation activities to improve students’ statistical reasoning.Journal of Statistics Education,7(3). Retrieved from http://www.amstat.org/publications/jse/secure/v7n3/delmas.cfm
Fernandez, G. C., & Liu, L. (1999). A technology-based teaching model that stimulates statistics learning.Computers in the Schools,16, 173– 191.
Garfield, J. B. (2003). Assessing statistical reasoning. Statistics Educa-tion Research Journal, 2(1), 22–38. Retrieved from http://fehps.une. edu.au/F/s/curric/cReading/serj/current issue/SERJ2(1).pdf
Garfield, J. B., Hogg, B., Schau, C., & Whittinghill, D. (2002). First courses in statistical science: The status of educational reform efforts.Journal of Statistics Education,10(2), 1–19.
Gordon, S. (1995). A theoretical approach to understanding learners of statistics.Journal of Statistics Education,3(3), 1–21.
Hamlin, J. K., Wynn, K., & Bloom, P. (2007, November).Social evaluations by preverbal infants. Presented at the meeting of the Society for Research in Child Development, Boston, MA.
Higgins, J. J. (1999). Undergraduate statistics education: What should change?The American Statistician,53, 13–27.
Hollis, P. J. (1997). Ideas for improving statistics education. Interna-tional Journal of Mathematics, Education, Science, and Technology,28, 569–573.
Johnson, D. G., & John, J. A. (2003). Use of demonstrations and experi-ments in teaching business statistics.Journal of Applied Mathematics and Decision Sciences,7, 93–103.
Luskin, F., Aberman, R., & DeLorenzo, A. (2006). The training of emotional competence in financial services advisors. Retrieved from http://www.eiconsortium.org/pdf/training of emotional competence in financial services advisors.pdf
Materia, E., Cacciani, L., Bugarini, G., Cesaroni, G., Davoli, M., Mirale, M. P.,. . .Perucci, C. (2005). Health inequalities: Income inequality and
mortality in Italy.European Journal of Public Health,15, 411–417. Moore, D. S. (1997). New pedagogy and new content: The case of statistics.
International Statistical Review,65, 123–165.
Moore, D. S. (2001, August).Statistical literacy and statistical competence in the new century. IASE Satellite Conference on Statistical Literacy in Seoul, Korea.
Moore, D. S., & McCabe, G. (2005).Supplementary chapter 14: Boot-strapping methods and permutation test. Introduction to the Practice of Statistics. Montreux, Switzerland: W. H. Freeman. Retrieved from http://bcs.whfreeman.com/ips5e/content/cat 080/pdf/moore14.pdf Obwuegbuzie, A. J. (2004). Academic procrastination and statistics anxiety.
Assessment & Education in Higher Education,29, 3–19.
Richardson, J., & Aguiar, L. K. (2004). Consumer change in fast food preference. Retrieved from http://www.ifama.org/conferences/2004 Conference/Papers/Richardson1004.pdf
Rossman, A., & Chance, B. (Eds.). (2006, May).Working cooperatively in statistics education.Proceedings of the Seventh International Confer-ence on Teaching Statistics, Voorburg, The Netherlands. Retrieved from http://www.stat.auckland.ac.nz/∼iase/publications.php?show=17 Rossman, G., Chance, B., Cobb, D., & Holcomb, J. (2008, January).
Intro-ducing concepts of statistical inference: A randomization based curricu-lum. Proceedings from the Introducing Concepts of Statistical Inference Workshop presented at the Joint Mathematics Meetings, San Diego, CA. Selvanathan, E. A., & Selvanathan, S. (1998, July).Teaching statistics to business students: Making it a success. International Conference on Teaching Statistics, Singapore. Retrieved from http://www.stat.auckland. ac.nz/∼iase/publications/2/Topic9ze.pdf
Sirias, D. (2002). Using graphic organizers to improve the teaching of busi-ness statistics.Journal of Education for Business,78, 33–37.
Stickgold, R., James, L., & Hobson, J. A. (2000). Visual discrimination learning requires sleep after training.Nature Neuroscience,3, 1237– 1238.
Todorov, A., Mandisodza, A. N., Goren, A., & Hall, C. C. (2005, June 10). Inferences of competence from faces predict election outcomes.Science,
308, 1623–1626.
Troisi, J. D., Christopher, A. N., & Marek, P. (2006). Materialism and money spending disposition as predictors of economic and personality variables.
North American Journal of Psychology,8, 421–436.
Ware, M. E., & Chastain, J. D. (1989). Computer assisted statistical analysis: A teaching innovation?Teaching of Psychology,16, 222–227. Yesilcay, Y. (2000). Research project in statistics: Implications of a case
study for the undergraduate statistics curriculum.Journal of Statistics Education,8(2), 1–14.
Zanakis, S. H., & Valenzi, E. (1997). Student anxiety and attitudes in busi-ness statistics.Journal of Education for Business,73, 10–16.
APPENDIX A
Assessment of Statistical Inference and Reasoning Ability
1. A small object was weighed on the same scale sepa-rately by nine students in a science class. The weight (in grams) recorded by each student was as follows: 6.2, 6.0, 6.0, 15.3, 6.1, 6.3, 6.2, 6.15, 6.2. The students want to determine as accurately as they can the ac-tual weight of this object. Of the following methods, which would you recommend they use.
A. Use the most common number, which is 6.2. B. Use the 6.15 since it is the most accurate
weighting.
C. Add up the nine numbers, and divide by nine. D. Throw out the 15.3, and add up the 8 numbers
and divide by 8.
Answer: D
2. The following message is printed on a bottle of pre-scription medicine: WARNING—For applications to skin areas there is a 15% chance of developing a rash. If a rash develops, consult your physician. Which of the following options is the best interpretation of this warning?
A. Don’t use this medication on your skin; there’s a good chance of developing a rash.
B. For application to the skin, apply only 15% of the recommended dose.
C. If a rash develops, it will probably only involve 15% of the skin.
D. About 15 of 100 people who use this medica-tion develop a rash.
E. There is hardly a chance of getting a rash using this medication.
Answer: D
3. A teacher wants to change the seating arrangement in her class in the hope that it will increase the number of comments her students make. She first decides to see how many comments students make with the current seating arrangement. A record of the number of comments made by her eight students during one class period was as follows: 0, 5, 2, 22, 3, 2, 1, 2. The teacher wants to summarize this data by computing the typical number of comments made that day. Of
the following methods, which would you recommend she use?
A. Use the most common number, which is 2. B. Add up the eight numbers and divide by eight. C. Throw out the 22, add up the remaining seven
numbers and divide by seven.
D. Throw out the zero, add up the remaining seven numbers and divide by seven.
Answer: A
4. The Springfield Meteorological Center wanted to de-termine the accuracy of their weather forecasts. They searched their record for those days when the fore-caster had reported a 70% chance of rain. They com-pared these forecasts to records of whether or not it actually rained on those particular days. The forecast of 70% chance of rain can be considered very accurate if it rained on:
A. 95%-100% of the days. B. 85%-94% of the days. C. 75%-84% of the days. D. 65%-74% of the days. E. 55%-64% of the days.
Answer: D
5. Two containers, labeled A and B, are filled with red and blue marbles in the following quantities: Con-tainer A has 6 red and 4 blue; ConCon-tainer B has 60 red and 40 blue. Each container is shaken vig-orously. After choosing one of the containers, you will reach in and, without looking, draw out a mar-ble. If the marble is blue, you win$50. Which con-tainer gives you the best chance of drawing a blue marble?
A. Container A B. Container B
C. Equal chance from each container
Answer: C
6. Which of the following sequences is most likely to result from flipping a fair coin 5 times?
A. HHHTT B. THHTH C. THTTT D. HTHTH
E. All four sequences are equally likely
Answer: E
7. Listed below are the same sequences of Heads and Tails that were listed in item eight. Which of the sequences is least likely to occur?
A. HHHTT B. THHTH
8 K. H. LARWIN AND D. A. LARWIN
C. THTTT D. HTHTH
E. All four sequences are equally unlikely.
Answer: E
8. Half of the newborns are girls and half are boys. Hospital A records an average of 50 births a day. Hospital B records an average of 10 births a day. On a particular day, which hospital is more likely to record 80% or more female births?
A. Hospital A B. Hospital B
C. The two hospitals are equally likely to report such an event.
Answer: B
9. The school committee of a small town wanted to determine the average number of children per house-hold in their town. They divided the total number of children in the town by 50, the total number of house-holds. Which of the following statements must be true if the average children per household is 2.2?
A. Half the households in the town have more than two children.
B. More households in the town have three chil-dren than have two chilchil-dren.
C. There are a total of 110 children in the town. D. There are 2.2 children in the town for every
adult.
E. The most common number of children in a household is 2.
F. None of the above
Answer: C
10. When two dice are simultaneously thrown it is possi-ble that one of the following two results occurs: (1) A 5 and a 6 are obtained or (2) a five is obtained twice. Select the most valid response:
A. The chances of obtaining each of these results are equal.
B. There is more chance of obtaining result (1). C. There is more chance of obtaining result (2). D. It is impossible to give an answer.
Answer: B
11. When three dice are simultaneously thrown, which of the following is most likely to be obtained?
A. A 5, a 3, and a 6 B. A five three times C. A five twice and a 3
D. All three results are equally likely.
Answer: A
12. When three dice are simultaneously thrown, which of these three results is least likely to occur?
A. A 5, a 3, and a 6 B. A five three times C. A five twice, and a three
D. All three results are equally likely.
Answer: B
13. For one month, 500 elementary students kept a daily record of the hours spent watching television. The average number of hours reported was 28. The researcher conducting the study also obtained re-port cards for each of the students. They found that the students who did well in school spent less time watching television than those students who did poorly. Listed below are several responses re-garding the results of this research. Which is most valid?
A. The sample size of 500 is too small to permit drawing conclusions.
B. If a student decreased the amount of time spent watching television, his or her performance in school would improve.
C. Even though students who did well watched less television, this doesn’t necessarily mean that watching television hurt school perfor-mance.
D. One month is not long enough period of time to estimate how many hours the student really spend watching television.
E. The research demonstrates that watching tele-vision causes poorer performance in school. F. I don’t agree with any of these statements.
Answer: C
14. You are investigating a claim that men are more likely than women to snore. You take a random sample of men and a random sample of women and ask whether they snore (according to family members). If the dif-ference in the proportions (who snore) between the two groups turns out not to be statistically signifi-cant, which of the following is the best conclusion to draw?
A. You have found strong evidence that there is no difference between the groups.
B. You have not found enough evidence to con-clude that there is a difference between the groups.
C. Because the result is not significant, the study does not support any conclusion.
Answer: B
15. If the difference in the proportions (who snore) be-tween the two groups does turn out to be statisti-cally significant, which of the following is a valid conclusion?
A. It would not be surprising to obtain the ob-served sample results is there is really no dif-ference between men and women.
B. It would be very surprising to ob-tain the observed sample results if there is really no difference between men and women.
C. It would be very surprising to obtain the ob-served sample results if there is really a differ-ence between men and women.
Answer: B
16. Suppose that the difference between the sample groups turns out not to be significant, even though your review of the research suggested that there re-ally is a difference between men and women. Which conclusion is reasonable?
A. Something went wrong with the analysis. B. There must not be a difference after all. C. The sample size might have been too
small.
Answer: C
17. If the difference in the proportions (who snore) be-tween the two groups does turn out to be statistically significant, which of the following is a possible ex-planation for this result?
A. Men and women do not differ on this issue but there is a small chance that random sam-pling alone led to the difference we observed between the two groups.
B. Men and women differ on this issue. C. Either of the other explanations is possible.
Answer: C
18. Reconsider the previous question. Now think about not possible explanations but ‘plausible’ explana-tions. Which is the more plausible explanation for the result?
A. Men and women do not differ on this issue but there is a small chance that random sam-pling alone led to the difference we observed between the two groups.
B. Men and women differ on this issue. C. These explanations are equally plausible. Answer: B
19. Suppose that two different studies are conducted on this issue. Study A finds that 40 our of 100 women sampled report snoring, compared to 20 of 100 men. Study B finds that 35 of 10 women report snoring, compared to 25 of 100 men. Which study provides stronger evidence that there is a difference between men and women on this issue?
A. Study A B. Study B
C. The strength of evidence would be similar for these two studies.
Answer: A
20. Suppose two more studies are conducted on this is-sue. Both studies find that 30% of women sampled report snoring, compared to 20% of men. But Study C consists of 100 people of each gender, while Study D consists of 40 people of each gender. Which study provides stronger evidence that there is a difference between men and women on this issue.
A. Study C B. Study D
C. The strength of evidence would be similar for these two studies.
Answer: A