Full Terms & Conditions of access and use can be found at
http://www.tandfonline.com/action/journalInformation?journalCode=cbie20
Download by: [Universitas Maritim Raja Ali Haji] Date: 17 January 2016, At: 23:28
Bulletin of Indonesian Economic Studies
ISSN: 0007-4918 (Print) 1472-7234 (Online) Journal homepage: http://www.tandfonline.com/loi/cbie20
Twenty Years of Expenditure Inequality in
Indonesia, 1993–2013
Arief Anshory Yusuf, Andy Sumner & Irlan Adiyatma Rum
To cite this article: Arief Anshory Yusuf, Andy Sumner & Irlan Adiyatma Rum (2014) Twenty Years of Expenditure Inequality in Indonesia, 1993–2013, Bulletin of Indonesian Economic Studies, 50:2, 243-254, DOI: 10.1080/00074918.2014.939937
To link to this article: http://dx.doi.org/10.1080/00074918.2014.939937
Published online: 30 Jul 2014.
Submit your article to this journal
Article views: 1049
View related articles
View Crossmark data
Bulletin of Indonesian Economic Studies, Vol. 50, No. 2, 2014: 243–54
ISSN 0007-4918 print/ISSN 1472-7234 online/14/000243-12 © 2014 Indonesia Project ANU http://dx.doi.org/10.1080/00074918.2014.939937
TWENTY YEARS OF EXPENDITURE INEQUALITY IN
INDONESIA, 1993–2013
Arief Anshory Yusuf Andy Sumner
Padjadjaran University King’s College London
Irlan Adiyatma Rum
Padjadjaran University
In this article, we consider the recent increase in inequality in Indonesia. We make new, consistent estimates of expenditure inequality for 1993–2013, using sever-al measures that draw on household expenditure data from the Nationsever-al Socio-economic Survey (Susenas) for 1993–2013. In doing so, we note that the central sta-tistics agency, Badan Pusat Statistik (BPS), used grouped data for its estimates of inequality until 2009 and that this underestimated inequality up to then. Thus the rise in inequality reported since 2009 actually has a longer history. We argue that Indonesia experienced divergence and convergence at the same time: the
magni-tude of the rise in inequality was signiicant (divergence), but the rise was greatest
in provinces or districts with low initial levels of inequality (convergence). We con-sider the literature on drivers of changes in inequality and identify a set of
hypoth-eses, with an empirical basis, which we introduce as potential Indonesian-speciic
drivers of rising inequality for future exploration.
Keywords: inequality, Gini, Theil, distribution
JEL code: D63
INTRODUCTION
Inequality in Indonesia has recently become more visible in the public policy
debate because the Gini coeficient has risen to the highest point ever reported by
Badan Pusat Statistik (BPS), the central statistics agency. In light of this, we con-sider a set of indicators of expenditure inequality between 1993 and 2013, in order
to assess the signiicance of this rise across a range of measures.
As is well known, expenditure survey data, such as those from Indonesia’s National Socio-economic Survey (Susenas), understate income (and asset) in equality because they ignore savings, for example, while top incomes largely elude surveys (see, for details, Leigh and Van der Eng 2010). These are inherent
shortcomings of all such surveys, not just Indonesia’s, and Cornwell and Anas
(2013) note ongoing attempts by BPS to address them. Unmeasured expenditure, too, is a serious concern in Susenas and similar surveys; Nugraha and Lewis
(2013) ind that inequality is lower once non-market income is considered. (In
contrast, non-market consumption is already included in Susenas.)
244 Arief Anshory Yusuf, Andy Sumner, and Irlan Adiyatma Rum
If one reviews existing studies of inequality in Indonesia, there are two points
worth noting: First, some studies argue that expenditure inequality was rela
-tively low before the 1997–98 Asian inancial crisis and had not increased nota -bly as a result of economic growth—in short, growth has been distributionally neutral (Akita, Kurniawan, and Miyata 2011; Hill 2008; Hill, Resosudarmo, and Vidyattama 2008; Van der Eng 2009). However, others argue that inequality was
relatively high or rising even before the crisis (Frankema and Marks 2009; Leigh and Van der Eng 2010; Van Leeuwen and Foldvari 2012). Second, a number of
studies have argued that intragroup, urban-to-rural inequality and interregional inequality have increased since the crisis (Akita 2002; Akita and Miyata 2008;
Sakamoto 2007; Skouias 2001; Suryadarma et al. 2005, 2006).
NEW ESTIMATES OF EXPENDITURE INEQUALITY, 1993–2013 Methodological Approach
We make new estimates of the evolution of expenditure inequality in Indonesia for 1993–2013, using data from Susenas.1 To establish patterns in the data, we esti-mate the following indicators of inequality: the Gini coeficient (using individuals’
data); the decile dispersion ratio of the average consumption of the richest 10% of the population to the average consumption of the poorest 10%; and the inter-regional disparity by the Theil index of interprovincial inequality and inter district inequality. We decompose inequality by different subgroups of population and by region, using the decomposition technique of Haughton and Khandker (2009). This makes it possible to estimate the contributions of urban and rural inequality and interprovincial disparity to total inequality.
The Lorenz Curve and Gini Coeficient
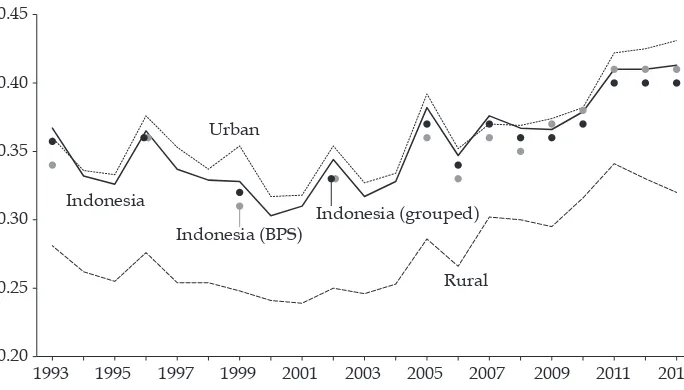
Our estimates suggest that Indonesia’s Gini coeficient, using individuals’ data, rose from 0.36 to 0.41 between 1993 and 2013 (igure 1). If we were to use grouped data (the 10 consumption deciles), as BPS did prior to 2009, we would ind that
this estimate would be lower. BPS has not published its exact approach to estimat-ing inequality, as far as we know. If we were to group the data into 10 deciles, we would produce observations close to but not the same as those published by BPS. Given that grouping the data degrades the estimates, we prefer to use
individu-als’ data. Figure 2 shows the shifts in the Lorenz curve from 1993 to 2003 to 2013;
as the curve shows, inequality fell between 1993 and 2003 and then rose between 2003 to 2013 (by more than it had fallen in the preceding decade)—in short, the inverse of the Kuznets curve (that inequality rises in the early stages of develop-ment and then falls).
We ind that the Gini coeficient was stable, if not decreasing slightly, before the 1997–98 crisis. After the crisis, however, the Gini coeficient showed a strong
1. Susenas is a series of large-scale multi-purpose socio-economic surveys initiated in 1963–64 . Since 1993, Susenas surveys have covered a nationally representative sample of around 200,000 households. Each survey contains a core questionnaire (which consists of a household roster requesting the gender, age, marital status, and educational attainment of household members), supplemented by modules that cover about 60,000 households, rotated over time, and collect additional information on, for example, health care and nu-trition, income and expenditure, and labour force activity (Surbakti 1995).
FIGURE 1 Gini Coeficient in Indonesia and Urban and Rural Areas, 1993–2013
1993 1995 1997 1999 2001 2003 2005 2007 2009 2011 2013 0.20
0.25 0.30 0.35 0.40 0.45
Indonesia
Urban
Rural Indonesia (BPS)
Indonesia (grouped)
Source: Authors’ calculations based on data from the National Socio-economic Survey (Susenas).
FIGURE 2 Lorenz Curves for 1993, 2003, and 2013 1.0
20
0.2 45° line
1993 2003 2013 0.4
0.6 0.8
0.0 0
Percentile
40 60 80 100
Source: Authors’ calculations based on data from the National Socio-economic Survey (Susenas).
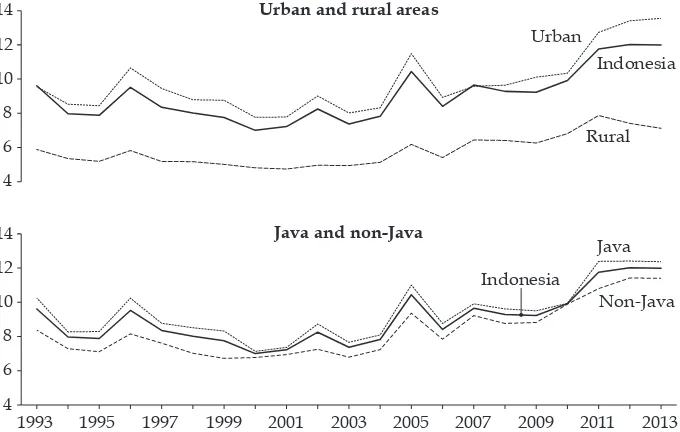
FIGURE 3 Gini Coeficient in Java and Non-Java,
1993 1995 1997 1999 2001 2003 2005 2007 2009 2011 2013 0.20
Source: Authors’ calculations based on data from the National Socio-economic Survey (Susenas).
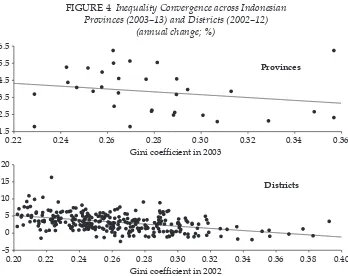
FIGURE 4 Inequality Convergence across Indonesian Provinces (2003–13) and Districts (2002–12)
(annual change; %)
0.20 0.22 0.24 0.26 0.28 0.30 0.32 0.34 0.36 0.38 0.40 Districts
0.26 0.28 0.30 0.32 0.34 0.36
Provinces
Gini coefficient in 2003
Gini coefficient in 2002
Source: Authors’ calculations based on data from the National Socio-economic Survey (Susenas).
Note: 2003–13 data used for provinces and 2002–12 data used for districts, owing to sample size in 2013.
Twenty Years of Expenditure Inequality in Indonesia, 1993–2013 247
upward trend in both urban and rural areas, as well as across regions in Indonesia,
such as in Java and in the non-Java islands (igure 3). Indonesia’s Gini rose by
32%, from 0.32 in 2003 to 0.43 in 2013. In rural areas it rose by 30%, from 0.25 in 2003 to 0.32 in 2013. This trend is slightly stronger in rural areas outside Java than those in Java. Our provincial- and district-level analysis captures a pattern of
convergence (see igure 4): the rate of increase in the Gini coeficient tended to be
faster in provinces with initially low inequality, and vice versa.2
Top Incomes and the Decile Dispersion Ratio
The decile dispersion ratio is the ratio of the mean expenditure of the richest 10% of households (as captured in Susenas) to that of the poorest 10% of households.3 Figure 5 shows the development of the decile dispersion ratio from 1993 to 2013
for Indonesia, urban areas, rural areas, Java, and non-Java regions. Between 1993 and 2013, the decile dispersion ratio declined moderately prior to the 1997–98 cri-sis, fell further during the cricri-sis, and increased rapidly after the crisis up to 2013.
The trend in the decile dispersion ratio over the last decade suggests that
in equality rose more notably than that made visible by the Gini coeficient (igure 5 versus igure 3). From 2003 to 2013, for example, the decile ratio for Indone -sia rose by 63%, or 0.46 points, every year, which is triple the 0.13-point-a-year rise from 1990 to 1997. The rising decile dispersion ratio is more prominent in urban areas and in Java: in urban areas the gap between the richest 10% and the
2. The regression of the change in the Gini coeficient as a function of its initial level con
-irms the convergence at both district and provincial level. The coeficient of the initial value is negative and statistically signiicant at the 1% level.
3. For analysis of top incomes see in particular Leigh and Van der Eng’s (2010) study.
FIGURE 5 Ratio of Mean Expenditure of 10% Richest to 10% Poorest Households, 1993–2013
1993 1995 1997 1999 2001 2003 2005 2007 2009 2011 2013 4
Source: Authors’ calculations based on data from the National Socio-economic Survey (Susenas).
248 Arief Anshory Yusuf, Andy Sumner, and Irlan Adiyatma Rum
poorest 10% widened by around 69% between 2003 and 2013. In rural areas the
gap between the top and bottom income groups also grew signiicantly, albeit
more slowly.
Interregional Inequality
The inal dimension of income disparity in Indonesia that we consider is
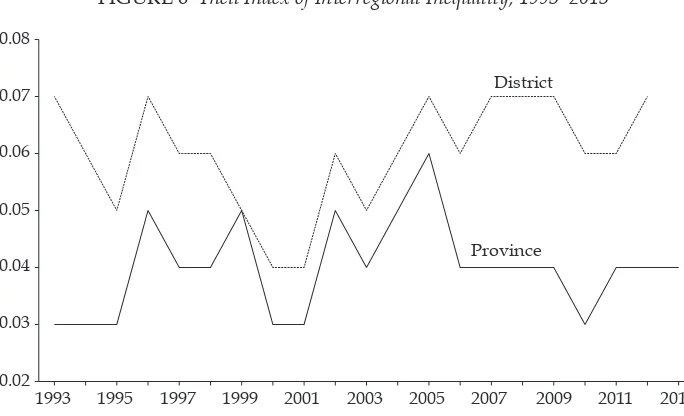
inter-regional inequality, of which the Theil index is one of the most common measures. We calculate it here for both interprovincial inequality and interdistrict inequality.
The result is shown in igure 6. The estimates suggest that, for each year,
inter-regional inequality was always higher among districts than among provinces. Yet the data show that interregional disparity has not increased over the last 20 years if one takes the period as a whole. However, the decline in the 1990s and the rise
in the 2000s are especially noticeable at the district level. (igure 6).4
The Contribution of Between- and Within-Group to Inequality
The discussion so far, on different indicators of inequality, suggests that inequal-ity in Indonesia has risen rapidly in the last 10 years, after having been some-what stable, and even declining slightly, prior to the 1997–98 crisis. There are also some measures of inequality, such as the generalised entropy index, that can be
4. We also calculated the ratio of mean expenditure per capita between Java and non-Java, and between the non-eastern and eastern regions of Indonesia. The ratio for non-eastern to eastern regions was always higher than that of Java to non-Java, because Indonesia’s
east-ern region is still lagging in economic development. The gap changed little in the irst part
of the period, but it narrowed during the most recent period. This is more or less consistent with the development of the Theil index, but there was a greater convergence in the ratio near the end of the period. In sum, it is clear that the gap between more and less developed regions in Indonesia has narrowed gradually over the last 10 years.
FIGURE 6 Theil Index of Interregional Inequality, 1993–2013
District
Province
1993 1995 1997 1999 2001 2003 2005 2007 2009 2011 2013 0.02
0.03 0.04 0.05 0.06 0.07 0.08
Source: Authors’ calculations based on data from the National Socio-economic Survey (Susenas).
Twenty Years of Expenditure Inequality in Indonesia, 1993–2013 249
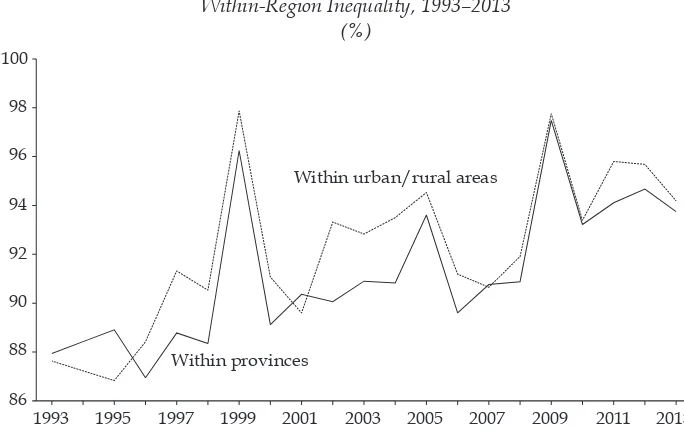
FIGURE 7 Share of Inequality (Generalised Entropy) Explained by Within-Region Inequality, 1993–2013
(%)
1993 1995 1997 1999 2001 2003 2005 2007 2009 2011 2013 86
88 90 92 94 96 98 100
Within provinces
Within urban/rural areas
Source: Authors’ calculations based on data from the National Socio-economic Survey (Susenas). decomposed into inequality of individual households within one particular group
and inequality within those particular groups. For example, looking at igure 7,
we can say that inequality in Indonesia in 2013 was driven primarily (93.7%) by within-province inequality. Inequality between provinces contributed only 6.3% to overall inequality. Similar patterns are evident between urban and rural areas. Inequality between urban and rural areas contributes only a small proportion (5.8%) to inequality in Indonesia. The largest contribution comes from inequality within urban and rural areas.
Looking at the trends in the share of inequality between provinces and between
urban and rural areas, we ind that the data suggest that the contribution of
inequality between provinces and between urban and rural areas has declined
consistently since 1993. Conversely, the contribution of inequality of individual
households within provinces and within urban and rural areas has increased
con-sistently (igure 7). The explanation for this trend, drawing on the earlier discus -sion, is simply that rising inequality in Indonesia since 2003 has been common or uniform across geographical locations, whereas the gap between regions has been either consistent or decreasing slightly in more recent years.
THE DRIVERS OF CHANGES IN INEQUALITY IN INDONESIA The Pattern of Economic Growth
One proximate cause of increasing inequality in Indonesia is the pattern of eco-nomic growth. Table 1 shows the growth rate in real per capita expenditure dur-ing four periods: the last period, 2003–13, represents the post-crisis and reformasi era. We calculate the growth rate in annual real expenditure per capita for differ-ent poverty lines and consumption percdiffer-entiles (to avoid determinism): the mean
of the population, the median of the whole population, the poor as deined by the
250 Arief Anshory Yusuf, Andy Sumner, and Irlan Adiyatma Rum
national poverty line, the poor as deined by the $2-a-day moderate international
poverty line (2005 PPP dollars), and several consumption percentiles.5
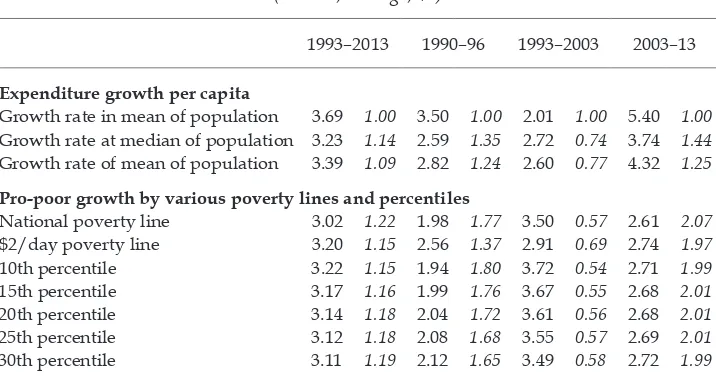
Looking at growth during 1993–2013, we see that while the growth rate in expenditure per person of the mean of population was 3.7% per year, the growth rates of the national-poverty-line poor and the $2-a-day poor were 3.0% and 3.2%, respectively. In other words, by the national poverty line the expenditure per cap-ita of the average population grew 22% faster than that of the poor, and grew 15% faster by the $2-a-day, moderate international poverty line.
The ‘pro-poorness’ of growth has worsened since the start of the reformasi era. By the national poverty line, during 1990–1996, in the pre-reformasi era, the growth of the average population was 77% faster than the growth of the poor; during 2003–13 the growth in expenditure per capita of the (mean) average popu-lation was more than twice (2.1 times) the growth rate of the poor (5.4% versus
2.6%). For the period 1990–96 the annual average growth rate of expenditure per
person (in real terms) was 3.5% a year—or 37% faster than that of those living on less than $2 a day, at 2.6% a year. In the reformasi era, however, the annual average growth rate of expenditure per person in the average population was 97% faster than that of those living on less than $2 a day. In short, there is a big difference between the two periods.
Potential Drivers of Inequality in Indonesia
The global literature has identiied a set of factors that drive expenditure inequal -ity (see UNDP 2014 for a recent substantial review of conceptual and empirical literature). One way of grouping these factors is into exogenous and endogenous
5. On international poverty lines, see Sumner and Edward’s (2014) study, in this issue. TABLE 1 Indonesia’s Rates of Pro-poor Growth, 1990–2013
(annual, average; %)
1993–2013 1990–96 1993–2003 2003–13
Expenditure growth per capita
Growth rate in mean of population 3.69 1.00 3.50 1.00 2.01 1.00 5.40 1.00 Growth rate at median of population 3.23 1.14 2.59 1.35 2.72 0.74 3.74 1.44 Growth rate of mean of population 3.39 1.09 2.82 1.24 2.60 0.77 4.32 1.25
Pro-poor growth by various poverty lines and percentiles
National poverty line 3.02 1.22 1.98 1.77 3.50 0.57 2.61 2.07 $2/day poverty line 3.20 1.15 2.56 1.37 2.91 0.69 2.74 1.97 10th percentile 3.22 1.15 1.94 1.80 3.72 0.54 2.71 1.99 15th percentile 3.17 1.16 1.99 1.76 3.67 0.55 2.68 2.01 20th percentile 3.14 1.18 2.04 1.72 3.61 0.56 2.68 2.01 25th percentile 3.12 1.18 2.08 1.68 3.55 0.57 2.69 2.01 30th percentile 3.11 1.19 2.12 1.65 3.49 0.58 2.72 1.99
Source: Authors’ calculations based on data from the National Socio-economic Survey (Susenas).
Note: Figures in italics are the ratios of the growth rate in the mean population to the respective popu -lation groups. Methodology based on Ravallion and Chen (2003).
Twenty Years of Expenditure Inequality in Indonesia, 1993–2013 251
drivers. The former relate to shifting global trade and inance patterns and techni -cal change; the latter to macroeconomic policies, labour market polices, wealth
inequality, iscal policy (taxation and transfers), and government spending on
public goods.6
The causes of recent changes in inequality in Indonesia are complex, but it is
possible to identify a set of speciic factors, with suficient empirical evidence,
that would be worthy of future exploration. In Indonesia, exogenous examples
of these factors relate to trade. For example, Indonesia experienced a commodity
boom in coal and palm oil during 2000s, in particular, which may have increased
inequality. Coal production more than tripled and palm oil production quad -rupled during 2000–11 (Burke and Resosudarmo 2012, 318). Yusuf et al. (2013) use a computable general equilibrium model to show that the commodity boom increased inequality but that those changes in inequality were due to world prices of mining commodities rather than those of estate crops.7 Suryahadi,
Hadiwid-jaja, and Sumarto (2012) note that changing sectoral contributions to growth are associated with slowing poverty reduction, and thus potentially with changes in inequality. The commodity boom hypothesis could be advanced to explain the widening gap between poor and rich groups within rural areas.
During more or less the same period (as discussed above), there has been a rise in the prices of commodities—particularly of Indonesia’s traditional export com-modities, such as estate crops. These estate crops are grown mainly in rural areas
and owned by rural landowners. The richer rural households will beneit
dis-proportionately from this boom. We can see the signs of this mechanism at work by comparing inequality in rural areas in Java and non-Java regions, because most estate crop plantations are outside Java. A second exogenous factor related to trade is that of rice prices, which rose by 20% during 2003–5 after having been stable for a long period. Inequality also spiked during 2003–5, and although there are several possible reasons for this spike, the increase in domestic rice prices may have reduced the real expenditure of the poor.
Endogenous drivers of expenditure inequality in Indonesia include changes
in the labour market and in iscal policy. Yusuf et al. (2013) argue that changes in
the formal labour market, including interrelated changes in labour market regu-lation—an increase in severance payments, the strengthening of labour unions, rising minimum wages, reduced demand for unskilled labour, and greater infor-mality in low-wage employment—have increased inequality. Growth of formal employment was rather stagnant in the last decade, owing to slow growth in the manufacturing sector. Before the 1997–98 crisis, the manufacturing sector was the primary source of Indonesia’s economic growth. During 1990–96, for exam-ple, the sector’s GDP growth was 11.2% (while average economic growth was
6. This resonates with Piketty (2014), and the argument that it is inequality of asset and wealth ownership that has driven increasing withcountry income and expenditure in-equality around theworld. This may also have been the case in Indonesia. Leigh and Van
der Eng (2009, 197–98) briely discuss the distribution of wealth in Indonesia. Davies et al.
(2009) offer the only estimate of wealth distribution in Indonesia (which is based on the
1997 Indonesia Family Life Survey).
7. The price changes of estate crops still affect positively low income households because many of those households include members who are employed as plantation workers.
252 Arief Anshory Yusuf, Andy Sumner, and Irlan Adiyatma Rum
7.9%) and its employment growth was 6.0% (while average national employment growth was only 2.3%). Almost a decade after the crisis, employment growth in the manufacturing sector seems to have halted. While its growth for the period 2000–2008 was almost the same as the national average (4.7%), its employment growth was only 0.9%. The formal manufacturing sector has historically been a haven for people in rural areas looking for better-paying jobs. When such oppor-tunities are limited, there is an excess of unskilled labour in rural areas (prior to
the Lewis turning point). As the rural labour market is more lexible, overall rural real wages will be pushed down, increasing inequality in rural areas. The oficial
data from BPS suggests that real wages for agricultural workers have been declin-ing for the past few years, possibly indicatdeclin-ing that people are constrained from migrating to cities in search of formal employment (Manning and Pratomo 2013).
Large transfers, notably rice and fuel subsidies, are other endogenous drivers worthy of exploration. Since the 1997–98 crisis, increasingly large fuel subsidies
have curtailed the iscal space for additional government social spending. Since
2000, they have been 10% to 25% of central government spending (Howes and
Davies 2014, igure 4). It is well known that the impact of the fuel subsidies on incomes has been strongly regressive; they beneit the rich disproportionally more than the poor (Agustina, Fengler, and Schulze 2012). The government increased retail fuel prices several times, in 2005, 2008 and 2013, but over time inlation eroded the price hikes (Howes and Davies 2014, igure 5). To mitigate the impact
of the price hikes, the government distributed cash transfers to the poor and
near-poor. For example, the 2005 policy package most likely contributed to the decline in the Gini coeficient from 2005 to 2006 (Yusuf and Resosudarmo 2008). But,
partly due to rising international oil prices, the fuel subsidy has remained very large and it is likely that its regressive effect has sustained and increased inequal-ity since 2003. There are of course other factors one could note that may well have
played a role in changes in inequality (not least iscal decentralisation and/or the
creation of more districts), but we have included here only those for which we currently have some empirical basis.
CONCLUSION
We have analysed the evolution of expenditure inequality in Indonesia between
1993 and 2013 in order to discuss the signiicance of the recent rise in expendi
-ture inequality. More speciically, we have asked whether inequality in Indonesia
increased over the period across a range of inequality measures—and, if it did, how rapidly—and the extent to which regional, provincial, and urban and rural differences shaped the overall pattern and the extent to which these components drove the overall trend.
Our consistent estimates suggest that inequality in Indonesia has been rising
signiicantly. However, the rise in inequality is predominantly visible in the period
after the 1997–98 crisis, or the reformasi era of political reform and democratisa-tion. Before the crisis, inequality was relatively stable and moderate (if not declin-ing slightly). The magnitude of the more recent rises in inequality is startldeclin-ing.
Furthermore, rising inequality is more or less common across regional dimen -sions, urban and rural areas, and Java and non-Java regions.
We think that BPS’s estimates of inequality before 2009 underestimated in equality, owing to the use of grouped data; the rise in inequality reported since
Twenty Years of Expenditure Inequality in Indonesia, 1993–2013 253
2009 therefore has a longer history. Indonesia is experiencing both divergence and
convergence at the same time; the magnitude of the rise in inequality is signiicant
yet the change in inequality has been greatest in provinces or districts with low initial levels of inequality. We propose a set of hypotheses, not necessarily mutu-ally exclusive, that may play an important role in explaining rising inequality in Indonesia. We present these hypotheses, based on initial empirical work, for
future exploration. The recent commodity boom may inluence urban and rural
inequality, but this is not clear. Rigidity in the formal labour market may be
sig-niicant, and the evidence for this is clearer. It is likely that rice prices and cash
transfer programs have contributed to changes in inequality because of their rela-tive impacts on the living standards of the poorer groups of the population versus their impacts on those of better-off groups, all of which suggests that a better understanding of the drivers of changes in inequality in Indonesia is essential to helping public policy better address rising inequality in Indonesia.
REFERENCES
Akita, Takahiro. 2002. ‘Regional Income Inequality in Indonesia and the Initial Impact of
the Economic Crisis’. Bulletin of Indonesian Economic Studies 38 (2): 201–22.
Akita, Takahiro, and Sachiko Miyata. 2008. ‘Urbanization, Educational Expansion, and Expenditure Inequality in Indonesia in 1996, 1999, and 2002’. Journal of the Asia Paciic Economy 13(2): 147–67.
Akita, Takahiro, Puji Agus Kurniawan, and Sachiko Miyata. 2011. ‘Structural Changes and
Regional Income Inequality in Indonesia: A Bidimensional Decomposition Analysis’. Asian Economic Journal 25 (1): 55–77.
Agustina, Cut Dian R.D., Wolfgang Fengler, and Günther G. Schulze. 2012. ‘The Regional
Effects of Indonesia’s Oil and Gas policy: Options for Reform’. Bulletin of Indonesian Economic Studies 48 (3): 369–97.
Burke, Paul J., and Budy P. Resosudarmo. 2014. ‘Survey of Recent Developments’. Bulletin of Indonesian Economic Studies 48 (3): 299–324.
Cornwell, Katy, and Titik Anas. 2013. ‘Survey of Recent Developments’. Bulletin of Indone-sian Economic Studies 49 (1): 7–33.
Davies, James B., Susanna Sandstrom, Anthony Shorrocks, and Edward Wolff. 2009. ‘The Global Pattern of Household Wealth’. Journal of International Development 21: 1111–24.
Frankema, Ewout, and Daan Marks. 2009. ‘Was It Really “Growth with Equity” under
Soeharto? A Theil Analysis of Indonesian Income Inequality, 1961–2002’. Economics and Finance in Indonesia 57 (1): 47–76.
Haughton, Jonathan, and Shahidur R. Khandker. 2009. Handbook on Poverty and Inequality. Washington, DC: World Bank.
Hill, Hal. 2008. ‘Globalization, Inequality, and Local-Level Dynamics: Indonesia and the Philippines. Asian Economic Policy Review 3 (1): 42–61.
Hill, Hal, Budy P. Resosudarmo, and Yogi Vidyattama. 2008. ‘Indonesia’s Changing Eco -nomic Geography’. Bulletin of Indonesian Economic Studies 44 (3): 407–35.
Howes, Stephen, and Robin Davies. 2014. ‘Survey of Recent Developments’. Bulletin of Indonesian Economic Studies 50 (2): 157–83.
Leigh, Andrew, and Pierre van der Eng. 2009. ‘Inequality in Indonesia: What Can We Learn
from Top Incomes?’. Journal of Public Economics 93 (1–2): 209–12.
Manning, Chris, and Devanto S. Pratomo. 2013. ‘Do Migrants Get Stuck in the Informal Sector? Findings from a Household Survey in Four Indonesian Cities’. Bulletin of Indo-nesian Economic Studies 49 (2): 167–92.
Nugraha, Kunta, and Phil Lewis. 2013. ‘Towards a Better Measure of Income Inequality in Indonesia’. Bulletin of Indonesian Economic Studies 49 (1): 103–12.
254 Arief Anshory Yusuf, Andy Sumner, and Irlan Adiyatma Rum
Piketty, Thomas. 2014. Capital in the Twenty-First Century, translated by Arthur
Goldham-mer. Cambridge, MA: Harvard University Press.
Ravallion, Martin, and Shaohua Chen. 2003. ‘Measuring Pro-poor Growth’. In Economics Letters 78 (1): 93–99.
Sakamoto, Hiroshi. 2007. ‘The Dynamics of Inter-Provincial Income Distribution in
Indo-nesia’. ICSEAD Working Paper 2007-25. Kitakyushu: The International Centre for the
Study of East Asian Development.
Skouias, Emmanuel. 2001. ‘Changes in Regional Inequality and Social Welfare in Indone -sia from 1996 to 1999’. Journal of International Development 13 (1): 73–91.
Sumner, Andy, and Peter Edward. 2014. ‘Assessing Poverty Trends in Indonesia by Inter-national Poverty Lines’. Bulletin of Indonesian Economic Studies 50 (2): 207–25
Suryadarma, Daniel, Rima Prama Artha, Asep Suryahadi, and Sudarno Sumarto. 2005. ‘A Reassessment of Inequality and Its Role in Poverty Reduction in Indonesia’. SMERU Research Institute Working Paper. Jakarta: SMERU Research Institute.
Suryadarma, Daniel, Wenefrida Widyanti, Asep Suryahadi, and Sudarno Sumarto. 2006.
‘From Access to Income: Regional and Ethnic Inequality in Indonesia’. SMERU Research
Institute Working Paper. Jakarta: SMERU Research Institute.
Suryahadi, Asep, Gracia Hadiwidjaja, and Sudarno Sumarto. 2012. ‘Economic Growth and
Poverty Reduction in Indonesia before and after the Asian Financial Crisis’. Bulletin of Indonesian Economic Studies 48 (2): 209–27.
UNDP (United Nations Development Programme). 2014. Humanity Divided: Confronting Inequality in Developing Countries. New York: UNDP.
Van der Eng, Pierre. 2009. ‘Growth and Inequality: The Case of Indonesia, 1960–1997’.
MPRA Paper 12725. Munich: Munich Personal RePEc Archive.
Van Leeuwen, Bas, and Peter Foldvari. 2012. ‘The Development of Inequality and Poverty in Indonesia, 1932–1999. CGEH Working Paper 26. Utrecht: Center for Global Economic
History, Utrecht University.
Yusuf, Arief A., Ahmad Komarulzaman, M. Purnagunawan and Budy P. Resosudarmo. 2013. ‘Growth, Poverty, and Labor Market Rigidity in Indonesia: A General Equilib-rium Investigation’. Working Paper in Economics and Development Studies 201304. Bandung: Department of Economics, Padjadjaran University.
Yusuf, Arief Anshory, and Budy P. Resosudarmo. 2008. ‘Mitigating Distributional Impact
of Fuel Pricing Reform: The Indonesian Experience. ASEAN Economic Bulletin 25 (1): 32–47.