Full Terms & Conditions of access and use can be found at
http://www.tandfonline.com/action/journalInformation?journalCode=cbie20
Download by: [Universitas Maritim Raja Ali Haji] Date: 17 January 2016, At: 23:18
Bulletin of Indonesian Economic Studies
ISSN: 0007-4918 (Print) 1472-7234 (Online) Journal homepage: http://www.tandfonline.com/loi/cbie20
Market-Channel Choices of Indonesian Potato
Farmers: A Best–Worst Scaling Experiment
Wendy J. Umberger, Thomas Reardon, Randy Stringer & Simone Mueller
Loose
To cite this article: Wendy J. Umberger, Thomas Reardon, Randy Stringer & Simone
Mueller Loose (2015) Market-Channel Choices of Indonesian Potato Farmers: A Best–Worst Scaling Experiment, Bulletin of Indonesian Economic Studies, 51:3, 461-477, DOI:
10.1080/00074918.2015.1108389
To link to this article: http://dx.doi.org/10.1080/00074918.2015.1108389
Published online: 29 Nov 2015.
Submit your article to this journal
Article views: 72
View related articles
ISSN 0007-4918 print/ISSN 1472-7234 online/15/000461-17 © 2015 Indonesia Project ANU http://dx.doi.org/10.1080/00074918.2015.1108389
* We wish to thank Nick Minot, from the International Food Policy Research Institute, and David Shearer, from the Australian Centre for International Agricultural Research, for their helpful comments and suggestions during our research. We acknowledge and thank our research partner, the International Potato Center, as well as Eka Puspitawati and Wahida for survey and research assistance. This article was made possible by inancial support from the Australian Centre for International Agricultural Research. All views, interpreta-tions, and conclusions expressed are those of the authors and not necessarily those of the supporting or cooperating institutions.
MARKET-CHANNEL CHOICES OF INDONESIAN POTATO
FARMERS: A BEST–WORST SCALING EXPERIMENT
Wendy J. Umberger* Thomas Reardon*
University of Adelaide Michigan State University; University of Adelaide
Randy Stringer* Simone Mueller Loose*
University of Adelaide Geisenheim University; University of South Australia
We present an empirical analysis of how buyer (and trader) attributes inluence decisions of market participation and channel choice among smallholder potato farmers in West Java, Indonesia. We use a best–worst scaling experiment to evaluate the determinants of these decisions and gauge the inluence of buyer attributes. Our latent-class cluster analysis reveals that producers have heterogeneous preferences for buyer attributes, which address classic smallholder constraints such as access to inputs, credit, and information. This heterogeneity can be somewhat explained by household characteristics and assets. The broad mass of our sample sought buyers whose attributes imply lower market risk for farmers. Yet roughly a quarter of our sample, a portion that included farmers with large, specialised farms, sought buy-ers who could provide inputs such as high-quality seeds.
Keywords: best–worst scaling, latent-class cluster analysis, marketing channel, smallholders JEL classiication: O13, Q12, Q13
INTRODUCTION
Food markets in Indonesia are increasingly complex, with a widening array of
market channels. As in other Southeast Asian economies, the demand-side inlu -ences of income, urbanisation, and demographics are reshaping food value chains (Pingali 2007; Reardon et al. 2003; Reardon and Timmer 2014). As food value chains evolve, expand, and reorganise, smallholders face a greater number of choices and more daunting decisions about which crops to produce, how to produce, and to whom to sell.
In a broad sense, the existing literature on the transformation of modern food value chains addresses how market liberalisation, trade and foreign-investment policies, rapid income growth, and urbanisation affect food producers, buy-ers and tradbuy-ers (inside and outside wholesale markets), processors, and retail-ers—both modern and traditional. Previous research has explored the impacts of change on poverty incidence and net-income distribution, and on the
produc-tion eficiency of smallholder participaproduc-tion in modern food chains (Reardon et al.
2009). A research question that remains unanswered, and on which this article focuses, is whether smallholder farmers are choosing not to participate in modern value chains or whether they are merely being excluded from them. If smallhold-ers are indeed choosing not to participate, what are the consequences for income improvement and thus, indirectly, rural economic development?
This article builds on several strands of literature on market participation.
The irst focuses on the relation between transaction costs and commercialisa -tion decisions—how, when, and why smallholders market their produce. This strand explores why smallholders either sell or do not sell their produce, and assumes that transaction costs are determined exogenously. It focuses on the pos-sibility that imperfect, underdeveloped, or absent markets push transaction costs so high that smallholders are unable to participate as buyers or sellers (Benjamin 1992; Henning and Henningsen 2007; De Janvry, Fafchamps, and Sadoulet 1991; Finkelshtain and Chalfant 1991; Fafchamps 1992; Kranton 1996; Lopez 1986). Goetz (1992) and Key, Sadoulet, and De Janvry (2000), for example, highlight how distance to market and poor infrastructure keep producers from selling.
The second strand identiies ways in which producers innovate to reduce or
avoid transaction costs associated with searching for and screening trading part-ners, learning about new technologies, acquiring credit, meeting product
stand-ards, and bargaining. Poole (2000) analysed factors affecting producers’ marketing
decisions in the Spanish citrus industry, exploring how contracts facilitate
pro-ducers’ marketing choices, reduce uncertainty, or lower other related transac -tion costs. Henson, Masakure, and Boselie (2005) showed how smallholders in Zimbabwe enter market contracts for vegetables because, inter alia, the contracts alleviate uncertainties associated with input supply, market demand, and market prices, and help farmers get extensions from vegetable companies in situations where there are limited public extension services.
The third strand explores the market-channel choices of farmers who once sold only to traditional markets but are now able to sell to new market channels such as
supermarkets, large processors, or their dedicated agents. Examples include the articles by Rao and Qaim (2011) and Hernandez, Reardon, and Berdegué (2007).
This strand tends to model the context and assets of the suppliers as determinants of their selling to one market channel rather than another. It does not model the attributes of the buyers as we do here.
This article ills a gap in and complements the literature by examining how buyer attributes related to transaction costs and market risk inluence the
market-channel participation decisions of smallholder potato producers in West Java. We posit that these farmers use buyer attributes to overcome cost barriers to market participation. The attributes that we consider in this article address classic small-holder constraints, including access to inputs, credit, and information. Prior stud-ies have not examined these buyer attributes collectively.
We use a best–worst (BW) scaling experiment (Finn and Louviere 1992) to understand the relative importance of different buyer attributes to potato produc-ers choosing market channels. BW scaling allows for discrimination in the impor-tance of each attribute and avoids potential differences related to how respondents use rating scales. Combining BW scaling with a latent class (LC) cluster analysis allows us to explore how the assets and individual, heterogeneous preferences of
producers inluence their choice of whom to sell to and how much to sell. As far as we are aware, this is the irst study that uses BW scaling to explore producer
utilities for buyer attributes.
Indonesian Potato Marketing Systems
We focus on potato producers for several reasons. Potatoes are widely produced
by smallholders in West Java, and are one of the top ive vegetables produced
in the country (in terms of acreage, value, and volume). They are also a priority crop in government horticultural research and in declared strategies of horticul-tural development. Potato markets are evolving; demand for table potatoes, for example, is moving away from those sold through wholesale markets and tradi-tional retailers, and towards those sold through supermarkets and restaurants. Specialised potato wholesalers dedicated to supermarkets and restaurants have arisen beside traditional traders, and potato agribusinesses-cum-traders have entered the market as producers and wholesalers (Campilan and Asmunati 2007; World Bank 2007; Puspitawati et al. 2013).
Most potatoes marketed in West Java are produced by smallholders and sold into traditional supply chains. Smallholder potato farmers marketing through traditional supply chains rely on traders, central wholesale markets, and wet markets. Smallholder farmers are connected to the main marketing participants
through numerous intermediaries. This long chain hinders farmers’ abilities to
establish relationships with other supply-chain partners on the basis of open communication, a high degree of trust, and a better understanding of consumer needs.
Other, non-traditional supply chains also exist in Indonesia, including special -ised wholesalers distributing to supermarkets, large-scale agribusiness companies engaging in potato processing through contract arrangements with individual farmers, and home-based enterprises producing potato-based snack foods. These
chains can increase or stabilise producers’ incomes by offering greater market
opportunities than traditional channels, including credit; price premiums for higher-quality products; improved access to certain inputs (such as seed); and
technology, training, and technical advice (Hernández, Reardon, and Berdegué
2007; Neven et al. 2009; Morrison Paul, Nehring, and Banker 2004).
The existing literature on potato value chains in West Java, together with the
ieldwork for this study, suggests that the ability of Indonesian potato farmers
to participate in non-traditional channels is limited owing to many challenges. Long and disjointed supply chains, a lack of available and timely market-related
information, weak farmers’ organisations, and the limited marketing capacity
and generally poor market orientation of smallholders all contribute to a mis-match between what is produced and the variety, quality, and quantity required by retailers and processors (Ameriana 2010; Campilan and Asmunati 2007; Fuglie et al. 2006; World Bank 2007; Puspitawati et al. 2013).
The different types of buyers and supply chains present producers with a range
of market channels, each with its own buyer attributes. The demand for speciic attributes varies by producer, but certain attributes may reduce risk, lower speciic transaction costs, offer market incentives, or loosen household inancial constraints.
Some buyers, for example, pay cash immediately, at the point of sale, while others
offer premium prices for graded and sorted produce. Other buyers provide input credits, certiied seeds, technical guidance for adopting new technologies, or infor -mation on how to meet the standards preferred by supermarkets and processors. Some buyers are recognised for their integrity, reliability, and consistency.
RESEARCH METHODOLOGY AND ANALYSIS Sampling Methods
We analysed data from 307 household survey questionnaires collected in 2009 in Bandung and Garut, two regencies in West Java that together account for nearly
all of the province’s potato production. The sample included potato producers
from three groups: the general potato population; producers supplying Indofood,
one of Indonesia’s largest food processors; and growers participating in a farmer ield school (FFS), a program of practical education.
Our sample of the general potato population (64% of the total sample) com -prised 197 households, or an average of 12 randomly chosen potato-producing households from each of 16 villages. We selected these villages by stratifying regency subdistricts (kecamatan) into major and minor potato-production areas on
the basis of oficial published production data and interviews with key informants.
We then randomly selected two subdistricts from each of these areas, resulting in eight subdistricts, and we conducted site visits and more interviews in order to develop a list of potato-producing villages in each subdistrict. We obtained names and contact information for potato producers in each village from land-registry
and tax-ofice iles.
The Indofood sample (20% of the total) included 60 households drawn ran-domly from a list of more than 400 producers provided by Indofood. We ranran-domly selected 50 FFS producers (16% of the total sample) from lists of more than 200
households provided by extension oficers from two government departments—
Balitsa (Research Institute for Vegetable Crops) and Dinas Pertanian (Agricultural
Extension Ofice). This particular FFS introduced participants to new varieties of
potatoes and new farming techniques (Puspitawati et al. 2013).
The questionnaires collected information on household characteristics, assets, potato production and marketing history, other sources of income, contractual details, and perceptions of changes over time. Information was also collected on producer preferences for buyer attributes by using a BW-scaling experiment (tables 1a and 1b), as explained in the following section. To examine if producer
preferences are gender-speciic, we invited female and male respondents in each
household to participate in the experiment.
Best–Worst Scaling
BW scaling measures the relative value or importance that individuals place on
attributes. Based on Finn and Louviere’s (1992) random utility theory for paired
comparisons, it uses a balanced incomplete block design to derive subsets of the
attributes being assessed. Respondents choose both the best (most important) and worst (least important) attributes, making trade-offs among subsets and giving the researcher more discriminating estimates of relative importance. BW scaling
is relatively easy for respondents to perform; it also allows eficient elicitation of
attribute importance, particularly when comparing many attributes (see Auger,
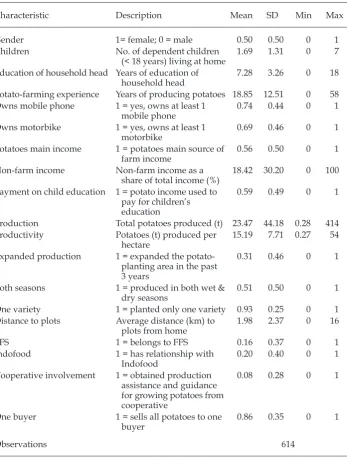
TABLE 1a Summary of Respondent Characteristics Used
as Active Covariates in Latent Class Analysis
Characteristic Description Mean SD Min Max
Gender 1= female; 0 = male 0.50 0.50 0 1
Children No. of dependent children (< 18 years) living at home
1.69 1.31 0 7
Education of household head Years of education of household head
7.28 3.26 0 18
Potato-farming experience Years of producing potatoes 18.85 12.51 0 58 Owns mobile phone 1 = yes, owns at least 1
Potatoes main income 1 = potatoes main source of farm income
0.56 0.50 0 1
Non-farm income Non-farm income as a share of total income (%)
18.42 30.20 0 100
Payment on child education 1 = potato income used to pay for children’s education
0.59 0.49 0 1
Production Total potatoes produced (t) 23.47 44.18 0.28 414 Productivity Potatoes (t) produced per
hectare
15.19 7.71 0.27 54
Expanded production 1 = expanded the potato- planting area in the past
One variety 1 = planted only one variety 0.93 0.25 0 1 Distance to plots Average distance (km) to
plots from home
Cooperative involvement 1 = obtained production assistance and guidance
Note: SD = standard deviation. FFS = farmer ield school.
Devinney, and Louviere 2007; Cohen 2009; Cohen and Orme 2004; Jaeger et al.
2008; Mueller and Rungie 2009; and Mueller, Lockshin, and Louviere 2010). We conducted in-depth interviews and focus groups with producers and buy-ers to ensure that our selected buyer attributes covered characteristics of
impor-tance to producers. The inal 11 attributes were as follows: improved access to inputs (‘access to certiied potato seed’, ‘credit or access for input purchases’, and ‘provides money for loan’); access to information (‘technical assistance’ and ‘shares information about market conditions’); market and price risk (‘pays cash immediately’, ‘established relationship’, and ‘always follows through on commit
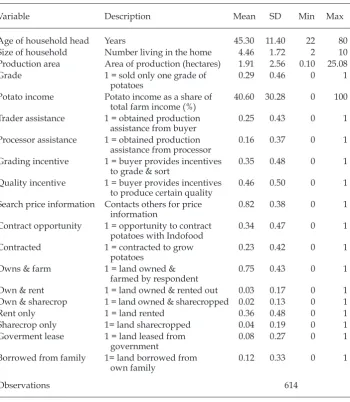
-ments to buy my products’); negotiation aspects (‘willing to negotiate or match TABLE 1b Summary of Respondent Characteristics Used
as ‘Passive’ Variables in Ex-post Characterisation
Variable Description Mean SD Min Max
Age of household head Years 45.30 11.40 22 80
Size of household Number living in the home 4.46 1.72 2 10 Production area Area of production (hectares) 1.91 2.56 0.10 25.08 Grade 1 = sold only one grade of
potatoes
0.29 0.46 0 1
Potato income Potato income as a share of total farm income (%)
40.60 30.28 0 100
Trader assistance 1 = obtained production assistance from buyer
0.25 0.43 0 1
Processor assistance 1 = obtained production assistance from processor
0.16 0.37 0 1
Grading incentive 1 = buyer provides incentives to grade & sort
0.35 0.48 0 1
Quality incentive 1 = buyer provides incentives to produce certain quality
0.46 0.50 0 1
Search price information Contacts others for price information
0.82 0.38 0 1
Contract opportunity 1 = opportunity to contract potatoes with Indofood
0.34 0.47 0 1
Contracted 1 = contracted to grow potatoes Own & sharecrop 1 = land owned & sharecropped 0.02 0.13 0 1
Rent only 1 = land rented 0.36 0.48 0 1
Sharecrop only 1= land sharecropped 0.04 0.19 0 1
Goverment lease 1 = land leased from government
0.08 0.27 0 1
Borrowed from family 1= land borrowed from own family
0.12 0.33 0 1
Observations 614
Note: SD = standard deviation.
another buyer’s price’); and economic attributes (‘provides price premiums’ and ‘price per kilogram’).
We used a balanced incomplete block design to assign attributes to 11 subsets
(tasks) with ive attributes each. For each task, respondents were asked to con -sider which attribute was the most important to them and which was the least important.1 Back translation conirmed that the meaning of the attributes had
been preserved after translation into Bahasa Indonesia.
Aggregate Analysis
To determine the relative importance of buyer attributes for all producers, we cal-culated an aggregate BW score for each attribute by summing the number of times each attribute was selected as being most important or least important. We
sub-tracted the aggregate ‘least important’ value from the aggregate ‘most important’
value. The 11 aggregate BW scores are crude measures of relative importance. To make these results easier to interpret, we calculated a standardised interval scale (SIS) (Marley and Louviere 2005; Mueller and Rungie 2009), taking the square root of the frequency of the best, or most important, attribute, divided by the frequency of worst, or least important, attribute: SQRT(B/W). We gave the attribute with the highest SQRT(B/W) a score of 100 and scaled all other attributes accordingly.
Modelling Heterogeneity
To explore heterogeneity among producers, we calculated the relative importance of each of the 11 attributes by summing the number of times a respondent, i, indi-cated that an attribute, j (j = 1–11), was most important or least important. We
then subtracted the sum of ‘least important’ for attribute j from the sum of ‘most
important’ for attribute j, to calculate BWij. The larger the BWij score, the more important the attribute to respondent i.
We used an LC cluster analysis to determine if unique classes of producers exist that can be grouped by household, farm, and marketing characteristics. This clus-tering technique is useful for explaining unobserved differences in preferences or utilities (Meghani et al. 2009). LC cluster analysis assumes that individuals belong to one of k LCs, of which the size and number are unknown a priori (Vermunt and Magidson 2008; Haughton, Legrand, and Woolford 2009).
LC analysis uses the covariation among observed preference scores (BWij) as
a measure of utility to predict membership in a speciic LC. Observed preference
scores for individuals in a class are assumed to have come from the same prob-ability distribution. Unobserved utility is heterogeneous across classes but homo-geneous within a class. Therefore, although we cannot directly observe a potato
producer’s utility for a marketing channel, we can measure the importance of
buyer attributes to producers by using BW scaling. The 11 individual BW scores (BWij) for the attributes were the dependent variables in the LC cluster analysis. If producers are heterogeneous in their ratings of buyer attributes then unique LC clusters or segments should exist (see, for example, Haughton, Legrand, and Woolford 2009; Meghani et al. 2009; and Mueller and Rungie 2009).
1. An example of one of the 11 BW tasks and descriptions of the inal 11 attributes are avail-able from the authors on request.
LC cluster analysis can use active covariates to further explain classes and
improve the classiication by controlling for other variables that may also help to
explain market-channel choice (Haughton, Legrand, and Woolford 2009). These covariates are selected on the basis of previous empirical studies exploring factors that explain market participation, market-channel choice, or contract adoption (Wollni and Zeller 2007; Fafchamps and Hill 2005; Shilpi and Umali-Deininger 2007; Abdulai and Birachi 2009).
We characterised the resulting clusters from the LC analysis ex post, using passive variables (table 1b). These variables will be useful for further explorative analysis. We can evaluate, for example, whether respondents indicated attribute importance is consistent with their marketing behaviour, their relationships with buyers, or both (by comparing the BWij scores with passive variables such as
‘trader assistance’, ‘processor assistance’, and ‘contracted’).
RESULTS AND CHARACTERISATION OF CLUSTERS Aggregate Importance of Buyer Attributes
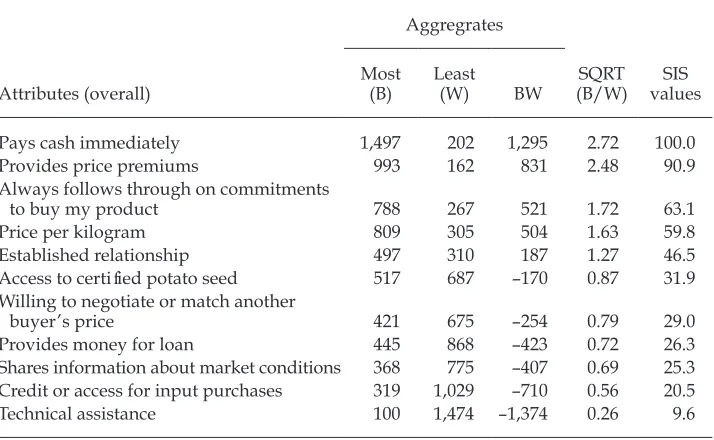
We determined the relative importance of each buyer attribute to the entire sample by evaluating the SIS values of each attribute (table 2). The attribute ‘pays cash
immediately’ was the most important (standardised to 100%), across all respond
-ents, while ‘technical assistance’ was the least important (about 10% as important). ‘Provides price premiums’ was very important. ‘Always follows through on com
-mitments to buy’ was 63% as important to respondents as ‘pays cash immediately’. Providing access to certiied potato seed was 32% as important as paying cash imme
-diately, while the attributes ‘provides money for loan’, ‘credit or access for input purchases’, and ‘technical assistance’ were less important than other attributes.
TABLE 2 Measures of Attribute Importance Using Best–Worst Scaling
Attributes (overall)
Aggregrates
SQRT (B/W)
SIS values Most
(B)
Least
(W) BW
Pays cash immediately 1,497 202 1,295 2.72 100.0
Provides price premiums 993 162 831 2.48 90.9
Always follows through on commitments
to buy my product 788 267 521 1.72 63.1
Price per kilogram 809 305 504 1.63 59.8
Established relationship 497 310 187 1.27 46.5
Access to certiied potato seed 517 687 –170 0.87 31.9 Willing to negotiate or match another
buyer’s price 421 675 –254 0.79 29.0
Provides money for loan 445 868 –423 0.72 26.3
Shares information about market conditions 368 775 –407 0.69 25.3 Credit or access for input purchases 319 1,029 –710 0.56 20.5
Technical assistance 100 1,474 –1,374 0.26 9.6
Note: B = best. W = worst. SQRT = square root. SIS = standardised interval scale.
In the key informant interviews we conducted during the development phase of the study, farmers, traders, and government extension specialists (particularly those involved with Indofood) indicated that farmers struggle to gain access to
potato seed, other inputs, credit, and technical assistance. Our study results, how -ever, suggest that these attributes are less important for most potato producers
than the four attributes related to guaranteed inancial returns (‘pays cash imme
-diately’, ‘always follows through on commitments to buy my product’, ‘provides price premium’, and ‘price per kilogram’). This result is not surprising, consider -ing that 56% of respondents relied on potatoes as their main source of farm income (table 1a). The results in table 2 suggest that long-term buyer–seller relationships are more likely to develop if potato buyers guarantee producers that they will pay cash upon receipt of potatoes and follow through on any commitments to buy more potatoes—that is, if they play a role in reducing market and price risk.
Producer Heterogeneity
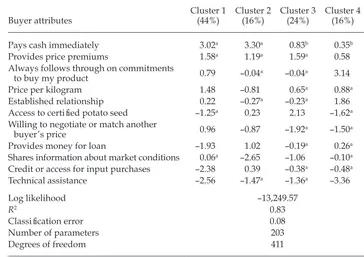
Our LC cluster analysis revealed four distinct clusters of potato producers, each
with different demographic characteristics, attitudes, and preferences (tables 3–5). The mean BW scores and the SIS values for each attribute and each LC cluster are provided in tables 3a and 3b. As expected, the relative importance of buyer attrib-utes differed across clusters.
Statistically signiicant active covariates in the LC analysis include the number
of dependent children living at home, the number of years of education of the
TABLE 3a Mean Best–Worst Scores for Buyer Attributes, by Latent Class Cluster
Buyer attributes
Pays cash immediately 3.02a 3.30a 0.83b 0.35b
Provides price premiums 1.58a 1.19a 1.59a 0.58
Always follows through on commitments
to buy my product 0.79 –0.04a –0.04a 3.14
Price per kilogram 1.48 –0.81 0.65a 0.88a
Established relationship 0.22 –0.27a –0.23a 1.86
Access to certiied potato seed –1.25a 0.23 2.13 –1.62a
Willing to negotiate or match another
buyer’s price 0.96 –0.87 –1.92a –1.50a
Provides money for loan –1.93 1.02 –0.19a 0.26a
Shares information about market conditions 0.06a –2.65 –1.06 –0.10a
Credit or access for input purchases –2.38 0.39 –0.38a –0.48a
Technical assistance –2.56 –1.47a –1.36a –3.36
Log likelihood –13,249.57
R2 0.83
Classiication error 0.08
Number of parameters 203
Degrees of freedom 411
Note: Means with the same superscript letters in the same row are not statistically different (α = 0.05, post-hoc Tukey test).
TABLE 3b Standardised-Interval-Scale Values and Ranks for Buyer Attributes, by Latent Class Cluster
Cluster characterisation
Cluster 1 (44%): Financial returns
Cluster 2 (16%): Cash & credit access
Cluster 3 (24%): Input access
Cluster 4 (16%): Commitment & relationship
Buyer attributes
SIS value
SIS rank
SIS value
SIS rank
SIS value
SIS rank
SIS value
SIS rank
Pays cash immediately 100.0 1 100.0 1 40.0 4 13.3 6
Provides price premiums 58.7 2 38.7 2 59.7 2 20.1 4
Always follows throughon their commitments to
buy my product 36.4 5 17.1 6 25.3 5 100.0 1
Price per kilogram 51.3 3 10.0 8 40.7 3 23.9 3
Established relationship 23.8 6 14.1 7 22.1 8 54.8 2
Access to certiied potatoseed 8.5 8 20.5 5 100.0 1 3.6 10
Willing to negotiate ormatch another buyer’sprice 41.5 4 9.7 9 8.3 11 4.0 9
Provides money for loan 6.5 9 31.6 3 24.5 6 13.7 5
Shares information aboutmarket conditions 19.6 7 3.6 11 15.5 9 11.1 7
Credit or access for inputpurchases 3.1 10 21.6 4 23.0 7 8.7 8
Technical assistance 3.1 11 7.4 10 12.2 10 0.8 11
TABLE 4 Signiicant Covariates and Top Standardised-Interval-Scale Characteristics for Latent Class Clusters
Covariates
Cluster 1: Pays cash immediately
Cluster 2: Pays cash immediately
Cluster 3: Has access to
certiied seed
Cluster 4: Meets
commitments Wald p-value
Gender (1 = female) 0.50 0.56 0.47 0.48 2.41 0.49
Children 1.59 2.16 1.34 2.00 19.50 0.00
Education of household head 7.38 6.31 8.13 6.75 20.41 0.00
Potato-farming experience 19.01 14.85 21.98 17.81 18.53 0.00
Owns mobile phone 0.71 0.66 0.85 0.72 4.20 0.24
Owns motorbike 0.70 0.55 0.74 0.71 7.99 0.05
Potatoes main income 0.55 0.40 0.68 0.59 3.80 0.28
Non-farm income 20.68 13.84 15.80 20.55 5.73 0.13
Payment on child education 0.58 0.68 0.67 0.44 15.93 0.00
Production 24.44 7.90 31.99 23.79 9.06 0.03
Productivity 14.85 14.38 16.89 14.42 6.05 0.11
Expanded production 0.26 0.28 0.37 0.40 2.19 0.53
Both seasons 0.51 0.21 0.74 0.46 20.61 0.00
One variety 0.91 1.00 0.89 0.99 9.36 0.03
Distance to plots 1.79 1.33 2.50 2.35 16.09 0.00
Farmer ield school 0.14 0.25 0.16 0.13 15.65 0.00
Indofood 0.05 0.05 0.50 0.27 53.68 0.00
Cooperative involvement 0.04 0.09 0.23 0.00 8.71 0.03
household head, the number of years of potato-farming experience, motorbike
ownership, whether potato income pays for children’s education, total produc -tion, planting in both wet and dry seasons, the number of varieties planted, the average distance to potato plots, contracts with Indofood, and participation in FFSs or cooperatives (table 4). Contrary to our expectations, the following
covari-ates were not signiicant in the LC analysis: gender, mobile-phone ownership,
potatoes as the main income source, the percentage of non-farm income, produc-tivity, expanded production, and the existence of only one buyer. Accordingly,
these characteristics are not suficiently related to differences in attribute impor -tance between producers.
We used an ex-post analysis of variance to consider passive variables (that is,
those not used as active covariates in the LC analysis), inding that additional signiicant differences in household, farm, and marketing characteristics existed
across the four clusters (table 5). Farmers in cluster 1, which accounted for the largest share of the sample (44%), had a higher utility than those in other clusters for buyers who would negotiate on price and follow through on commitments to buy their products. These producers were less likely to be engaged in relation-ships, including contracting, with supply-chain partners. They had a lower utility for buyer attributes related to reducing search or information costs through the provision of credit or technical assistance.
Relative to clusters 2 and 3, a higher share of respondents in cluster 1 received incentives for grading and for producing higher-quality potatoes (table 5), while 93% of producers in this cluster said they contacted others to obtain price
infor-mation. Thus, it is not surprising that ‘willingness to negotiate on price’ was
one of the most important attributes; its importance points to a strong degree of consistency between estimated preferences for buyer attributes and marketing behaviour.
The importance placed on price-related attributes, including incentives for grading and quality, by farmers in cluster 1 suggests that they sought market-related incentives to encourage them to coordinate more closely with supply-chain partners. Given the large size of this cluster, additional work is needed to explore what other factors motivated these producers to choose a marketing channel and to understand why more producers in the general potato population are not involved in vertical partnerships.
Cluster 2 (16% of the sample) is somewhat similar to cluster 1 in the importance
placed on certain buyer attributes. ‘Pays cash immediately’ was by far the most
important attribute (table 3b) for cluster 2. Two of the top four attributes for these
farmers suggest that this cluster was the most inancially constrained. Farmers in
this cluster preferred buyers who could help them reduce their search, travel, and negotiation costs for obtaining loans. Farmers in this cluster placed little
impor-tance on attributes related to buyers’ willingness to negotiate on selling prices or
provide technical assistance and market information.
In general, farmers in cluster 2 had less land allocated to potatoes, lower levels of education, less potato-farming experience, lower yields, lower incomes, and fewer assets than farmers in other clusters. This cluster had the highest proportion of farmers participating in FFSs (25%) and the smallest proportions receiving pro-duction assistance from processors (5%) and receiving grading or quality
incen-tives from their buyers (10% and 26%, respectively). Off-farm income accounted
for only 14% of their household income. It is not surprising that buyer attributes
related to cash low, inancing, and input access were more important to this clus -ter than to others.
Farmers in cluster 3 (24% of the sample) valued buyers who provided access
to certiied seed, suggesting that they valued production stability and lower costs for inding and buying quality inputs. Compared with farmers in other clusters,
they had completed more education and had more farming experience, and had the highest potato production and yields. They also travelled farthest to reach their potato plots (2.5 kilometres). This cluster had the largest share of producers involved in contractual agreements with Indofood (50%) or a cooperative (23%).
Cluster 3 represents a relatively large segment of experienced farmers who relied on potatoes as a main income source. Many of these farmers were involved with supply-chain partners (50% with Indofood). The importance that the
farm-ers placed on having access to certiied potato seed might have been why they
were contracting with Indofood and other processors. In other words, their expe-rience in producing potatoes may have taught them that their potato production
and revenue relied on having good-quality, certiied seed, and thus they contract with buyers. This would support Henson, Masakure, and Boselie’s (2005) ind -ing that producers seek contractual relationships with buyers to reduce certain transaction costs related to accessing inputs and technology. Cluster 3 also has the
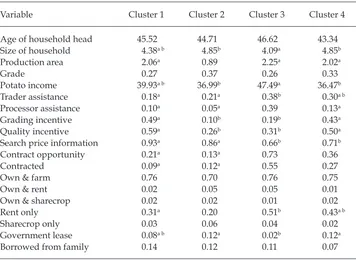
TABLE 5 Means of Respondents’ Household, Farm, and Marketing Characteristics for Latent Class Clusters
Variable Cluster 1 Cluster 2 Cluster 3 Cluster 4
Age of household head 45.52 44.71 46.62 43.34
Size of household 4.38a b 4.85b 4.09a 4.85b
Production area 2.06a 0.89 2.25a 2.02a
Grade 0.27 0.37 0.26 0.33
Potato income 39.93a b 36.99b 47.49a 36.47b
Trader assistance 0.18a 0.21a 0.38b 0.30a b
Processor assistance 0.10a 0.05a 0.39 0.13a
Grading incentive 0.49a 0.10b 0.19b 0.43a
Quality incentive 0.59a 0.26b 0.31b 0.50a
Search price information 0.93a 0.86a 0.66b 0.71b
Contract opportunity 0.21a 0.13a 0.73 0.36
Contracted 0.09a 0.12a 0.55 0.27
Own & farm 0.76 0.70 0.76 0.75
Own & rent 0.02 0.05 0.05 0.01
Own & sharecrop 0.02 0.02 0.01 0.02
Rent only 0.31a 0.20 0.51b 0.43a b
Sharecrop only 0.03 0.06 0.04 0.02
Government lease 0.08a b 0.12a 0.02b 0.12a
Borrowed from family 0.14 0.12 0.11 0.07
Note: Means within a row with the same superscript letters are not statistically different (α = 0.05, post-hoc Tukey test). Means in rows with no superscript are not statistically different across clusters.
highest share (nearly 40%) of producers who obtained production assistance for
growing potatoes from traders or processors, even though ‘technical assistance’
was of little importance to respondents.
Farmers in cluster 4 (16% of the sample) valued the beneits of long-term rela -tionships and placed less value on having access to technical assistance or
certi-ied seed. Farmers in this cluster looked for opportunities to build relationships
with buyers, and it seems that these producers sought price premiums for value-adding (for example, by grading and sorting) when trying to get contracts with buyers who rewarded quality. Several characteristics help to explain why com-mitment and long-term relationships were important to farmers in this cluster. The education level and age of the household head, as well as the share of total farm income from potatoes, were lower than for farmers in other clusters. It is therefore not surprising that all respondents in this cluster each sold all of their potatoes to one buyer or that 27% were in contracts with Indofood. A relatively high share of farmers in this cluster received incentives from buyers for grading (43%) and for producing higher-quality potatoes (50%).
SUMMARY AND IMPLICATIONS
The indings of our BW scaling experiment for the aggregate sample revealed
that the three most important buyer attributes for potato farmers in West Java were immediate cash payments, price premiums for sorting for quality, and buy-ers following through on their commitment to buy potatoes as agreed. This result suggests that long-term buyer–seller relationships will develop only if buyers
are able to offer farmers inancial incentives and consistently follow through on
their commitments. Sellers will otherwise market their products through other channels.
Our joint LC cluster analysis of the respondents’ individual BW values and
selected respondent characteristics (household, socio-demographic, and farm and
social assets) allowed us to explore the heterogeneity of farmers’ utilities for buyer attributes and to better understand farmers’ marketing choices. The indings of
this research support earlier work by the World Bank (2007) and Puspitawati et al. (2013) that suggests potato farmers have unique needs when deciding where to
market their potatoes. Taking into account growers’ attitudes and characteristics, we discovered four distinct and heterogeneous clusters of potato producers. Each
cluster had unique utilities for market-channel attributes.
The largest group of farmers, cluster 1, placed relatively greater value on
attributes related to reduced market and inancial risk, whereas farmers in cluster
3, which included the most experienced farmers, who owned relatively larger,
irrigated farms, tended to be more interested in the buyer’s ability to provide access to certiied seed. Farmers in cluster 3 were therefore more likely to supply
Indofood, which gives farmers access to high-quality potato seed; the domestic seed market appears to fall short of being able to do this. Farmers in cluster 2, on the other hand, placed relatively greater importance on attributes related to the provision of credit for accessing inputs (such as fertiliser or pesticides) or loans to cover other operating expenses or the purchase of capital assets. Farmers in clus-ter 4 placed the highest value on buyers following through on their commitments, including paying on time.
Our clusters are not necessarily representative of the different segments that
may exist in the Indonesian potato-farming population, or of the characteristics of the farmers within them. We purposely sampled farmers who were known to be working with Indofood (20% of the sample), yet it is unlikely that 20% of
potato farmers are selling to Indofood. Our sampling bias may have overinlated,
for example, the size of certain clusters—particularly cluster 3. This bias should be taken into account when considering the following policy implications of this study.
This research demonstrates that reining and targeting smallholder assistance
schemes (including those offered by the public and private sectors as well as
non-government organisations) to account for farmers’ unique needs, preferences,
and characteristics may create more effective programs. In turn, this could lead
to more eficient potato value chains and possibly beneit both buyers and sellers.
The generally high degree of importance placed on market issues related to price
suggests that farmers may beneit from having improved access to general mar -ket information (for example, through mobile-phone applications and improved access to the Internet). Farmers may also be interested in undertaking training programs to improve their understanding of market dynamics and to build capac-ity in skills such as negotiating with buyers and understanding their demands.
Furthermore, some potato farmers—particularly those in cluster 3—are likely to welcome programs and policies that increase supply and access to high-quality
potato seed. There may be some beneit from introducing development initiatives
that encourage both public- and private-sector investment in increasing
small-holders’ access to quality seed, including by increasing the domestic production
of potato seed, or from enacting more liberal trade policies to increase supplies of high-quality imported seeds.
Farmers in clusters 1 and 4 are likely to beneit from targeted agricultural insur -ance schemes, which allow them to better manage production, price, and market
risks, while those in cluster 2 may beneit from programs that increase small
-holder access to affordable inancing options for purchasing inputs and working
capital (such as micro-credit schemes). These programs could allow them to capi-talise on marketing possibilities and emerging market niches.
Recognising, understanding, and accounting for heterogeneity in the attitudes and needs of smallholder farmers with respect to market channels and related capacity building are central to improving the effectiveness of public- and private-sector agricultural development programs and investment schemes. Ultimately,
we hope that consideration of our indings will lead to changes that improve Indonesian smallholder potato farmers’ access to and participation in modern
food market channels.
REFERENCES
Abdulai, Awudu, and Eliud A. Birachi. 2008. ‘Choice of Coordination Mechanism in the Kenyan Fresh Milk Supply Chain’. Applied Economic Perspectives and Policy 31 (1): 103–21. Ameriana, Mieke. 2010. ‘Linking Potato Farmers with Markets in Indonesia through Par-ticipatory Market Chain Approach’. In Strengthening Potato Value Chains: Technical and Policy Options for Developing Countries, 93–101. Rome: Food and Agriculture Organiza-tion of the United NaOrganiza-tions and the Common Fund for Commodities.
Auger, Pat, Timothy M. Devinney, and Jordan J. Louviere. 2007. ‘Using Best–Worst Scaling Methodology to Investigate Consumer Ethical Beliefs across Countries’. Journal of Busi-ness Ethics 70: 299–326.
Benjamin, Dwayne. 1992. ‘Household Composition, Labor Markets, and Labor Demand: Testing for Separation in Agricultural Household Models’. Econometrica 60 (2): 287–322. Campilan, D., and R. Asmunati. 2007. Informal Assessment Report on Vegetable Marketing in
West and Central Java, Indonesia. Bogor: CIP-ESEAP.
Cohen, Eli. 2009. ‘Applying Best–Worst Scaling to Wine Marketing’. International Journal of Wine Business Research 21 (1): 8–23.
Cohen, Steve, and Bryan Orme. 2004. ‘What’s Your Preference?’. Marketing Research 16 (2): 32–37.
De Janvry, Alain, Marcel Fafchamps, and Elisabeth Sadoulet. 1991. ‘Peasant Household Behaviour with Missing Markets: Some Paradoxes Explained’. Economic Journal 101 (409): 1400–17.
Fafchamps, Marcel. 1992. ‘Cash Crop Production, Food Price Volatility, and Rural Market Integration in the Third World’. American Journal of Agricultural Economics 74 (1): 90–99. Fafchamps, Marcel, and Hill, Ruth Vargas. 2005. ‘Selling at the Farmgate or Traveling to
Market’. American Journal of Agricultural Economics 87 (3): 717–34.
Finkelshtain, Israel, and James A. Chalfant. 1991. ‘Marketed Surplus under Risk: Do Peas-ants Agree with Sandmo?’. American Journal of Agricultural Economics 73 (3): 557–67. Finn, Adam, and Jordan J. Louviere. 1992. ‘Determining the Appropriate Response to
Evi-dence of Public Concern: The Case of Food Safety’. Journal of Public Policy and Marketing 11 (2): 12–25.
Fuglie, Keith O., Witono Adiyoga, Rini Asmunati, Sukendra Mahalaya, and Rachman Suherman. 2006. ‘Farm Demand for Quality Potato Seed in Indonesia’. Agricultural Eco -nomics 35 (3): 257–66.
Goetz, Stephan J. 1992. ‘A Selectivity Model of Household Food Marketing Behavior in Sub-Saharan Africa’. American Journal of Agricultural Economics 74 (2): 444–52.
Haughton, Dominique, Pascal Legrand, and Sam Woolford. 2009. ‘Review of Three Latent Class Cluster Analysis Packages: Latent GOLD, poLCA, and MCLUST’. American Stat -istician 63 (1): 81–92.
Henning, Christian H. C. A., and Arne Henningsen. 2007. ‘Modeling Farm Households’ Price Responses in the Presence of Transaction Costs and Heterogeneity in Labor Mar-kets’. American Journal of Agricultural Economics 89 (3): 665–81.
Henson, Spencer, Oliver Masakure, and David Boselie. 2005. ‘Private Food Safety and Quality Standards for Fresh Produce Exporters: The Case of Hortico Agrisystems, Zim-babwe’. Food Policy 30 (4): 371–84.
Hernández, Ricardo, Thomas Reardon, and Julio Berdegué. 2007. ‘Supermarkets, Whole-salers, and Tomato Growers in Guatemala’. Agricultural Economics 36 (3): 281–90. Jaeger, Sara R., Anne S. Jørgensen, Margit D. Aaslyng, and Wender L. P. Bredie. 2008. ‘Best–
Worst Scaling: An Introduction and Initial Comparison with Monadic Rating for Prefer-ence Elicitation with Food Products’. Food Quality and Preference 19 (6): 579–88. Key, Nigel, Elisabeth Sadoulet, and Alain de Janvry. 2000. ‘Transactions Costs and
Agricul-tural Household Supply Response’. American Journal of Agricultural Economics 82 (2): 245–59.
Kranton, Rachel E. 1996. ‘Reciprocal Exchange: A Self-Sustaining System’. American Eco -nomic Review 86 (4): 830–51.
Lopez, Ramon E. 1986. ‘Structural Models of the Farm Household That Allow for Inter-dependent Utility and Proit-Maximization Decisions’. In Agricultural Household Mod -els: Extension, Application and Policy, edited by Inderjit J. Singh, Lyn Squire, and John Strauss, 306–25. Baltimore: Johns Hopkins University Press.
Marley, A. A. J., and J. J. Louviere. 2005. ‘Some Probabilistic Models of Best, Worst, and Best–Worst Choices’. Journal of Mathematical Psychology 49 (6): 464–80.
Meghani, Salimah H., Christopher S. Lee, Alexandra L. Hanlon, and Deborah W. Bruner. 2009. ‘Latent Class Cluster Analysis to Understand Heterogeneity in Prostate Cancer Treatment Utilities’. BMC Medical Informatics and Decision Making 9 (47): 1–8.
Morrison Paul, Catherine J., Richard Nehring, and David Banker. 2004. ‘Productivity, Econ-omies, and Eficiency in US Agriculture: A Look at Contracts’. American Journal of Agri -cultural Economics 86 (5): 1308–14.
Mueller, Simone, Larry Lockshin, and Jordan J. Louviere. 2010. ‘What You See May Not Be What You Get: Asking Consumers What Matters May Not Relect What They Choose’. Marketing Letters 21 (4): 335–50.
Mueller, Simone, and Cam Rungie. 2009. ‘Is There More Information in Best–Worst Choice Data? Using the Attitude Heterogeneity Structure to Identify Consumer Segments’. International Journal of Wine Business Research 21 (1): 24–40.
Neven, David, Michael Makokha Odera, Thomas Reardon, and Honglin Wang. 2009. ‘Ken-yan Supermarkets, Emerging Middle-Class Horticultural Farmers, and Employment Impacts on the Rural Poor’. World Development 37 (11): 1802–11.
Pingali, Prabhu. 2007. ‘Westernization of Asian Diets and the Transformation of Food Sys-tems: Implications for Research and Policy’. Food Policy 32 (3): 281–98.
Poole, Nigel D. 2000. ‘Production and Marketing Strategies of Spanish Citrus Farmers’. Journal of Agricultural Economics 51 (2): 210–23.
Puspitawati, Eka, Amos Gyau, Wendy Umberger, and Randy Stringer. 2013. ‘Determinants of Trust in the Indonesian Potato Industry: A Comparison among Groups of Potato Farmers’. Working paper, International Food Policy Research Institute, Washington, DC.
Rao, Elizaphan J. O., and Matin Qaim. 2011. ‘Supermarkets, Farm Household Income, and Poverty: Insights from Kenya’. World Development 39 (5): 784–96.
Reardon, Thomas, Christopher B. Barrett, Julio A. Berdegué, and Johan F. M. Swinnen. 2009. ‘Agrifood Industry Transformation and Small Farmers in Developing Countries’. World Development 37 (11): 1717–27.
Reardon, Thomas, and C. Peter Timmer. 2014. ‘Five Inter-linked Transformations in the Asian Agrifood Economy: Food Security Implications’. Global Food Security 3 (2): 108–17. Reardon, Thomas, C. Peter Timmer, Christopher B. Barrett, and Julio Berdegué. 2003. ‘The Rise of Supermarkets in Africa, Asia, and Latin America’. American Journal of Agricul -tural Economics 85 (5): 1140–46.
Shilpi, Forhad, and Dina Umali-Deininger. 2007 ‘Where to Sell? Market Facilities and Agri-cultural Marketing’. Policy Research Working Paper 4455, World Bank, Washington, DC.
Vermunt, Jeroen K., and Jay Magidson. 2008. LG-Syntax User’s Guide: Manual for Latent GOLD 4.5 Syntax Module. Belmont, MA: Statistical Innovations Inc.
Wollni, Meike, and Manfred Zeller. 2007. ‘Do Farmers Beneit from Participating in Spe-cialty Markets and Cooperatives? The Case of Coffee Marketing in Costa Rica’. Agricul -tural Economics 37 (2–3): 243–48.
World Bank. 2007. Horticultural Producers and Supermarket Development in Indonesia. Report 38543-ID. Jakarta: World Bank.