* Email address : [email protected]
THE INFLUENCE OF CONVERSION MODEL CHOICE FOR EROSION RATE ESTIMATION
AND THE SENSITIVITY OF THE RESULTS TO CHANGES IN THE MODEL PARAMETER
Nita Suhartini
*Center for the Application of Isotopes and Radiation Technology, National Nuclear Energy Agency, Jl.. Cinere Pasar Jumat Kotak Pos 7002 JKSKL, Jakarta Indonesia 12070
Received 24 April 2006; Accepted 20 June 2006
ABSTRACT
A study of soil erosion rates had been done on a slightly and long slope of cultivated area in Ciawi – Bogor, using137Cs technique. The objective of the present study was to evaluate the applicability of the 137Cs technique in obtaining spatially distributed information of soil redistribution at small catchment. This paper reports the result of the choice of conversion model for erosion rate estimates and the sensitive of the changes in the model parameter. For this purpose, small site was selected, namely landuse I (LU-I). The top of a slope was chosen as a reference site. The erosion/deposit rate of individual sampling points was estimated using the conversion models, namely Proportional Model (PM), Mass Balance Model 1 (MBM1) and Mass Balance Model 2 (MBM2). A comparison of the conversion models showed that the lowest value is obtained by the PM. The MBM1 gave values closer to MBM2, but MBM2 gave a reliable values. In this study, a sensitivity analysis suggest that the conversion models are sensitive to changes in parameters that depend on the site conditions, but insensitive to changes in parameters that interact to the onset of137Cs fallout input.
Keywords:soil erosion, environmental radioisotope, cesium
INTRODUCTION
Erosion is a major problem in Indonesia, because of both deforestation and land use practices. The use of erosion plots to assess the severity of erosion under a variety of soil-slope-crop combinations, either under natural or simulated rainfall, is costly and time consuming. Furthermore, erosion plots do not reproduce all the processes that take place at the field scale. Nuclear technique, using the environmental isotope
137
Cs can be used to establish the erosion rate and this technique is simpler than conventional methods [1].
Caesium-137 is a fallout product of nuclear weapons testing carried out in the late 1950’s and early 1960’s [2]. On reaching the earth’s surface, 137Cs is rapidly and firmly adsorbed to the surface soil and can therefore be used as a tracer of soil redistribution. The
137
Cs technique is based on a comparison between the
137
Cs inventories measured at eroded/deposited sites in the landscape and the local reference 137Cs inventory that is normally established by sampling at a long-term undisturbed site. Negative (-) values are indicative of erosion and positive (+) values reflect deposition. The
137
Cs technique can document the spatial distribution of erosion and deposition in the landscape, and affords a fast and economical way of estimating the results of soil redistribution occurring over the last 35 – 40 years. Both soil loss and deposition can be estimated and their spatial extent delineated [2].
This study was undertaken in a cultivated area at Bojong – West Java. The objective of the study was to evaluate the applicability of137Cs technique for obtaining
spatially distributed information on mean annual rates of soil redistribution and to test conversion models suitable for the study field. This is the first investigation to quantify soil redistribution rates in the study area. In calculating the erosion/deposition rate, three conversion models were selected, namely the Proportional Model (PM), Mass Balance Model 1 (MBM1) and Mass Balance Model 2 (MBM2) contained within the software developed by the University of Exeter [3]. This paper reports the estimates of erosion/deposition rates obtained using the models, and a sensitivity analysis of the conversion models. A comparison of a soil redistribution rates obtained using the three conversion models aimed to choose a conversion models which provide a reliable result. A sensitive analysis was undertaken to obtain valuable information on the dominant factor which influences the implication in using of 137Cs technique. In estimating the erosion/deposition rate of individual sampling point, some modification to the running of the software was necessary, because of the year that cultivation started occurred after the onset of137Cs fallout.
EXPERIMENTAL SECTION
Material
The soil samples were collected in 2003. For measuring 137Cs inventories at the reference site and along the transects within the study field, bulk samples were collected using metal cylinders (coring) 0.070 m in diameter with a coring interval of 2 m for 16 points, and one scraper plate. Twenty four core samples were collected from land use I with a 5 m distance between the points using metal cylinders (coring) 0.070 m in diameter.
Instrumentation
Gamma spectrometry is an instrument used for analyzing concentration of137Cs in the soil sample.
Procedure
In laboratory, all samples were air dried, weighed, and disaggregated. Each dry sample was sieved through a 2 mm sieve to separate the fine soil from the > 2 mm fraction. A representative sub sample of the fines (ie 500 g) was put to the plastic marinelli beaker for determination of 137Cs. The137Cs activity was measured by gamma spectrometry at 661 keV with a minimum counting time of 50000 s.
Based on the concentration obtained from gamma spectrometry, erosion/deposition rate of each point was calculated by using [3] :
1. The Proportional Model :
10 . .
Y = mean annual soil loss (t/ha/yr)
d = depth of plough of cultivation layer (m) B = bulk density of soil (kg/m3)
X = percentage reduction in total137Cs inventory (defined as for erosion :
(Aref–A)/Arefx100)
and for deposition : (A - Aref)/Arefx100) )
T = time elapsed since initiation of137Cs accumulation (yr)
Aref= local 137
Cs reference inventory (Bq/m2)
A = measured total137Cs inventory at the sampling point (Bq/m2)
P = particle size correction factor (generally > 1.0)
2. Mass Balance Model 1
Mass balance models attempt to overcome some of the limitations of the simple proportional model by taking account of both inputs and losses of137Cs from the profile over the period since the onset of 137Cs fallout, which assumes that the total 137Cs fallout occurred in 1963 :
Y = 10 d B (1 – (1 – X/100)1/(t-1963)) (2)
Where :
Y = mean annual soil loss (t/ha/yr)
d = depth of plough or cultivation layer (m) B = bulk density of soil (kg/m3)
3. Mass Balance Model 2
This model is improvement of the basic mass balance model to take account of the time variant fallout137Cs input and the fate of the freshly deposited fallout before its incorporation into the plough layer by cultivation.
A(t) = cumulative137Cs activity per unit area (Bq/m2) R = erosion rate (kg/m2/yr)
d = cumulative mass depth representing the average plough depth (kg/m2)
λ = decay constant for 137
Cs (yr-1)
I(t) = annual137Cs deposition flux (Bq/m2/yr)
Γ = percentage of the freshly deposited137Cs fallout removed by erosion before being mixed into the plough layer
If an exponential distribution for the initial distribution of
137
Cs fallout at the surface of the soil profile can be assumed,Γcan be expressed as :
Γ = Pγ (1 – e-R/H) (4)
Where γ is the proportion of the annual 137
Cs input susceptible to removal by erosion, and H (kg/m2) is the relaxation mass depth of the initial distribution of fallout
137
Cs in the soil profile.
RESULT AND DISCUSSION
Choice of Conversion Model
The average value for the reference inventory obtained from this study site was (261 ± 37) Bq/m2. In the study field, cultivation started in 1978, and the conversion model software assumes that cultivation started in 1954 for PM, 1963 for MBM1 and the year that cultivation started for MBM2 can be specified. In the study field, erosion has been ongoing for 24 years. To calculate the net erosion rate for 24 years of individual sampling point using PM and MBM1, the
137
three conversion models is provided for land use I in Table 1.
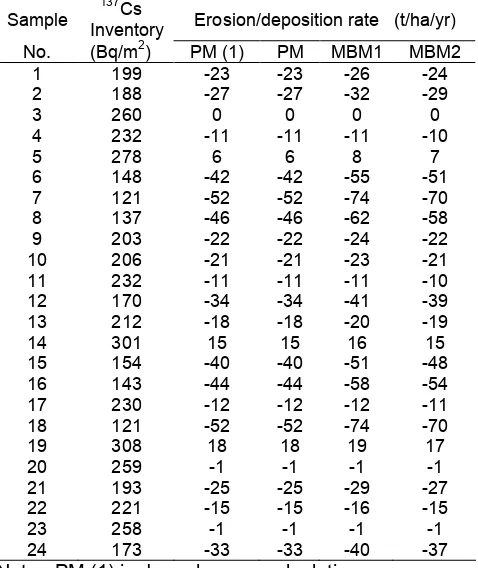
From Table I, it can be seen that the PM gives a lower value compare to MBM1 and MBM2. The PM underestimates erosion/deposition rate, because it ignores the fact that as erosion processes soil from below the original plough depth is incorporated into the plough layer, it assumes that the soil loss is directly proportional to the amount of 137Cs removed from the soil profile since the beginning of the 137Cs accumulation. MBM1 gives a values close to MBM2, but in this calculation MBM2 gives a reliable values, because MBM2 has a specific parameter that involved the proportion of 137Cs fallout to the soil surface that is removed prior to incorporation into the soil by tillage and the depth of the initial distribution of 137Cs fallout in the soil profile (i.e. Γ parameter). The mean and net erosion/deposition rate of each plot was estimated using GRID modeling tools provided by Surfer software. The study plot has been divided into cells with an area of 3 m x 3 m. The calculation of mean and net erosion rate for land use I gives a lower value for the PM, and similar values for MBM1 and MBM2 (Table 2). This site is cultivated by hoelike tool, and is kept flat after cultivation. The fine soil at this site is easy remove to the lower point by water erosion, because sometime this site was unplanted and kept in flat condition. According to Wischmeier and Smith, the value of 10 t/ha/yr is the maximum soil tolerance rate, and it suggest that land use I has serious erosion over 24 years [4].
Sensitivity Analysis
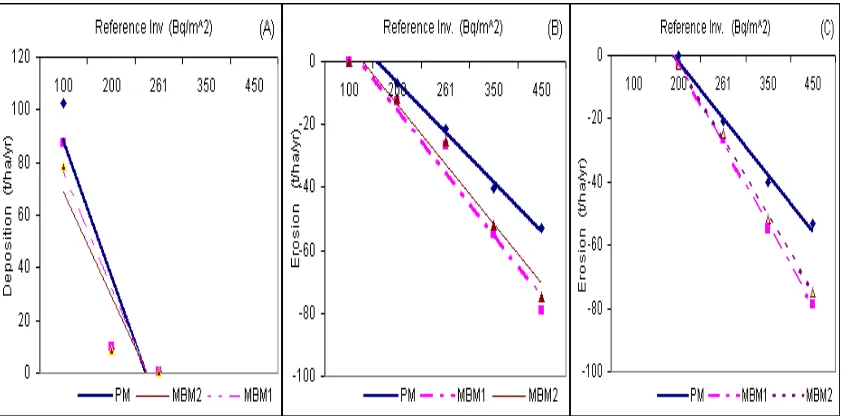
To undertake the sensitivity analysis of the conversion models, several parameters were varied, namely the reference inventory (for PM, MBM1 and MBM2), plough depth (for PM, MBM1 and MBM2), bulk density (for PM and MBM1), and the proportion factor and relaxation depth for MBM2. In the sensitivity analysis, if one parameter was varied, the others parameters were kept constant. Mean and net erosion/deposition was calculated using GRID modelling tools provided by surfer software based on soil rates of individual sampling points from landuse I estimated by the PM, MBM1 and MBM2. The reference inventory was varied from 100 Bq/m2to 450 Bq/m2, and the net erosion obtained using the PM, MBM1 and MBM2 ranged from -20 t/ha/yr to -53 t/ha/yr, from -27 t/ha/yr to -79 t/ha/yr and from -3 t/ha/yr to -75 t/ha/yr, respectively. An increasing of reference inventory by 50 % will increase a net erosion for PM, MBM1 and MBM2 by 100 %, 127 % and 135 %, respectively. The results show that change in the reference inventory parameter produces a significant change in the net erosion values, and Fig 1 shows that variation of the reference inventory provided curves with same steep slope for MBM1 and MBM2 but smaller differences for the PM. It means that the
Table 1. Erosion/deposition rate of individual sampling point estimates obtained from the sampling grid in land use I
Note : PM (1) is done by own calculation
Table 2. Result of mean erosion/deposition and net erosion for landuse-I
Rate (t/ha/yr)
PM MBM1 MBM2
Mean erosion -21 -27 -25
Mean deposit 0 1 0
Net erosion -21 -26 -25
conversion models are highly sensitive to a changes of reference inventory value. For increase in the reference site value will increase the net erosion value obtained using the three conversion models.
Fig 1.The influences of variation in the reference inventory on the (A) mean deposition (B) mean erosion and ( C) net erosion values estimated using PM, MBM1 and MBM2
Fig 2. The influences of variation in the plough depth on the (A) mean deposition (B) mean erosion and ( C) net erosion values estimated using PM, MBM1 and MBM2
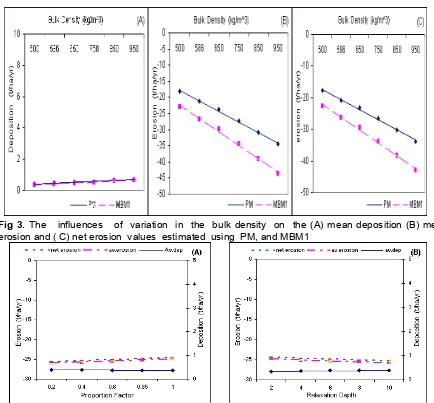
Variation of the bulk density values from 500 kg/m3 to 950 kg/m3produces a significant increase in the value of net erosion. The changes of net erosion value for PM and MBM1 are from 18 t/ha/yr to 34 t/ha/yr, and from -23 t/ha/yr to -43 t/ha/yr, respectively. For an increasing of bulk density by 50 % will increase the net erosion of PM, and MBM1 by 54 % and 60 %, respectively. This shows that the two conversion models (PM and MBM1) are sensitive to changes in the value used for bulk density, and Fig 3 provides curves with the same steep slope for both models. Sensitivity analysis of the conversion models showed that increase in the values used for the reference inventory, the plough depth and bulk density will increase the net erosion value obtained. The three models are sensitive to changes in these parameters, which reflect to the field site condition.
Fig 3.The influences of variation in the bulk density on the (A) mean deposition (B) mean erosion and ( C) net erosion values estimated using PM, and MBM1
Fig 4. The influences of variation in the (A) proportion factor and (B) relaxation depth MBM2 conversion model
be removed by water erosion before being incorporated into the plough layer by cultivation, and the relaxation depth is the mass depth of the initial distribution of fallout
137
Cs in the soil profile after cultivation. A change in the proportion factor and the relaxation depth will not significant influence the MBM2 conversion model if the year that cultivation started was after the input 137Cs fallout stopped Fig 4 provides curves with only a slight slope for the effect of changes in the proportional factor and relaxation depth on erosion/deposition rates.
CONCLUSION
The PM conversion model underestimates mean and net erosion rate, which compare to MBM1 and MBM2. MBM2 has a parameter (Γ) that depend on the annual input of 137Cs fallout from atmosphere, and it gives a better result than MBM1. In this experimental, the calculation of erosion/deposition rate using MBM2 was better than MBM1, because in MBM2, a parameter
of start of cultivation year can changed. Net erosion rates in landuse I is very significant, and it suggest that this sites has serious erosion.
A sensitivity analysis showed that the three conversion models are sensitive to a change of reference inventory, depth plough and bulk density, and provide curves with similar slopes. These parameters depend on the soil type and management of the field site. The MBM2 conversion model is not sensitive to a change of proportion factor and the relaxation depth, because these two parameters interact with the input of 137Cs fallout from atmosphere and there is no found input of137Cs fallout after 1978.
ACKNOWLEDGEMENT
support. Discussion with Prof. DR. R . Loughran as IAEA expert concerning the method and his comments have prove invaluable. The author wishes to thank to Prof. D.E. Walling and Dr. Y.S. Zhang from the Geography Dept.- University of Exeter – United Kingdom concerning to the discussion of conversion models. The author also wishes to thank to technicians in Sedimentology Laboratory – P3TIR-BATAN, concerning the their help in sampling and sample preparation.
REFFERENCES
1. Zapata, F., 2002, Handbook for The Assessment of Soil Erosion and Sedimentology using environmental
Radionuclides, Joint FAO/IAEA Division, IAEA, Vienna, 1- 15.
2. Ritchie, J.C., McHenry, J.R., and Gill,A.C., 1972,
Health Phys.,22, 197.
3. Walling, D.E., and He, Q., 1999,J. Env. Quality, 28, 2, 5-15.