Scimago Journal & Country Rank
Home Journal Rankings Country Rankings Viz Tools Help About Us
Applied Economics
Country United Kingdom
62
H Index Subject Area andCategory Economics, Econometrics and FinanceEconomics and Econometrics
Publisher Routledge
Publication type Journals
ISSN 00036846
Coverage 1977-ongoing
Scope Applied Economics is a peer-reviewed journal encouraging the application of economic analysis to speci c problems in both the public and private sectors. It particularly fosters quantitative studies, the results of which are of use in the practical eld, and thus helps to bring economic theory nearer to reality. Contributions which make use of the methods of mathematics, statistics and operations research will be welcomed, provided the conclusions are factual and properly explained. (source)
Enter Journal Title, ISSN or Publisher Name
Quartiles
The set of journals have been ranked according to their SJR and divided into four equal groups, four quartiles. Q1 (green) comprises the quarter of the journals with the highest values, Q2 (yellow) the second highest values, Q3 (orange) the third highest values and Q4 (red) the lowest values.
Category Year Quartile
Economics and Econometrics 1997 Q2
Economics and Econometrics 1998 Q3
Economics and Econometrics 1999 Q3
Economics and Econometrics 2000 Q3
SJR
The SJR is a size-independent prestige indicator that ranks journals by their 'average prestige per article'. It is based on the idea that 'all citations are not created equal'. SJR is a measure of scienti c in uence of journals that accounts for both the number of citations received by a journal and the importance or prestige of the journals where such citations come from It measures the scienti c in uence of the average article
Citations per document
This indicator counts the number of citations received by documents from a journal and divides them by the total number of documents published in that journal. The chart shows the evolution of the average number of times documents published in a journal in the past two, three and four years have been cited in the current year. The two years line is equivalent to journal impact factor ™ (Thomson Reuters) metric.
1997 1999 2001 2003 2005 2007 2009 2011 2013 2015
Economics and Econometrics
1999 2002 2005 2008 2011 2014
Cites per document Year Value Cites / Doc. (4 years) 1999 0.304 Cites / Doc. (4 years) 2000 0.384 Cites / Doc. (4 years) 2001 0.342 Cites / Doc. (4 years) 2002 0.405 Cites / Doc. (4 years) 2003 0.462 Cites / Doc. (4 years) 2004 0.506 Cites / Doc. (4 years) 2005 0.678 Cites / Doc. (4 years) 2006 0.871 Cites / Doc. (4 years) 2007 0.908 Cites / Doc. (4 years) 2008 1.038 Cites / Doc. (4 years) 2009 1.092
Total Cites Self-Cites
Evolution of the total number of citations and journal's self-citations received by a journal's published
documents during the three previous years.
Journal Self-citation is de ned as the number of citation from a journal citing article to articles published by the same journal.
Cites Year Value
Self Cites 1999 22
External Cites per Doc Cites per Doc
Evolution of the number of total citation per document and external citation per document (i.e. journal self-citations removed) received by a journal's published documents during the three previous years. External citations are calculated by subtracting the number of self-citations from the total number of citations received by the journal’s documents.
Cites Year Value
% International Collaboration
International Collaboration accounts for the articles that have been produced by researchers from several
countries. The chart shows the ratio of a journal's documents signed by researchers from more than one country; that is including more than one country address.
Year International Collaboration
1999 11.32
Citable documents Non-citable documents
Not every article in a journal is considered primary research and therefore "citable", this chart shows the ratio of a journal's articles including substantial research (research articles, conference papers and reviews) in three year windows vs. those documents other than research articles, reviews and conference papers.
Documents Year Value
Cited documents Uncited documents
Ratio of a journal's items, grouped in three years windows, that have been cited at least once vs. those not cited during the following year.
Documents Year Value
Uncited documents 1999 396
Uncited documents 2000 358
Uncited documents 2001 405
Uncited documents 2002 403
←
Show this widget in
your own website
Just copy the code below and paste within your html code:
<a href="http://www.scimagojr.com/journalsearch.php?q=18768&tip=sid&exact=no" title="SCImago Journal & Country Rank"><img border="0" src="http://www.scimagojr.com/journal_img.php?id=18768" alt="SCImago Journal & Country Rank" /></a> 0.6
0.8 1 1.2 1.4
1999 2002 2005 2008 2011 2014
0 600 1.2k
1999 2002 2005 2008 2011 2014
0 0.4 0.8 1.2
1999 2002 2005 2008 2011 2014
0 20 40
1999 2002 2005 2008 2011 2014
0 700 1.4k
1999 2002 2005 2008 2011 2014
Developed by:
Powered by:
Follow us on
APPLIED ECONOMICS
VOLUME 45
NUMBERS 1-3 ISSN 0003-6846
Contents·
· B. Lucke F. Bilge! and'K. C. Tran
Testing the technology interpretation of news shocks The determinants of Canadian provincial health expenditures: E. Fatas, N. Georgantzis, J. A. Mafiez and G. Sabater evidence from a dynamic panel 201
Experimental duopolies under price guarantees 15 S. Hammoudeh , M. Nandha andY. Yuan
J. H . Park and D . L. MacLachl an Dynamics of CDS spread indexes of US financial sectors 213 Estimating willingness to pay by risk adjustment mechanism 37 H.-C. Chou, R . Zaabar and D . Wang
C. P. Barros, A . G . de Menezes and J . C. Vieira Measuring and testing the long-term impact of terrori st
Measurement of hospital efficiency, using a latent class attacks on the US futures market 225 stochastic frontier model 47 V. Carrieri and M. Bilger
C. I. Tra Preventive care: underused even when free. Is there something
Nonlinear income effects in random utility models: revisiting else at work? 239 the accuracy of the representative consumer approximation 55
V. Tuesta
The consumption-real exchange rate anomaly: nontraded
goods and distribution services 255
H. J . Faria, H. M. Montesinos-Yufa, D. R. Morales, C. G. Aviles B. and 0. Brito-Bigott
Does corruption cause encumbered business regulations? An
IV approach 65 D. Kim , J. I. Kim and T . Sung
K. Fukuda Stock ma rket liberalizati on and price response: gradualism
Decomposition of new venture growth into firm age, survey versus cold turkey 273
period and vintage effects 85
J. M. Santos N. G. Vaillant and F.-C. Wolff
Understanding how experts rate cigars: a 'havanometric'
セセ@ セ@
M. P. Olivero and R. Madak
Financial integration within Europe and the international
transmission of business cycles among industrialized countries Ill
N. Winchester and R. T. Stefani
Trading grain now and then: the relative performance of early
grain-futures markets 287
C. Grund and A. Schmitt
Works councils, wages and job satisfaction 299
I. Ma rtinez-Zarzoso
The log of gravity revisited 311
An innovative approach to National Football League 1. Klomp and J. DeHaan
standings using bonus points 123 Do political budget cycles reall y exist? 329
C. H . Hsieh and F. Lin A. Direr
Applying digital analysis to detect fra ud: an empirical a nalysis Are betting markets efficient? Evidence from European
of US marine industry 135 Football Championships 343
B. Tadesse and E. K. Shukralla
The impact of foreign direct investment on horizontal export
P. H. van der Meer and R. Wielers
What makes workers happy? 357
diversification: empirical evidence 141 T . Ng, T. Tai-Leung Chong, M .-T. Siu and B. Everard
C. Martinez-Sola, P. J . Garcia-Teruel and P. Martinez-Solano What determines the price of a racing horse? 369 Corporate cash holding and firm value 161 Suyanto and R. Salim
V. A. Dang Foreign direct investment spillovers and technical efficiency in
Testing capital structure theories using error correction the Indonesian pharmaceutical sector: firm level evidence 383 models: evidence from the UK, France and Germany 171 J . E. Askildsen a nd T . H . Holmas
H.-C. (River) Huang and C.-C. Yeh Wages and work conditions as determinants for physicians'
Okun's law in panels of countries a nd states 191 work decisions 397
Applied Ecunomics is published by
Applied Economics is published three times a month by Routledge, an imprint of Taylor & Francis, 4 Park Square, Milton Park, Abingdon OXI4 4RN, UK. This journal is subject to a peer-review process. A full listing of Taylor & Francis publications is available at http:// www.tandfonline.com
Subscription rates
In 2013 a subscription to Volume 45 of Applied Economics will consist of 36 issues of Applied Economics, 18 issues of Applied Economics Leuers and 24 issues of Applied Financial Economics . It is also possible to sub-scribe to a combination of Applied Economics and Applied Financial
Economics, details of which are available on request.
The 2013 subscription rates of Volume 45 (36 issues) are: US$11765; £7128; €9411. Online only: US$10294; £6237; €8235 (plus tax where applicable). Prices include Internet access to the journal.
All subscription enquiries should be addressed to:
UK/Europe/Rest of the World - Routledge Journals, T&F Customer Services, T&F Informa UK Ltd, Sheepen Place, Colchester, Essex, C03 3LP, UK. Tel: +44 (0) 20 7017 5544. Fax: +44 (0) 20 7017 5198.
USA/Canada - Routledge Journals, Taylor & Francis Inc., Journals Department, 325 Chestnut Street, 8th Floor, Philadelphia, PA 19106, USA. Tel: +I (215) 269 0400. Fax: +I (215) 269 0363 .
Japan - Routledge Journals, Kinokuniya Co. Ltd, Journals Department, PO Box 55, Chitose, Tokyo 156, Japan.
India - Routledge Journals, Universal Subscriptions Agency Pvt Ltd, 877 Phase V, Udyog Vihar, Gurgaon, 122001, India.
Journals are sent second-class in the UK and by air speeded post or air freight to most other countries.
Applied Economics (USPS permit number 020 956) is published three times a month. Printed copies of Applied Economics are produced 12 times a year in January, February, March, April, May, June, July, August , September, October, November and December, each containing 3 issues . The 2013 US institutional subscription price is $11765. Periodicals postage paid at Jamaica, NY by US Mailing Agent Air Business Ltd, cfo Worldnet Shipping USA Inc., 149-35 I 77th Street, Jamaica, New York, NY 11434.
US Postmaster: Send address changes to RAEC, cf o Air Business Ltd, 155-11 I 46th, Street, Jamaica, New York, NY 11434. Subscription records are maintained at Taylor & Francis Group, 4 Park Square, Milton Park, Abingdon, OXI4 4RN, UK .
Back Issues:
Taylor & Francis retains a three year back issue stock of journals. Older volumes are held by our official stockists: Periodicals Service Company < http://www.periodicals.comftandf.html > , II Main Street, Germantown, NY 12526, USA to whom all orders and enquiries should be addressed. Telephone: +I 518 537 4700; Fax: +I 518 537 5899; E-mail: [email protected]
Sample copy and back issue requests should be addressed to the Basingstoke address above.
Advertising enquiries to:
USA/Canada - the Advertising Manager, Advertising Department, Taylor & Francis, 325 Chestnut Street, 8th Floor, Philadelphia, PA 19106, USA. Tel: +I (215) 625 8900. Fax: +I (215) 625 2240.
EU/RoW - the Advertising Manager, Routledge Journals, Taylor & Francis, 4 Park Square, Milton Park, Abingdon OXI4 4RN, UK . Tel: +44 (0) 1235 828 600. Fax: +44 (0) 1235 829 000.
Editorial enquiries to: Publishing Editor, Applied Economics, Routledge Journals, Taylor & Francis, 4 Park Square, Milton Park, Abingdon OXI4 4RN, UK. Tel: +44 (0) 207 017 6000. Fax: +44 (0) 207 017 6336. Submission status enquiries to: Anita Philips, Warwick Business School, Warwick University, Coventry CV4 7AL, UK.
Applied Economics is Abstracted/Indexed in: Current Contents: Social
and Behavioral Sciences; Risk Abstracts; PAIS International IS!: Social Sciences Citation Index; Research Alert ; Wilson Business Abstracts; CAB Abstracts and Academic Search; Business Periodicals Index; GEO Abstracts; ABI Inform; Current Index to Statistics; Social SciSearch; PwC Executive Digest; International Bibliography of th e Social Sciences (IBSS); Emerald Reviews; IBZ International Bibliography of Periodical Literature ; Journal of Economic Literature and ( JEL-online ).
© 2013 Taylor & Francis. All rights reserved.
This ar t icle was dow nloaded by: [ Cur t in Univer sit y of Technology] On: 25 Sept em ber 2011, At : 19: 15
Publisher : Rout ledge
I nfor m a Lt d Regist er ed in England and Wales Regist er ed Num ber : 1072954 Regist er ed office: Mor t im er House, 37- 41 Mor t im er St r eet , London W1T 3JH, UK
Applied Economics
Publ icat ion det ail s, incl uding inst ruct ions f or aut hors and subscript ion inf ormat ion: ht t p: / / www. t andf onl ine. com/ l oi/ raec20
Foreign direct investment spillovers and technical
efficiency in the Indonesian pharmaceutical sector:
firm level evidence
Suyant o a & Ruhul Sal im b
a
Facul t y of Economics, Universit y of Surabaya, East Java, Indonesia
b
School of Economics and Finance, Curt in Universit y, Pert h, Aust ral ia
Avail abl e onl ine: 23 Sep 2011
To cite this article: Suyant o & Ruhul Sal im (2013): Foreign direct invest ment spil l overs and t echnical ef f iciency in t he
Indonesian pharmaceut ical sect or: f irm l evel evidence, Appl ied Economics, 45: 3, 383-395
To link to this article: ht t p: / / dx. doi. org/ 10. 1080/ 00036846. 2011. 605554
PLEASE SCROLL DOWN FOR ARTI CLE
Full t er m s and condit ions of use: ht t p: / / w w w.t andfonline.com / page/ t er m s- and- condit ions
This ar t icle m ay be used for r esear ch, t eaching and pr ivat e st udy pur poses. Any subst ant ial or syst em at ic r epr oduct ion, r e- dist r ibut ion, r e- selling, loan, sub- licensing, syst em at ic supply or dist r ibut ion in any for m t o anyone is expr essly for bidden.
Applied Economics
, 2013,
45
, 383–395
Foreign direct investment spillovers
and technical efficiency in the
Indonesian pharmaceutical sector:
firm level evidencey
Suyanto
aand Ruhul Salim
b,*
a
Faculty of Economics, University of Surabaya, East Java, Indonesia b
School of Economics and Finance, Curtin University, Perth, Australia
The spillovers of Foreign Direct Investment (FDI) on domestic firms’ performances have been highly debated for many years. This article contributes to this debate by analysing spillovers effects on technical efficiency of Indonesian pharmaceutical sector using a unique unbalanced panel of highly disaggregated (at five-digit International Standard Industrial Classification (ISIC)) 210 firms over the period 1990–1995 (1001 observations). The Stochastic Production Frontier (SPF) and the
Data Envelopment Analysis (DEA) based on Malmquist Productivity
Indices (MPI) have been used to test the spillovers effects of FDI on technical efficiency. The empirical results from the SPF show that foreign firms are more efficient than domestic competitors, and the presence of the former increases the inefficiency of the latter. Similarly the results from the MPI demonstrate that FDI has a negative and significant impact on technical efficiency changes in domestic competitors, but generate positive spillovers to domestic suppliers.
Keywords: FDI spillovers; technical efficiency; stochastic frontier;
Malmquistproductivity index
JEL Classification: D24; D29; F23
I. Introduction
Foreign Direct Investment (FDI) is considered, in most developing countries, to be a driving force of economic growth, and policies are accordingly designed to attract more FDI. Host countries offer a wide range of fiscal and financial incentives to foreign firms. These incentives are justified on a common argument that FDI provides not only capital and
additional employment but also new knowledge to recipient economies. The new transferred knowledge from Multinational Companies (MNCs) to their subsidiaries may spillover entire recipient economies and increase the economic performance of domestic firms (Blomstrom and Kokko, 1998). This knowledge spillover has recently been regarded as an important source of productivity growth for developing countries
(Suyantoet al., 2009).
*Corresponding author. E-mail: [email protected]
yThe earlier version of this article was presented in the International Conference of Business and Information 2009, 6–8 July, in Kuala Lumpur, Malaysia.
Applied EconomicsISSN 0003–6846 print/ISSN 1466–4283 onlineß2013 Taylor & Francis 383 http://www.tandfonline.com
http://dx.doi.org/10.1080/00036846.2011.605554
Several studies investigate FDI spillovers in reci-pient countries for the past decades; however, the findings are mixed at best. Cross-sectional intra-industry studies show fairly consistent evidence of positive FDI spillovers (for example, Caves, 1974; Globerman, 1979; Driffield, 2001; Dimelis and Lauri, 2002). In contrast, panel-data firm-level studies provide ambiguous results, particularly from devel-oping countries. A number of panel-data studies confirm that FDI generates positive spillovers (for example, Chuang and Hsu, 2004; Javorcik, 2004; Gorg and Strobl, 2005; Kugler, 2006; Liang, 2007), but some studies provide no evidence (Haddad and Harrison, 1993; Kathuria, 2000; Konings, 2001) or even negative evidence (Aitken and Harrison, 1999; Djankov and Hoekman, 2000; Thangavelu and Pattnayak, 2006; Wang and Yu, 2007). Although cross-sectional studies provide more conclusive evi-dence, these studies tend to overstate the positive spillover effects. An observation on one point in time in cross-sectional studies provides only ‘snap shot’ evidence and is unable to control for unobservable industries’ or firms’ heterogeneity (Gorg and Strobl, 2001). In contrast, panel-data studies that focus on a disaggregate industry reduce bias due to the persistent heterogeneity and, therefore, provide a unique picture of spillover effects in a specific industry (Bartelsman and Doms, 2000).
Although the empirical literature shows mixed evidence of FDI spillovers, the policy makers in developing countries, including Indonesia, continue competing for FDI inflows. As noted by Harding and Javorcik (2007), there was a significant increase in the number of national investment promotion agencies between 1990 and 2005, and these agencies provided a variety of incentives for foreign investors. The contrast between the mixed evidence from empirical studies and the actions of policy makers has lead researchers to question whether the existing studies have simply failed to uncover spillover effects that indeed exist or the huge range of incentives provided by government is not warranted. To contribute to this debate, the present study utilizes a firm-level survey data from the Indonesian central board of statistics to examine FDI horizontal and backward spillovers and their impact on firm-specific technical efficiency. It focuses on a highly disaggregated industrial sector
(at five-digit International Standard Industrial
Classification (ISIC)), namely the pharmaceutical industry (ISIC 35222). As argued by Bartelsman
and Doms (2000), disaggregated sectors are prefer-able for analysing firms’ efficiency (or productivity), particularly if related to FDI spillover effects. Since high-technological firms, such as pharmaceu-ticals, tend to have a different capability to absorb FDI spillovers compared to low-technological firms, such as bakeries, pooling them together tends to
understate the spillover effects that might exist.1
This article contributes to the literature in several ways. So far, firm-level studies on FDI spillovers in Indonesia and elsewhere generally pool all manufac-turing firms together. This is one of the first attempts to examine disaggregated industries using the five-digit firm-level panel data. Second, it employs two rigorous productivity analysis methods, namely Stochastic Production Frontier (SPF) and Data Envelopment Analysis (DEA), instead of using the commonly used production function. The authors know no study on FDI spillovers in Indonesia uses both parametric (SPF) and nonparametric (DEA) approaches. These two approaches may shed light on the continuing debate related to spillover effects from FDI.
The rest of this article is structured as follows. Section II provides a literature review, followed by model and estimation strategy in Section III. Section IV presents data sources and measurement of variables followed by estimation and analysis of empirical results in Section V. The conclusion, policy implications and focuses for further studies are presented in the last section.
II. Review of Earlier Literature
FDI and spillover effects
FDI provides direct and indirect benefits for recipient economies. The direct benefits are often in the form of additional capital and employment, while the indirect benefits arise from the externalities resulting from the foreign presence (Hymer, 1960). The argument for the indirect benefits is that the presence of Multinational Corporations (MNCs) due to FDI may generate nonmarket impacts on domestic firms, as the latter may experience increasing efficiency or productivity (i.e. efficiency or productivity spillovers), rising ability to gain profits (pecuniary spillovers), and gaining knowledge to enter international markets (market-access spillovers) (Blomstrom and Kokko,
1
TheOrganization for Economic Co-operation and Development (OECD) classifies industries based on their
technology-intensity into three categories: high, middle and low industries. The pharmaceutical industry is classified as high-technology industry, while bakeries are grouped as a low-technology industry. A detailed discussion of this classification can be found in Hatzichronoglou (1997).
384
Suyanto and R. Salim
1998; Lipsey and Sjoholm, 2005). Of these three spillover effects, the efficiency (or productivity) spil-lover has been of major concern for researchers in the last two decades. This attention is not surprising because efficiency of manufacturing firms is an important aspect of production functions which throws light on the efficiency of the production environment and assesses whether the existing resources are being used efficiently in the post-FDI regime.
Theoretical literature on FDI has identified three channels of intra-industry spillovers. The first chan-nel is demonstration effects, when the presence of
foreign firms in domestic markets encourages
domestic firms to imitate directly the new knowledge or to develop their-own innovations, raising their efficiency or productivity (Das, 1987). The second channel is labour mobility, which happens when the workers trained by MNCs move to domestic firms or establish their own business and bring with them the knowledge (Glass and Saggi, 2002). The third channel is competition, when the entry of foreign firms increases competition in product markets and forces domestic firms to utilize their resources in a more efficient way (Wang and Blomstrom, 1992).
Several empirical studies have been conducted to test the presence of spillovers through these three channels. Cross-sectional studies mostly confirm an unambiguously positive relationship between the presence of FDI and efficiency (or productivity). However, more recent studies using panel data analysis show mixed evidences. Thus, the linkage between FDI presence and firms’ efficiency (or productivity) still remains an unsettled issue. Lipsey and Sjoholm (2005) rightly point out that an effort to find universal evidence of spillover effects may be ineffectual. The evidence of spillovers tends to vary across countries and across industries within coun-tries. Therefore, a focus on a specific disaggregated sector might reveal the uniqueness of the sector in response to the entry of foreign firms. An empirical assessment on a highly disaggregated industry, as in this study, might provide an interesting contribution to the existing literature.
FDI spillovers and the role of vertical linkages
Some researchers argue that negative spillovers of FDI on domestic competitors are not surprising. Aitken and Harrison (1999), for example, note that the net spillover effects of FDI may be negative in the short run, because foreign firms can steal market share. Foreign firms with a lower marginal cost have an incentive to increase production relative to their domestic competitors. The efficiency of domestic
firms might fall because these firms have to spread a fixed cost over a smaller amount of output. In a highly capital-intensive industry, where the fixed costs are significant, the negative spillover effects on domestic competitors would be more severe.
These negative spillovers occur mostly to domestic firms in the same sector (i.e., horizontal spillovers) since they are potential competitors for foreign firms (Javorcik, 2004). In contrast, positive spillovers are more likely to occur to domestic firms those supply inputs for foreign firms (i.e. backward spillovers). The positive spillovers on domestic suppliers might happen through a requirement for high quality inputs and technical training provided by foreign firms to domestic firms’ employees. A high-quality input requirement forces domestic firms to utilize resources in a more efficient way, leading to efficiency improvement (Rodriguez-Clare, 1996). Similarly, the training from foreign buyers updates the knowledge of domestic suppliers, which in turn raises the efficiency and productivity of domestic suppliers (Javorcik, 2004).
The positive backward spillovers have been identi-fied in a number of empirical studies. Kugler (2006) examines Colombian manufacturing and finds that positive FDI spillovers occurred mainly between industries and negative spillovers within industries. According to Kugler, foreign firms tend to be rivals of domestic firms in the same industry but become channels of knowledge diffusion for domestic firms in upstream industries. In a similar vein, Liang (2007) tests the spillover hypothesis for Chinese manufactur-ing industries and discovers that positive productivity spillovers take place only from foreign firms to local suppliers, but there is no spillover to domestic firms in the same industries. In a study on Indonesian manufacturing firms, Blalock and Gertler (2008) also find that there are positive productivity spillovers to local suppliers, but negative productivity spillovers exists on firms in the same sectors. Blalock and Gertler’s study focuses on all manufacturing firms and three selected two-digit industries. This present study extends Blalock and Gertler’s (2008) study by examining a more detailed five-digit industry, namely pharmaceuticals.
Foreign firms and technical efficiency
In the early literature on FDI, productivity spillovers are often regarded synonymously as technology spillovers. The use of a standard production function, which assumes full efficiency production, makes the impact of FDI on domestic firms’ productivity appear solely as a shift in the production curve. Positive productivity spillovers are represented by an
FDI spillovers and technical efficiency
385
upward shift of the production curve while the negative spillovers are reflected in a downward shift. The recent literature focuses on both technology and technical efficiency. In this literature, the assumption of full efficiency is relaxed, and therefore, the externalities of FDI appear both as technological advancement (i.e. a shift in the production curve) and technical efficiency improvement (i.e. movement to the most efficient level given a set of inputs). Although FDI spillovers on technical efficiency are a relatively new issue, there is growing concern about this field. In a study on 4056 Greek firms in 1997, Dimelis and Lauri (2002) identify positive FDI spillovers on domestic firms’ efficiencies. A similar finding is made by Ghali and Rezgui (2008) when they analyse the Tunisian manufacturing sector. Dimelis and Lauri (2004) extend their previous study and find that efficiency spillovers stem from foreign firms with minority holdings.
III. Estimation Methods and Empirical Models
Focusing on FDI spillovers that appear through technical efficiency, this study adopts two productiv-ity methods: a SPF with inefficiency effects and a
DEA basedMalmquistProductivity Index (MPI). In
the SPF, FDI productivity spillovers are estimated through the relationship between the FDI-spillover and technical inefficiency. FDI-spillover variables are included in the technical inefficiency effect as contributing factors, together with other firms’ specific variables. If the estimate of FDI-spillovers shows a negative sign and is statistically significant, it is argued that FDI generates positive technical efficiency spillovers. In the MPI, the technical efficiency change is calculated using the DEA approach and panel analysis is employed to estimate the spillover effects.
The stochastic production frontier model
The frontier analysis suggests numerous estimation models. Each model has its own merits and limita-tions, and the debate over which model is superior continues (see, for example, Kumbhakar and Lovell
(2000) and Coelli et al. (2005) for excellent
discus-sions on advantages and disadvantages of each model). This study adopts Battese and Coelli’s
(1995) model because it is applicable to unbalanced panel data and uses a single-stage estimation
approach.2
The Battese and Coelli’s model can be written in a functional form as
Yit¼fðXit;Þ:expðvituitÞ ð1Þ
uit¼zitþ!it ð2Þ
where Yit denotes the scalar output of firm i
(i¼1, 2,. . .,N) at time t (t¼1, 2,. . .,T), Xit is a
(1k) vector of inputs used by firmiat timet,is a
(k1) vector of unknown parameters to be
esti-mated; the vit is a random error;uit is the technical
inefficiency effect;zitis a (1m) vector of observable
nonstochastic explanatory variables affecting
techni-cal inefficiency for firmiat timet,denotes a (m1)
vector of unknown parameters of the inefficiency
effect to be estimated;!is an unobservable random
error.
Equation 1 shows the stochastic production frontier in terms of the original production value, and Equation 2 represents the technical inefficiency
effects. The parameters of both equations are
estimated simultaneously by the maximum-likelihood method. The variance parameters of the likelihood
function are estimated in terms of 2s2vþ2u and
2u=s2(see Battese and Coelli (1993) for a detailed
explanation of the log-likelihood functions and the variance parameters).
Assuming that the production frontier takes the form of a Cobb–Douglas technology with two inputs,
labour (L) and capital (K), the empirical model for
the production frontier can be expressed in a natural logarithm (ln) as follows:
lnYit¼0þ1lnLitþ2lnKitþvituit ð3Þ
To test a hypothesis of FDI spillovers on technical efficiency, FDI variables are incorporated in the inefficiency function. Hence, the exogenous variables affecting inefficiency in this study are separated into two groups: FDI variables and other exogenous variables. The inefficiency function can be rewritten as
uit¼FDIitþgitþ!it ð4Þ
whereFDIis a (1j) vector of FDI variables of firmi
at time t, is a (j1) vector of intercepts, g is a
(1p) vector of other exogenous variables of firmiat
timet, andis a (p1) vector of intercepts for other
exogenous variable.
2
A stream of SPF with inefficiency effects can be divided into two groups based on the stage of estimation: the earlier two-stage approach and the more recent one-two-stage approach. The one-two-stage approach was introduced when researchers discovered that there were problems with the two-stage approach, which can lead to bias in estimations (Kumbhakaret al., 1991; Wang and Schmidt, 2002).
386
Suyanto and R. Salim
The estimation procedure for the chosen stochastic frontier model is as follows:
(1) All variables are conversed into logarithm natural (ln).
(2) The stochastic frontier production function and the inefficiency function are estimated simultaneously using a single-stage method introduced by Battese and Coelli (1995). FRONTIER4.1 computer software is used to
conduct the estimation.3
(3) The estimated parameters of the SPF, which represent the elasticity of inputs to output, are used to set a frontier, and the most efficient firm is assumed to be on the frontier.
(4) The sign of estimated parameters for FDI variables in the inefficiency function indicate the spillover effects on technical efficiency. If the sign is negative and statistically significant, it is taken as evidence of positive FDI spillovers
on domestic firms’ efficiency.4Likewise, if the
sign is positive and statistically significant, it might suggest negative FDI spillovers on efficiency. In contrast, if the estimated para-meter of a FDI-spillover is insignificant, it indicates no FDI spillovers.
The MPI
The MPI has recently gained increasing popularity in efficiency and productivity analysis. This method is adopted in this study for decomposing Total Factor Productivity (TFP) growth into Technical Efficiency Change (TEC) and Technological Change (TC). The calculated TEC indices are then used to examine the FDI spillovers on Efficiency Change (EC) using a
panel data analysis.5
The MPI is defined using the Shephard’s (1970)
distance function.6 The distance functions can be
generalized from either an input-oriented or an output-oriented objective. From the input orienta-tion, the distance function is defined as the minimum feasible contraction of the input vector with the output vector held fixed (i.e. the input minimization objective). Likewise, the output distance function is
defined as the maximum feasible expansion of the output vector given a fixed input vector (i.e. the output maximization objective). In this study, the
output-oriented Shepard’s distance function is
adopted since the focus is on output productivity.
Consider a panel of i (i¼1,. . .,N) producers
observed in t (t¼1,. . .,T) periods, transforming
input vectors xt
i¼ ðxt1i,. . .,xtniÞ 2 <nþ into output
vectors yt
i¼ ðyt1i,. . .,ytmiÞ 2 <mþ. Given this
informa-tion, technology can be represented by the production possibility set of feasible input–output combinations
St¼ xt,yt
;xt2 <nþcan produceyt 2 <mþ
,
t¼1,. . .,T ð5Þ
which are assumed to satisfy the usual regularity axioms of production theory (Fare and Primont, 1995). Within this framework, a valid representation
of the technology from thei-th firm perspective using
the output oriented Shephard’s (1970) distance
function Dt
Oðxti,ytiÞ:<nþ <mþ! <1þ[ 1f g which is
defined as7
DtO xti,yti inf
40: xti,yti=2St
ð6Þ
The technology in Equation 6 is assumed linearly
homogenous of degreeþ1 inyand nonincreasing in
x. For any period of timet, a complete
characteriza-tion of the technology of firmi, is expressed as
DtOðxti,ytiÞ 1,yti 2St ð7Þ Equation 7 serves as a criterion for measuring the relative distance from the frontier of the technology set to any point of input–output combination inside the set. Following an output distance function of Shepard (1970), the maximum feasible expansion of the output vector with the input vector held fixed is
Dt
Oðxti,ytiÞ ¼1. In this condition, the evaluated firm is
said to be efficient belonging to the best practice technology, which is represented by the subset
isoquant Stðx,yÞ ¼ ðx,yÞ:Dt
Oðxti,ytiÞ ¼1
. In
con-trast, if Dt
Oðxti,ytiÞ51, a radial expansion of the
output vector yti is feasible within the production
technology for the observed input level xt
i and the
evaluated firm is said to be inefficient.
3
FRONTIER4.1 was developed by Tim Coelli in the Department of Econometrics, University of New England. The program, written in Shazam, can be run on an IBM-PC. In this program, the execution of a stochastic frontier model can be done either by modifying the available instruction file or writing a program language. This program is available online on the Centre for Efficiency and Productivity Analysis website (http://www.uq.edu.au/economics/cepa/frontier.htm). A detailed procedure for running FRONTIER4.1 is discussed in Coelli (1996).
4
Note that the FDI-spillover variables are regressed on the inefficiency indexes. The negative and significant of FDI-spillover estimates imply a reduction in inefficiency (or increasing inefficiency), which indicate positive FDI spillovers on efficiency.
5
This method involves a two-stage estimation procedure. The first stage is to decompose the TFP into EC and technological progress. The second stage is to estimate the spillover effects of FDI to EC.
6
For a comprehensive survey on the development of MPI, please see Zofio (2007).
7The symbol ‘inf’ denotes ‘infimum’ or ‘the greatest lower bound’.
FDI spillovers and technical efficiency
387
The MPI measures TFP growth for two adjacent time periods by calculating the ratio of the distance of each data point relative to a common technology.
Following Fa¨reet al. (1994), the output-oriented MPI
between periodtand periodtþ1 is defined as
Mo xtiþ1,y tþ1 i ,x
t i,y
t i ¼ " Dt o xtþ
1
i ,ytiþ1
Dt o xti,yti
!
D
tþ1
o xtiþ1,ytiþ1
Dtþ1
o xti,yti
!#12
ð8Þ
where Moðxtiþ1,yitþ1,xti,ytiÞ is a MPI for period t
to tþ1,Dt
Oðxtiþ1,ytiþ1Þ represents a distance function
that compares the tþ1 period firms to the t period
technology,Dt
Oðxti,ytiÞis a distance function for firmi
at the tperiod technology, Dtþ1
O ðxtiþ1,ytiþ1Þdenotes a
distance function for firm i at the tþ1 period
technology, and DtOþ1ðxt
i,ytiÞ is a distance function
that compares the t period firms to the tþ1 period
technology.
An equivalent way to express Equation 8 is
Mo xtiþ1,y tþ1 i ,x
t i,y
t i
¼ D
tþ1
o xtiþ1,ytiþ1
Dt o xti,yti
!
x
"
Dt
o xtiþ1,ytiþ1
Dtþ1
o xtiþ1,ytiþ1
!
D
t o xti,yti
Dtþ1
o xti,yti
!#12
ð9Þ
where the first part of the right-hand side of the equation measures the change in the output-oriented measure of Farrell (1957) technical efficiency between
period t andtþ1, and the second part measures the
geometric mean of the TC between two periods,
evaluated at xtþ1 and xt. Hence, the MPI is the
product of the change in relative efficiency (TEC)
that occurred between period t and tþ1, and the
change in technology (TC) that occurred in the same periods, which can be written as
Mo xtiþ1,y tþ1 i ,xti,yti
¼TECti,tþ1TCti,tþ1 ð10Þ Where
TECti,tþ1¼D tþ1
o xtiþ1,ytiþ1
Dt o xti,yti
ð11Þ
And
TCti,tþ1¼ D t
o xtiþ1,ytiþ1
Dtþ1
o xtiþ1,ytiþ1
!
Dt o xti,yti
Dtþ1
o xti,yti
!
" #12
ð12Þ
The MPI, TEC and TC indexes are calculated using DEA. The TEC obtained from Equation 11 is used as a dependent variable in a model for estimating the FDI spillovers on technical efficiency change. The empirical model can be written as
TECti,tþ1¼FDIi,tþgi,tþit ð13Þ
whereanddenote parameter to be estimated,is
random error, and other variables are defined as previous.
IV. Data Sources and Measurement of Variables
Data sources
The main source of data for this study is the annual
survey of Indonesian Medium and Large
Manufacturing Industries (Statistik Industri or SI
hereafter) conducted by the Indonesian Board of
Statistics (Badan Pusat Statistik or hereafter BPS).
The survey covers the basic information of each establishment, such as specific identification code, industrial classification, year of starting production and location. It also covers the ownership informa-tion (domestic and foreign ownerships), producinforma-tion information (gross output, value-added, number of labour in production and nonproduction, value of fixed capital and investment, material, and energy consumption), and other information (share of production exported, value of material imported, and expenditure on research and development). As supplements to the SI data, this study also utilizes the other sources available in Indonesia. The average Wholesale Price Index (WPI) and the WPI for machinery are used as deflators for monetary values of output and capital, respectively.
The samples cover an unbalanced panel of 210 pharmaceutical firms operating in the period of 1990 to 1995 (with 1001 observations). The year of 1990 is chosen as a starting year because it is the first year when the foreign-owned pharmaceutical firms were surveyed. The year of 1995 is used as the last year in order to exclude the period of crisis. From the original data set, this study conducts two adjustments with the intention of obtaining a consistent panel data set. The first adjustment is on the capital data. There are 194 out of 1001 observations (19.28%) reported missing values of capital. This study predicts the missing values using the Vial (2006) methodology, which is explained in more detail in the Appendix.
388
Suyanto and R. Salim
Measurement of variables
Value-added is used as an output variable in this study. Total number of employees (production and nonproduction staffs) is taken as a measurement for labour. As a proxy for capital, this study uses the replacement values of fixed asset. Output values are deflated using the average WPI at a constant price, while capital values are deflated using WPI for machinery.
The key variables in this study are FDI,
FDIHorizontal and FDIBackward. The first variable
(FDI) is a dummy variable of foreign firms. This
variable is assigned one if the share of foreign ownership in a firm is greater than 0% and it is assigned zero if otherwise. The horizontal spillover (FDIHorizontal) variable is to measure the impact of foreign presence on domestic firms in the same market. Following Javorcik (2004) and Blalock and Gertler (2008) the horizontal spillover variable is defined as
FDIHorizontaljt¼
P
i8i2jFDIitYit
P
i8i2jYit
ð14Þ
where Y is gross output, i denotes the i-th firm, j
denotes thej-th industry, andi8i2jindicates a firm
in a given industry. Since there is only one industry
(i.e. ISIC 35222) examined in this study, thejis set to
one. Thus, the value of the FDIHorizontal increases
with the output of foreign firms in the industry.
The backward spillover (FDIBackward) variable is
intended to capture the extent of potential contact between domestic suppliers and multinational com-panies. This variable is defined following Thangavelu and Pattnayak (2006) as
FDIBackwardjt ¼
LRAWMit
P
iFRAWMit
Poutputit
ioutputit ð15Þ
where LRAWMit denotes expenditure incurred in
local material by local firms i at time t, and
P
jFRAWMit denotes total raw material expenditure
of all foreign firms. The FDIBackward variable
indicates the degree of spillovers and linkages that exist from the procurement activities undertaken by the foreign firms to domestic suppliers.
This study includes also age of firm (Age) as a
variable contributing to inefficiency. The Age
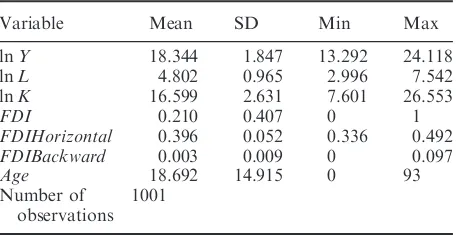
variable is measured by the time period between the year of survey and the year of starting production. The summary statistics of the panel data set for the relevant variables is presented in Table 1. The mean
value of FDIHorizontal shows that, on average, the
percentage of foreign assets in the observed firms is
39.6%. FDIBackward has a mean value of 0.003,
suggesting that 0.3% of the expenditure in raw material is local content. The zero value of the
‘Age’ in the MIN column of the table suggests that
some firms included in this study are just starting at the first year of observation (i.e. 1990). Thus, in 1990
these firms are recorded as having zero value forAge
variable.
V. Estimation and Analysis of Results
The estimates of stochastic frontier with inefficiency effect
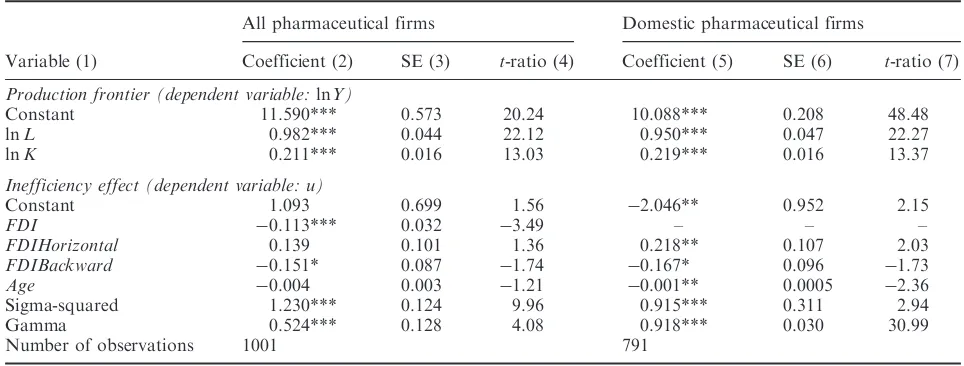
Using the stochastic frontier specified in Equations 3 and 4 this study begins the estimation of FDI spillovers with samples of all pharmaceutical firms. The estimates are presented in Table 2. The upper part of the table shows the estimates of production frontier and the second part presents the estimates of inefficiency function. From the production frontier estimates, the coefficients of labour and capital are positive and statistically significant at the 1% level, suggesting that these two input variables contribute positively and significantly to output. The output elasticity of labour is 0.982 and the output elasticity
of capital is 0.211.8 As the frontier estimated using
Table 1. Summary statistics of relevant variables
Variable Mean SD Min Max lnY 18.344 1.847 13.292 24.118 lnL 4.802 0.965 2.996 7.542 lnK 16.599 2.631 7.601 26.553
FDI 0.210 0.407 0 1
FDIHorizontal 0.396 0.052 0.336 0.492
FDIBackward 0.003 0.009 0 0.097
Age 18.692 14.915 0 93 Number of
observations 1001
Notes: Author’s calculation from the unbalance panel data set using STATA10. The zero value in the minimum value of Age reflects that some firms are just started their operation in the observed year. For example, there are two firms that just started their production in 1990. Therefore, the value of Age variable for these two firms is zero in year 1990.
8
A relatively low output elasticity of capital should be treated with caution, as capital is a key factor in pharmaceutical firms. However, this finding is somehow unsurprising as the share of capital in total industry outputs is relatively low in the Indonesian pharmaceuticals, where the environment is a more labour intensive if compared to pharmaceutical firms in other more developed countries, such as Japan. As argued by Wackeret al. (2006), high elasticity of capital is usually observed in advanced technology industries in developed countries.
FDI spillovers and technical efficiency
389
the Cobb–Douglas production function, the sum of the output elasticity of labour and the output elasticity of capital resulted on the return to scale, which is larger then one, showing the increasing return to scale of the pharmaceutical firms.
In the inefficiency function, the negative sign and
the highly significant FDI estimate indicates that
foreign-owned firms are, on average, less inefficient than domestic firms, keeping other variables con-stant. This finding supports the mainstream argument that foreign firms generally possess more updated knowledge and have more experience in serving the market, so that they are more efficient than domestic firms (Caves, 1974; Dunning, 1988; Kathuria, 2001; Wang, 2010). In previous research using a different methodology, Narjoko and Hill (2007) found foreign ownership to have a positive effect on efficiency. The
coefficient of FDIHorizontal is positive and
statisti-cally insignificant, indicating no significant spillover effects from foreign firms to domestic firms in the same market. This might be because a little learning of domestic competitors from the foreign firms’ presence. Thus, this result validates the hypothesis given by Aitken and Harrison (1999) and is consistent with the findings of Blalock and Gertler (2008). For FDIBackward, the negative and marginally significant of the coefficient suggests the existence of positive spillovers from foreign firms to domestic suppliers. This finding confirms the arguments in Rodriguez-Clare (1996) and the finding of Javorcik (2004), that foreign firms tend to provide new knowledge for their suppliers in relation to a demand for high quality inputs. Furthermore, the
coefficient of Age is negative and insignificant,
indicating no significant difference in technical inefficiency between older and younger firms. As has been long debated in literature, the effect of age on technical efficiency is ambiguous. Arrow (1962) and Malerba (1992) argue for positive relationship between age and efficiency, while Teece (1977) and Winter (1987) state an opposing argument that younger firms tend to have updated knowledge, which make them are more technically efficient than older firms. The evidence of negative relationship between age and technical efficiency is found in Chen
and Tang (1987) and Balcombeet al. (2008), while the
positive relationship is observed in Pitt and Lee (1981) and Salim (2009). Nevertheless, some previous empirical studies have recorded no significant effect of age in Indonesia (Jacob, 2006) and other countries
(e.g.Kathuria, 2001).
There is an argument in the literature that the inclusion of foreign firms in an estimation of FDI spillovers tends to understate the spillover effects that might exist. Considering the argument, this study estimates the samples of only domestic firms in order to examine further FDI spillovers. In this estimation, the foreign firms are excluded, but the spillover
variables (FDIHorizontal and FDIBackward) are
calculated from the original samples. The estimation results are presented in column (5) to (7) of Table 2. Similar to the results for all firms, the coefficients of labour and capital are positive and significant at the 1% level, indicating positive elasticity of labour and capital on output. For the inefficiency function, the
coefficient of FDIHorizontalis positive, but it turns
out to be significantly affecting the technical ineffi-ciency. The exclusion of foreign firms in this
Table 2. Estimates of stochastic production frontiers with inefficiency effect
All pharmaceutical firms Domestic pharmaceutical firms
Variable (1) Coefficient (2) SE (3) t-ratio (4) Coefficient (5) SE (6) t-ratio (7)
Production frontier (dependent variable:lnY)
Constant 11.590*** 0.573 20.24 10.088*** 0.208 48.48 lnL 0.982*** 0.044 22.12 0.950*** 0.047 22.27 lnK 0.211*** 0.016 13.03 0.219*** 0.016 13.37
Inefficiency effect (dependent variable: u)
Constant 1.093 0.699 1.56 2.046** 0.952 2.15
FDI 0.113*** 0.032 3.49 – – –
FDIHorizontal 0.139 0.101 1.36 0.218** 0.107 2.03
FDIBackward 0.151* 0.087 1.74 0.167* 0.096 1.73
Age 0.004 0.003 1.21 0.001** 0.0005 2.36 Sigma-squared 1.230*** 0.124 9.96 0.915*** 0.311 2.94 Gamma 0.524*** 0.128 4.08 0.918*** 0.030 30.99 Number of observations 1001 791
Notes: Author’s estimations on Equations 3 and 4 using FRONTIER4.1.
***, ** and * denote significance at the 1, 5 and 10% levels, respectively.
390
Suyanto and R. Salim
estimation provides evidence of negative horizontal spillovers. As Aitken and Harrison (1999) argue, the competitive effects from a new foreign firm might overshadow the demonstration effects, so that the net spillover effects to domestic firms might be negative. ForFDIBackward, the estimated parameter provides the same conclusion as in the sample of all firms.
The negative sign and statistically significant
FDIBackward estimate suggests positive spillovers from foreign firms to domestic suppliers. Excluding foreign firms in the estimation provides a negative
and statistically significant coefficient of Age, which
indicates that older domestic firms have lower
inefficiencies than younger ones. This finding
supports the argument that firms accumulate their
learning experience and might improve their
efficiency through the learning process (Arrow, 1962; Malerba, 1992) and is consistent with findings in Hill and Kalirajan (1993) for the garment industry. As discussed in the literature review, though there have been a number of studies estimating FDI spillovers on technical efficiency level, they are not directly comparable as they differ not only in the data but also in the methodology. A study that is closer to the present research (Kathuria (2001) for India) also adopts a SPF. However, the stochastic frontier used in testing the spillover hypothesis of Kathuria’s study is a two-stage approach, which has been widely known having limitations that may lead to bias in
estimations (Kumbhakar et al., 1991; Wang and
Schmidt, 2002). In this study, a one-stage approach, as discussed in the estimation methods, is adopted. The one-stage approach overcomes the possible limitations and provides estimates that are efficient and unbiased. Thus, our results differ from those of Kathuria (2001). Kathuria (2001) shows no evidence of horizontal spillovers for the whole manufacturing firms and positive horizontal spillovers for R&D firms, while this study finds negative horizontal spillovers. Another notable difference of this present study to that of Kathuria’s is that this study estimates backward spillovers, which enable estimating FDI spillover effects on domestic suppliers.
The MPIs and estimates for FDI spillovers
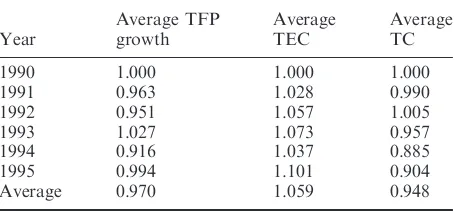
The above estimations focus on FDI spillovers on technical efficiency levels. In this section, the spillover effects are evaluated in relation to changes in technical efficiency. Using the DEA based MPI, as discussed in Section III, the TFP growth is decom-posed into TEC and TC. The calculated TEC is then used as a dependent variable in the estimation of FDI spillovers. This study uses the DEAP2.1 computer
software for running the MPI decomposition.
This software requires balanced panel data for the decomposition. Therefore, the balanced panel set is constructed from the unbalanced panel used in the above estimation. The constructed balanced panel consists of 127 firms (with 762 observations). The average TFP growth and its components (TEC and TC) are given in Table 3 and the estimates of panel data for FDI spillovers are presented in Table 4.
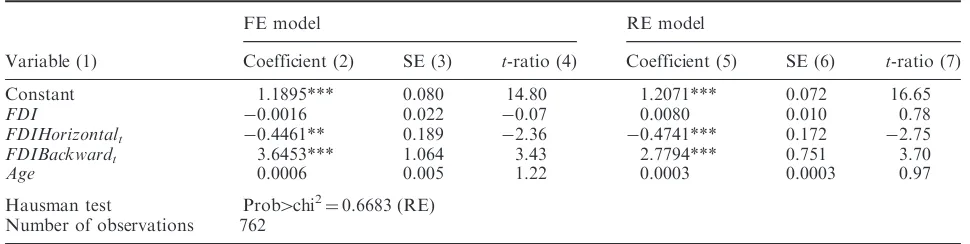
In this section, two panel data models are
estimated. These are Fixed-Effect (FE) and
Random-Effect (RE) models. Estimates of these two models provide similar conclusions regarding the effects of FDI spillovers and age on technical efficiency change. There is a changing sign of the
FDI estimate between FE and RE models.
However, in both models, the estimate is statistically insignificant. In order to test which model
appro-priately represents the data set, a Hausman test is
conducted. The results show that the null hypothesis (of difference in coefficients not systematic) cannot be rejected. It suggests that the RE model appropriately represent the data. Hence, the analysis in this section is based on the RE model.
The results of FDI spillovers on technical efficiency change are consistent to those of FDI spillovers on technical efficiency levels, with a minor difference in the significance of FDI coefficient. The conclusions regarding spillover effects are similar. The positive
and insignificant FDI coefficient indicates no
differ-ence in technical efficiency change between foreign
and domestic firms. The coefficient ofFDIHorizontal
is negative, suggesting that the presence of foreign
firms in year t generates positive spillovers on
technical efficiency change (between yeartand tþ1)
of firms in the same market. As noted in the previous section, the negative horizontal spillovers might be because the competitive effects of foreign firms are large enough to reduce the efficiency of domestic firms through the market stealing phenomenon (Aitken and Harrison, 1999). In other words, the
Table 3. Average TFP growth, TEC and TC of Indonesian pharmaceutical firms
Year
Average TFP growth
Average TEC
Average TC 1990 1.000 1.000 1.000 1991 0.963 1.028 0.990 1992 0.951 1.057 1.005 1993 1.027 1.073 0.957 1994 0.916 1.037 0.885 1995 0.994 1.101 0.904 Average 0.970 1.059 0.948
Note: Author’s calculation from the unbalance panel data set using DEAP2.1.
FDI spillovers and technical efficiency
391
presence of foreign firms in a domestic market reduces the market share of domestic firms, which in turn reduces their efficiency. This finding is in contrast with Ghali and Rezgui (2008) for Tunisia, though the method adopted is the same. A reason for the difference in findings could be a difference in data. As shown by Gorg and Strobl (2001), different data sets and different industrial focus can lead to mixed findings of FDI spillovers. The same argument also presented in Lipsey and Sjoholm (2005).
The positive and significant of the FDIBackward
coefficient indicates spillover effects of foreign firms to the technical efficiency change of domestic suppliers, a finding in keeping with Javorcik (2004) and Blalock and Gertler (2008). This finding indicates the linkages of foreign firms to upstream industries. Thus, the presence of foreign firms in the Indonesian pharmaceutical industry generate higher technical efficiency change for domestic suppliers as these foreign firms tend to demand high quality inputs from and provide knowledge trainings to domestic suppliers.
The Age variable proves to have a positive but
insignificance coefficient, suggesting no significant difference in technical efficiency change between older and younger firms. Similar to the estimate on technical efficiency level, the insignificant estimate of age on technical efficiency change is unsurprising since the relationship between these two factors is still unsettled. Nevertheless, some previous studies that use different method of analysis have shown an insignificant effect of age on technical efficiency change (e.g. Berghall, 2006).
VI. Conclusions and Policy Implications
This article aims to estimate FDI spillovers on technical efficiency levels and technical efficiency
changes of the Indonesian pharmaceutical sector. The SPF and the DEA based MPI are used to the plant-level survey data over the period 1990–1995. The empirical results from the stochastic frontier method show that foreign firms are less inefficient than domestic firms and there are positive spillover effects of FDI on technical efficiencies of domestic suppliers. Therefore, these results support the conventional wisdom of the advanced knowledge of foreign firms. Similarly, the results from the MPI show that
FDI generates negative spillovers to domestic
competitors, but provides positive spillovers to domestic suppliers.
The policy implications of these findings might not provide straightforward support for policies promot-ing FDI in the Indonesian pharmaceutical sector. From the outcomes obtained in the estimations, policy makers might at least need to consider whether the incoming FDI is intended to serve the domestic demands or to benefit from being near to local suppliers. In cases where there is potential for multinationals to ‘steal’ market from domestic firms, policy makers should at least, at the minimum, to ensure that the negative FDI spillovers on domestic firms do not overweight the overall benefits of the FDI. In contrast, when there is potential for multinational companies to source inputs from local suppliers, policy makers should provide incentives to encourage FDI. Furthermore, institutional reforms including political system, economic management and government administration and trade policies are needed in order to develop a more competitive environment in the whole manufacturing sector.
Acknowledgements
The authors would like to thank the participants for useful comments. Comments and suggestions from
Table 4. Estimates of FDI spillovers on the change in technical efficiency (dependent variable:TECt,tþ1)
FE model RE model
Variable (1) Coefficient (2) SE (3) t-ratio (4) Coefficient (5) SE (6) t-ratio (7) Constant 1.1895*** 0.080 14.80 1.2071*** 0.072 16.65
FDI 0.0016 0.022 0.07 0.0080 0.010 0.78
FDIHorizontalt 0.4461** 0.189 2.36 0.4741*** 0.172 2.75
FDIBackwardt 3.6453*** 1.064 3.43 2.7794*** 0.751 3.70
Age 0.0006 0.005 1.22 0.0003 0.0003 0.97 Hausman test Prob4chi2¼0.6683 (RE)
Number of observations 762
Notes: Author’s estimations on Equation 14 using STATA10.
*** and ** denote significance at the 1 and 5% levels, respectively.
392
Suyanto and R. Salim
anonymous reviewers and editor are also highly appreciated. The remaining errors and confusion are the responsibility of the authors.
References
Aitken, B. J. and Harrison, A. E. (1999) Do domestic firms benefit from direct foreign investment? Evidence from Venezuela,American Economic Review,89, 605–18. Arrow, K. J. (1962) The economic implications of learning
by doing,The Review of Economic Studies,29, 155–73. Balcombe, K., Fraser, I., Latruffe, L., Rahman, M. and Smith, L. (2008) An application of the DEA double bootstrap to examine sources of efficiency in Bangladesh rice farming, Applied Economics, 40, 1919–25.
Baltagi, B. H. (2008)Econometric Analysis of Panel Data, 4th edn, John Wiley & Sons, West Sussex.
Bartelsman, E. J. and Doms, M. (2000) Understanding productivity: lessons from longitudinal microdata,
Journal of Economic Literature,38, 569–94.
Battese, G. E. and Coelli, T. J. (1993) A stochastic frontier production function incorporating a model for techni-cal inefficiency effects, Working Paper in Econometrics and Applied Statistics, Department of Economics University of New England.
Battese, G. E. and Coelli, T. J. (1995) A model for technical inefficiency effects in a stochastic frontier production function for panel data, Empirical Economics, 20, 325–32.
Berghall, E. (2006) Technical change, efficiency, firm size and age in R&D intensive sector, GIER Working Paper No. 390, Government Institute for Economic Research.
Blalock, G. and Gertler, P. J. (2008) Welfare gain from foreign direct investment through technology transfer to local suppliers,Journal of International Economics,
74, 402–21.
Blomstrom, M. and Kokko, A. (1998) Multinational corporation and spillovers, Journal of Economic Surveys,12, 247–77.
Caves, R. E. (1974) Multinational firms, competition and productivity in host country markets, Economica,41, 176–93.
Chen, T. J. and Tang, D. P. (1987) Comparing technical efficiency between import-substitution-oriented and export-oriented foreign firms in a developing economy,
Journal of Development Economics,26, 277–89. Chuang, Y. C. and Hsu, P. F. (2004) FDI, trade, and
spillover efficiency: evidence from China’s manufac-turing sector,Applied Economics,36, 1103–15. Coelli, T. J. (1996) A guide to frontier version 4.1: a
computer program for stochastic frontier production and cost function estimation, CEPA Working Paper No. 07/96,University of New England.
Coelli, T. J., Rao, D. S. P., O’Donnell, C. J. and Battese, G. E. (2005)An Introduction to Efficiency and Productivity Analysis, 2nd edn, Springer, New York.
Das, S. (1987) Externalities and technology transfer through multinational corporations, Journal of International Economics,22, 171–82.
Dimelis, S. and Lauri, H. (2002) Foreign direct investment and efficiency benefits: a conditional quartile analysis,
Oxford Economic Papers,54, 449–69.
Dimelis, S. and Lauri, H. (2004) Foreign direct investment and technology spillovers: which firms really benefit?,
Review of World Economics,140, 230–53.
Djankov, S. and Hoekman, B. (2000) Foreign investment and productivity growth in Czech enterprises, World Bank Economic Review,14, 49–64.
Driffield, N. (2001) The impact on domestic productivity of inward investment in the UK,The Manchester School,
69, 103–19.
Dunning, J. (1988) Multinational, Technology and Competitiveness, Allen & Unwin, London.
Fa¨re, R., Grosskopf, S., Norris, M. and Zhang, Z. (1994) Productivity growth, technical progress, and efficiency change in industrialized countries,American Economic Review,84, 66–83.
Fare, R. and Primont, D. (1995)Multi-output Production
and Duality: Theory and Applications, Kluwer
Academic, Boston and Dordrecht.
Farrell, M. J. (1957) The measurement of productive efficiency, Journal of the Royal Statistical Society,
120, 253–90.
Ghali, S. and Rezgui, S. (2008) FDI contribution to technical efficiency in the Tunisian manufacturing sector, ERF Working Paper Series No. 421.
Glass, A. and Saggi, K. (2002) Multinational firms and technology transfer, Scandinavian Journal of Economics,104, 495–514.
Globerman, S. (1979) Foreign direct investment and ‘spillover’ efficiency benefits in Canadian manufactur-ing industries,The Canadian Journal of Economics,12, 42–56.
Gorg, H. and Strobl, E. (2001) Multinational companies and productivity spillovers: a meta-analysis,Economic Journal,111, F723–39.
Gorg, H. and Strobl, E. (2005) Spillovers from foreign firms through worker mobility: an empirical investiga-tion,Scandinavian Journal of Economics,107, 693–739. Greene, W. H. (2008) Econometric Analysis, 6th edn,
Pearson International Publisher, New Jersey.
Haddad, M. and Harrison, A. E. (1993) Are there positive spillovers from foreign direct investment? Evidence from panel data for Morocco,Journal of Development Economics,42, 51–74.
Harding, T. and Javorcik, B. S. (2007) Developing economies and international investors: do investment promotion agencies bring them together?, Policy Research Working Paper No. 4339, World Bank, Washington, DC.
Hatzichronoglou, T. (1997) Revision of the high-technology sector and product classification, STI Working Paper, OECD, Paris.
Hill, H. and Kalirajan, K. (1993) Small enterprises and firm-level technical efficiency in the Indonesian garment industry,Applied Economics,25, 1137–44. Hymer, S. H. (1960) The international operations of
national firms: a study of direct foreign investment, PhD Dissertation, MIT, Cambridge, MA (Published by MIT Press in 1976).
Ikhsan, M. (2007) Total factor productivity growth in Indonesian manufacturing: a stochastic frontier approach,Global Economic Review,36, 321–42. Jacob, J. (2006) International technology spillovers and
manufacturing performance in Indonesia, PhD
FDI spillovers and technical efficiency
393
Dissertation, Technische Universiteit Eindhoven. Available at www.alexandria.tue.nl/extra2/ 200610843.pdf (accessed 6 September 2007).
Javorcik, B. S. (2004) Does foreign direct investment increase the productivity of domestic firms? In search of spillovers through backward linkages, American Economic Review,94, 605–27.
Kathuria, V. (2000) Productivity spillovers from technology transfer to Indian manufacturing firms, Journal of International Development,12, 343–69.
Kathuria, V. (2001) Foreign firms, technology transfer and knowledge spillovers to Indian manufacturing firms: a stochastic frontier analysis, Applied Economics, 33, 625–42.
Konings, J. (2001) The effects of foreign direct investment on domestic firms,Economics of Transition,9, 619–33. Kugler, M. (2006) Spillovers from foreign direct invest-ment: within or between industries?, Journal of Development Economics,80, 444–77.
Kumbhakar, S. C., Ghosh, S. and McGuckin, J. T. (1991) A generalized production frontier approach for estimating determinants of inefficiency in US dairy farms, Journal of Business and Economic Statistics,9, 279–86.
Kumbhakar, S. C. and Lovell, C. A. K. (2000)Stochastic
Frontier Analysis, Cambridge University Press,
Cambridge.
Liang, F. H. (2007) Does foreign direct investment improve the productivities of domestic firms? Technology spillovers within and between industries, Haas Berkeley Working Paper. Available at http://faculty. haas.berkeley.edu/fenliang/research/ spillover/ FDIspillover.pdf (accessed 20 July 2007).
Lipsey, R. E. and Sjoholm, F. (2005) The impact of inward FDI on host countries: why such different answers?,
in Does Foreign Direct Investment Promote
Development? (Eds) T. H. Moran, E. Graham and
M. Blomstrom, Institute for International Economics and Center for Global Development, Washington, DC, pp. 23–43.
Malerba, F. (1992) Learning by firms and incremental technical change,Economic Journal,102, 845–59. Narjoko, D. A. and Hill, H. (2007) Winners and losers
during a deep economic crisis: firm level evidence for Indonesian manufacturing, Asian Economic Journal,
21, 343–68.
Pitt, M. M. and Lee, L.-F. (1981) The measurement and sources of technical inefficiency in the Indonesian weaving industry, Journal of Development Economics,
9, 43–64.
Rodriguez-Clare, A. (1996) Multinationals, linkages, and economic development, American Economic Review,
86, 852–72.
Salim, R. A. (2