APPENDIX 1
3.1 Detail Model of Production and Export Value Chains in the Furniture Sector
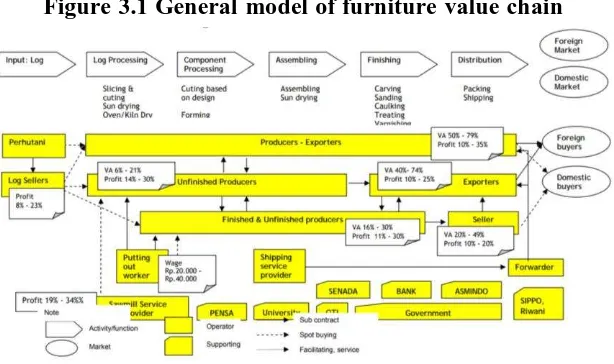
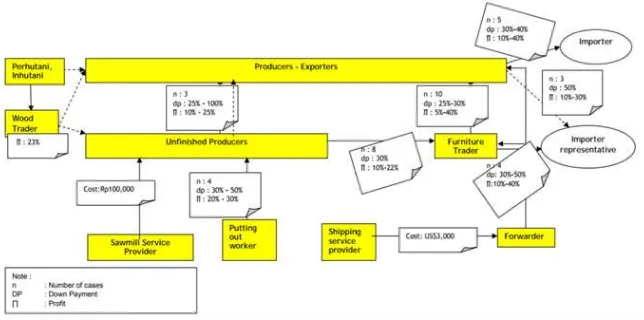
A general model of wood furniture value chain (VC) is
shown in a value chain map (Figure 3.1). The model describes
the chain of business activities (functions), actors who are
handling activities, interaction among actors, and value
distribution along the chain. There are three possible chains
that were found in this research. The first chain is VC of integrated producers-exporters of wooden furniture, in which a
firm is doing all activities in producing and exporting product.
Therefore, the VC consists of one layer of production and
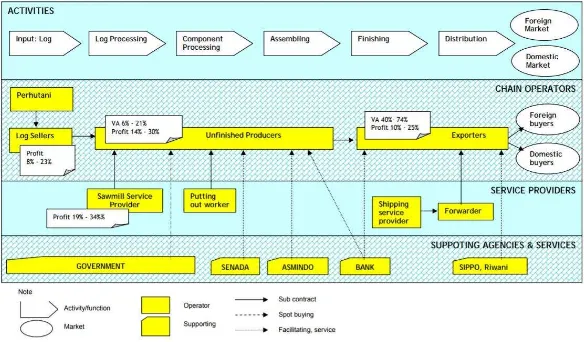
export activities (see Figure 3.2). The second one is VC of
layers producers-exporters of wooden furniture, in which
activities in producing of unfinished products are separated
from activities in finishing and exporting products (see Figure
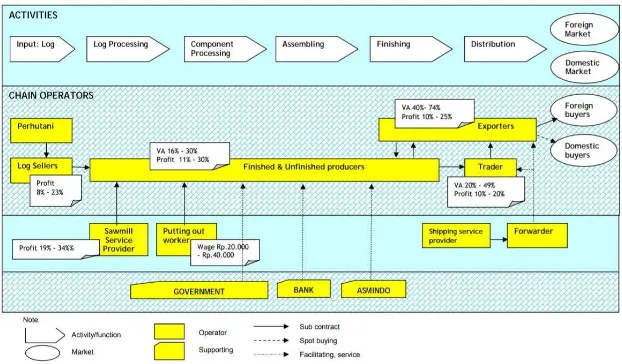
3.3). The last one is VC of indirect and direct export of wooden
furniture, in which producers are producing finished product
for exporters who directly export the product and or for local
traders who indirectly export the product (see Figure 3.4).
Compared to year 2006, current wood furniture value chain (2008) is shorter. There are three layers of sub
contracting involve in furniture value chain in 2006, but now
only a single layer. Most of the third and second layers sub
contractor is micro to small scale business, which work jointly
third and second layers sub contractors disappear in the chain.
Contract worker is not applied any more in Jepara, but still
exists in Klaten. Exporters tend to internalize production
process of high end product in order to maintain the quality
and reduce risk of delivery time. Other reason to internalize
the production process is by decreasing order since September
2008, when the global crises begin.
Figure 3.2 Value chain of integrated producers-exporters of wood furniture
Figure 3.4 Value chain of three layers producers-exporters of wood furniture
3.1.1 The Relevant Actors in the Value Chain
The relevancy of actors is determined by the involvement in
the chain functions. We can divide three level furniture chains:
(1) The micro level of a value chain contains customers/buyers
and main actors (operator) that contribute directly to the
production and distribution process.
(2) The meso level of a value chain contains related industry/service
providers that indirectly contribute to the furniture business
activities.
(3) The macro level of a value chain includes stakeholders
that give influence to the climate of the furniture business.
Based on the detail model of wooden furniture VC
meso and macro level actors. The Table 3.1.1 and 4.2 also
describe the characteristics of micro and macro level actors.
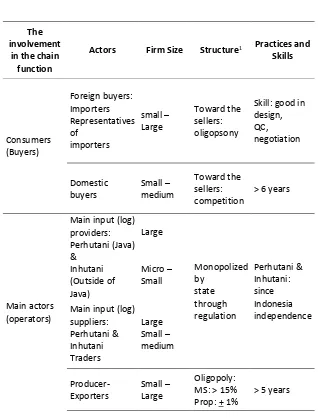
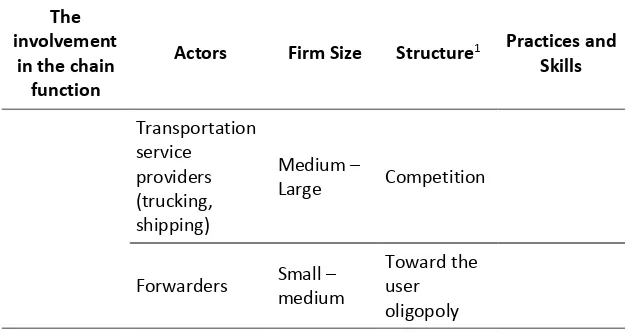
Table 3.1.1 Relevant actors in micro level of wooden furniture VC
The involvement
in the chain function
The involvement
in the chain function
The involvement
in the chain function
Actors Firm Size Structure1 Practices and Skills
Forwarders Small – medium
Toward the user oligopoly
Table 3.1.2 Relevant actors in meso and macro level of wooden furniture VC
The involvement in
the chain function
Actors Firm Size Most services used
Promotion services: Riwani Global Enterprises
Medium Toward the user oligopsony (1)Technical skill: PIKA
BDS: Detro Jepara, Small Accounting and Tax consultant
Technical support agency:
Technical Services Unit of Department of Industrial and Trade Jepara and Klaten
Small
Influencer (through its policies)
Government: Local and Central government, Perhutani, NGO
-
3.1.2 Characteristic of the Actors
The furniture sub sector in Central Java in 2007
consisted of a 89.723 units established, 998.756 laborers, a
production value of Rp.294.224.730.000,- and an export value
of US$424,161,733 (Dept. of Industry and Trade Central Java,
2008). In Yogyakarta in 2007, there were 3,771 units established and 23,765 laborers and an export value of
US$138.47 (Dept. of Industry and Trade Central Java, 2008).
Based on available data, Indonesian furniture export
value are increase from 2000 to 2007, but in Central Java is
fluctuated (Table 3.1.3). Number of large and medium firms is
decrease form 2000 to 2005, but number of workers is
fluctuated. It is estimated that the number of firms and the
number of workers are decrease faster until 2009 due to
Table 3.1.3 Export value of Indonesia and Central Java, and the number of firms and workers in Central Java
Export value
(in million US$) Central Java Yogyakarta3)
Year Indonesia
2007 1,101 424.16 (89.723 )(998.756 )(3.771) (23.765)
Source:
1) The United Nations Statistics Division (2008). 2) The Central Java Industrial and Trade Office ( 2008) 3) The Central Java Industrial and Trade Office ( 2008) 4) Annual Manufacturing Survey (BPS 2006)
This section concerns on the market structure, practice
and skills, of the main actors in micro and meso level. The
macro-level actors (supporting agencies and services) will be
discussed in Appendix 3.
There are three types of relationship/interaction among
actors in micro level of a value chain (see Figure 3.1):
(1) Selling-buying (spot buying) interaction: between input
(log) supplier/provider with furniture producers, and between
exporters as well as traders with domestic buyers, also
(2) Commercial sub contracting relationship: between exporters
with producers, and among producers.
(3) Industrial sub contracting relationship: between producers
with contract workers, which is the workers who produce
furniture components from wood that provided by producers.
The types of relationship in meso level of a value chain are:
(1) Customer relationship: such as debtor - creditor relationship
between furniture operator with Bank, client-service
provider between exporters with forwarders and
forwarders and shipping service providers.
(2) Membership of association/cooperatives: such as ASMINDO
Concerning with firm size and the relation with market
structure, practice and skills, Table 3.1.1 shows that:
In the output market, foreign buyers have a strong bargaining position, because of high experience and
expertise.
According to Indonesian regulation, an exporter of wood products (including furniture) should also producer,
so-called producer-exporter. The main objective is to restrict
timber products trading and to prevent illegal logging. Export license (EPTIK) is an instrument of the regulation.
In fact, violations still occur, in which non
producer-exporter can export furniture. Therefore, the third model of
VC (Figure 3.4) is present.
Large companies are mostly easier to access raw materials
from Perhutani, while SMEs are mostly buying from wood
trader without administration.
In general, small and medium producers use a mixture of production technology: manual and mechanical. The activities
are ranging from wood work, making components, shaping
up into components and goods in process (unfinished
product). About 90% furniture firms are unfinished producers
90% and mostly micro - small scale with market share less
than 2%, so the structure is atomistic. Several
small-medium firms (the proportion 9%) have 2-8% market
share, produce finished product for local traders and
exporters. Experience of SMEs more than seven years, but
not enough skill to maintain process and product quality as
well as speed of work consistently.
Contract workers are processing raw materials taken from the company in their own workplace and using their own tools/machine. The experiences of contract workers are at
least 3 years, but similar with producers, they did not
enough skill to maintain the process and product quality as
well as the speed of work consistently.
Timber sawmill is a specific purpose machine for cutting and slicing the log. Sawmill service providers grow in-line
with that of the cluster’s. Investment value of sawmill is
relatively high with low utilization rate, so it will be more
efficient if the SME producers outsource to service
provider. Sawmill service providers in Jepara and Klaten
is relatively good. Cost of the services is Rp.100.000, -/m3
log.
Forwarder is services on handling process of export administration and shipment.
Forwarder is outsourcing shipment process to transportation
service provider. Market structure of forwarder service
providing is oligopoly, so the price is relatively high (about
US$3,000 to USA and US$2,000 to EU, comparing to export
value is about 5% of outdoor or 2,5% of indoor furniture).
3.1.3 The Key Regulatory and Coordinating Agencies in the Sector
The key regulatory agencies in the sector
On the macro level of the chain, government (especially Department of Forestry, Industry and Trade) is the key
regulatory agency of input market for wooden furniture sector.
ASMINDO is the counterpart of regulatory agencies to get
input, justify and disseminate the regulation. There are several
related institutions to govern timber production and distribution,
namely: Department of Forestry at the central level, Perhutani
and Inhutani, District Government and Police. ASMINDO is
coordinating the Wooden furniture industry in responding
government policy.
The key coordinating agencies in the sector
On micro level of the chain, SMEs of furniture sector
furniture clusters are export oriented. Competition and cooperation
within the furniture clusters are coordinated by the actors who
have strong market power (Sulandjari, 2008; Porter, 1998).
Market power throughout upstream furniture VC is mastered
by foreign buyer (importer), while throughout downstream is
mastered by is exporter who directly related to importer
(Figure 3.1, Table 3.1.1). So, importer and exporter are the
coordinating agencies in the sector.
Focus on downstream furniture VC, exporter has to
translate the design of product (desired by importer) into
production activities, and then coordinate production and distribution activities in the company. When exporter outsource
all/parts of production activities, then he/she has to coordinate
joint production activities through “cooperation” with the raw
materials (wood) producers/traders, putting out worker, service
providers, finished/unfinished producers, and/or other relevant
actors.
3.1.4 The Value Added Along the Chain
Figure 3.1 and 4.2 shows that exporters, especially who
produce high end furniture product from log (in-wall processing) and/or produce own design product, are creating
highest value added (79%) and also profit (35%). The lowest
value added (6%) is created by unfinished product producers
(Figure 3.1 and 4.3). High end and/or own design product for
export market create 80% value added, while low end furniture
creates value added almost one and half higher than low end
market.
Most of medium and large direct exporters are
producing high end product (78% of total export value),
while small direct exporters and indirect exporters are produce
low end product (22% of total export value). Indirect exporters
are SMEs with lower levels of technology and managerial
skill, but by producing finished products they create value
added up to 31%. Most of medium and large direct exporters
produce high end product (78% of total export value), while
small direct exporters and indirect exporters produce low end product (22% of total export value). Indirect exporters are
SMEs with lower level of technology and managerial skill, but
by producing finished product they create value added until
31% (Figure 3.1 and 4.4).
According to distribution of value added, exporters are
the relevant operators in creating value added. This finding
supports the above statement that exporters are the key
coordinating agencies in the sector. Value added are not only
created by accessing the end market with own design, but also
by serving high quality and fast delivery product to appropriate
segment. According to distribution of profit, exporters and
sawmill service providers are the relevant operators. Small number of sawmill service providers serve lots of number of
small enterprises; one sawmill have to serve 32 enterprises in
furniture cluster in Klaten as well as in Jepara2. Market power
in the hand of oligopolies (sawmill providers) and oligopsonies
create high profit.
Value of the chain depends on with whom the operator
interact. There are several alternatives of interaction throughout
the chain (Figure 3.5).
Figure 3.5 Value interaction a long the chain of wood furniture
Figure 3.5 shows that:
Direct interaction with Importer (in foreign country) is more profitable (profit up to 40%) for producer-exporter
than with importer representatives in Indonesia (profit up
to 30%). Yet, down payment from importer representative
is larger than importer (maximum 40% compare with 50%).
Furniture traders prefer to interact with importer represent-tatives than with producer- exporter, because the down
payment is larger (up to 50% compare with 30%) and more
opportunity to access importer representatives is more
limited than opportunity to access producer-exporter. Unfinished producers prefer to interact with
producer-exporter than with furniture traders, when they get higher
down payment and profit. Producer-exporter will pay 100%
unfinished product when the type of interaction is spot
buying, but will pay about 25% down payment when the
type of interaction is sub contracting. Spot buying
interaction with producer-exporter is more profitable than
sub contracting interaction, but less sustainable.
Currently, there is no alternative interaction for contract workers and sawmill service providers, unless with
unfinished/finished producers. Producer-exporters use their
own timber sawmills and internalizes whole production or
finishing process.
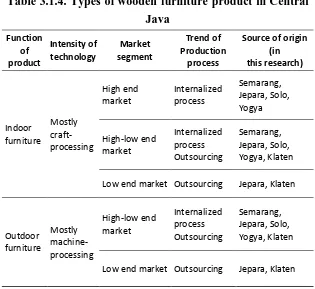
3.1.5 The Main Factor/Players Driving in the Sector
From above analysis, it can be concluded that there are
three important factors that encourage the growth of furniture
sector. First, the most profitable product of furniture sector is
indoor furniture for high end market segment. Indoor furniture is a
type of product based on functional characteristic that bring on
the consequences of technology intensity and various market
Table 3.1.4. Types of wooden furniture product in Central
Low end market Outsourcing Jepara, Klaten
Outdoor
Low end market Outsourcing Jepara, Klaten
Main activities of indoor and outdoor furniture production
are basically similar (Figure 3.1). Start with log processing.
SMEs producers use sawmill service provider to cut and slice
logs and use their own traditional oven or sun rise for drying the
wood. Component processing is a crucial step related to product
of wood and process are not good enough. Choosing the high
end market requires sophisticated management operations/
production and distribution. It is a critical decision.
The second factor is product design. Exporter with
own product design could create the highest value added.
Investment on product/design development should be accompanied
with a marketing strategy at least for medium term, in order to
introduce new (design) products up to commercial stages.
As a coordinating agency toward downstream, exporters
are the main drivers in the sector. Exporter is the only operator
who directly access foreign market. In the micro level, exporter becomes the most important actor because they are the market
intelligent with potential capability to catch market information
especially on market trend, design, buyer demand on standard
as well as specification, and competitors. In fact, many
Indonesian exporters did not have enough market intelligent
capability, so that there is a lack of international market
information. Exporters with lack of international market
information will be uncompetitive because of strongly dependent on
a specific buyer. Furthermore, exporter has to be able to
translate buyers/customers demand into physical design of
product, production process as well as wood procurement.
However, many Indonesian exporters did not have good capability on designing. The lack capability on designing will
be a handicap to access market, and the problem of copying
(patent) will be serious in the future. As market coordinators
toward the downstream, exporters have to manage suppliers
and sub contractors to perform low cost and high quality as
3.1.6 The Most Critical Constraints SME Must Overcome to Take an Advantage of
Export Opportunities
In order to get access to the high end market, the most a
critical factor that needs to be addressed is the management of
operations/production. Constraints in the fields of management
and operations can be traced with internal efficiency measures.
Internal efficiency is an indicator of performance operation / production process. Internal efficiency is attained by excellent
management within the firm (Shepherd, 1985:18). Furthermore,
Shepherd explains that criteria of internal efficiency are
keeping costs down to the “minimum” level, until absence of
excess cost. It is difficult to attain efficiency as well as to
measure it due to multi aspects that should be taken into
account. Nevertheless, concept of internal efficiency is
important to provide a fairly reliable guide to trace common
problems which often raises cost, reducing quality and
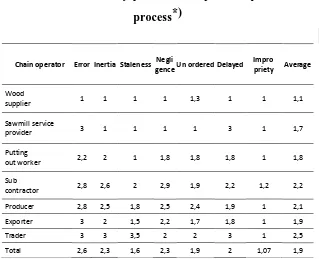
postponing delivery. There are seven important problems in area of operation/production process that caused excess cost:
Table 3.1.5 Inefficiency problems of operation/production process*)
Chain operator ErrorInertia Staleness Negli
genceUn orderedDelayed Impro
priety Average
Wood
supplier 1 1 1 1 1,3 1 1 1,1
Sawmill service
provider 3 1 1 1 1 3 1 1,7
Putting
out worker 2,2 2 1 1,8 1,8 1,8 1 1,8
Sub
contractor 2,8 2,6 2 2,9 1,9 2,2 1,2 2,2
Producer 2,8 2,5 1,8 2,5 2,4 1,9 1 2,1
Exporter 3 2 1,5 2,2 1,7 1,8 1 1,9
Trader 3 3 3,5 2 2 3 1 2,5
Total 2,6 2,3 1,6 2,3 1,9 2 1,07 1,9
*) score 1 = never occur, 2 = seldom: once a week, 3 = 3 times a week, 4 = once a day, 5 = almost continually occur.
Table 3.1.5 shows that performance of operation/production
process a long the chain is inefficient, because at least six of
seven problems occur once a week. It means that manager will
face a daily problem in operation/production process. Error,
inertia and negligence in operation/production process are
problem with highest intensity, almost three times a week
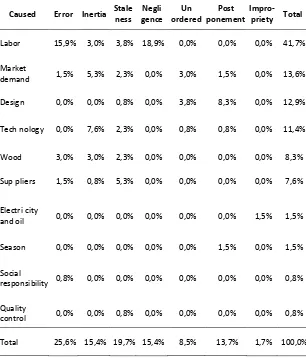
(score 2,3 – 2,6). Human factor is the main source of
performance problems in operation/production process, especially
error and negligence (Table 3.1.6). In the second place,
fluctuation of demand is the source of each problem except
highly depend on specific buyer in certain country, so that the
managers are willing to maintain status quo in operation/
production process and tending to be resistant to follow market
changes. Design is the third source of problem in operation/
production process, especially in delayed problem. Design
problem is related to the ability in design engineering and
ability to translate Figure/photos into technical drawing. While
technology, in the fourth place, is the main source of inertia in
operation/production process. Most of SMEs didn’t care about
information of technology (technoware) as well as about
upgrading technology. Lastly, wood (raw materials) and suppliers (including sub contractors) are main source of the
problems of error, inertia and staleness. Human resource
management, marketing, designing, technology, raw material
(wood) and supplier management should become area of
intervention to solve inefficiency problems of operation/production
Table 3.1.6 Source of inefficiency problems of operation/production process
Caused Error Inertia Stale ness
Negli gence
Un ordered
Post ponement
Impro- priety Total
Labor 15,9% 3,0% 3,8% 18,9% 0,0% 0,0% 0,0% 41,7%
Market
demand 1,5% 5,3% 2,3% 0,0% 3,0% 1,5% 0,0% 13,6%
Design 0,0% 0,0% 0,8% 0,0% 3,8% 8,3% 0,0% 12,9%
Tech nology 0,0% 7,6% 2,3% 0,0% 0,8% 0,8% 0,0% 11,4%
Wood 3,0% 3,0% 2,3% 0,0% 0,0% 0,0% 0,0% 8,3%
Sup pliers 1,5% 0,8% 5,3% 0,0% 0,0% 0,0% 0,0% 7,6%
Electri city
and oil 0,0% 0,0% 0,0% 0,0% 0,0% 0,0% 1,5% 1,5%
Season 0,0% 0,0% 0,0% 0,0% 0,0% 1,5% 0,0% 1,5%
Social
responsibility 0,8% 0,0% 0,0% 0,0% 0,0% 0,0% 0,0% 0,8%
Quality
control 0,0% 0,0% 0,8% 0,0% 0,0% 0,0% 0,0% 0,8%
Total 25,6% 15,4% 19,7% 15,4% 8,5% 13,7% 1,7% 100,0%
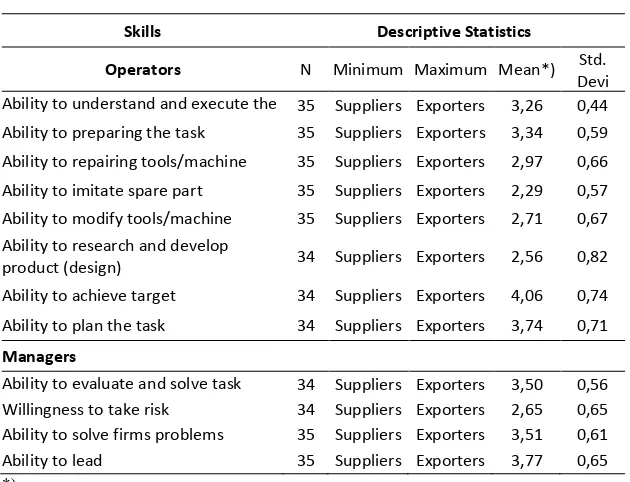
Quality of human resource
Table 3.1.7 shows performance characteristics of human
resource (operators and managers) in the sample companies,
on business services. Basically, human resource performance
and company commitments of exporters are higher than
suppliers; such as sub contractors, contract workers and service
providers. Operator skills on task are fair average, but
technological skills are poor, while ability to achieve target is
relatively high. Managerial skills of the managers are fair
average, but willingness to take risk, especially risk on
investment in product development (including design). Companies
(managers) are committed to fulfill customers’ satisfaction, also
committed to have good cooperation with business partners and
to comply rules and regulations.
Table 3.1.7 Skills of human resources
Skills Descriptive Statistics
Operators N Minimum Maximum Mean*) Std.
Devi ation Ability to understand and execute the
task
35 Suppliers Exporters 3,26 0,44 Ability to preparing the task 35 Suppliers Exporters 3,34 0,59 Ability to repairing tools/machine 35 Suppliers Exporters 2,97 0,66 Ability to imitate spare part 35 Suppliers Exporters 2,29 0,57 Ability to modify tools/machine 35 Suppliers Exporters 2,71 0,67 Ability to research and develop
product (design) 34 Suppliers Exporters 2,56 0,82 Ability to achieve target 34 Suppliers Exporters 4,06 0,74 Ability to plan the task 34 Suppliers Exporters 3,74 0,71 Managers
Ability to evaluate and solve task problems
34 Suppliers Exporters 3,50 0,56 Willingness to take risk 34 Suppliers Exporters 2,65 0,65 Ability to solve firms problems 35 Suppliers Exporters 3,51 0,61 Ability to lead 35 Suppliers Exporters 3,77 0,65
Table 3.1.8 Commitment of company on human resource development
Commitment
Descriptive Statistics
N Minimum Maximum Mean*) td. Deviation Commitment to fulfill labor
satisfaction 37 Suppliers Exporters 4,11 0,84 Commitment to create
conducive environment for
human resource development 37
Suppliers Exporters 2,62 0,76
Commitment to improve
productivity 36 Suppliers Exporters 3,31 1,41 Commitment to fulfill
customers satisfaction 37 Suppliers Exporters 4,81 0,46 Commitment to cooperation
with business partners 37 Suppliers Exporters 4,81 0,46 Commitment to comply rules
and regulations 34 Suppliers Exporters 4,76 0,50
*) Score 1 (very poor) to 5 (very high)
Table 3.1.7 shows that there is a gap between the
operator ability to handle the tasks and equipment used (low)
with the ambition to meet the production target (high). Such
kind of gap is associated with the high error in operation/production
process (Table 3.1.5) and become a major cause of low
quality products. Problems of product quality become more serious due to inertia, staleness and negligence in the
operation/production process, where human resources contribute the
largest share in the occurrence of the events. Quality control
becomes increasingly difficult and expensive if the production
activities are outsourcing, because of the performance of
contractors are lower. In that condition, company commitment
to fulfill customers’ satisfaction (Table 3.1.8) will be difficult
to attain.
Company commitments are not easy to be satisfied when
the commitments of suppliers are not in line or in the same
level. Exporters Commitment to increase productivity is higher
than the sub contractors and suppliers. The gap of commitment
to improve productivity causes delivery problems. Furthermore, the
quality and delivery problems cause to difficulties to meet the
commitment to establish good relationships with business
partners and meet commitment to customer satisfaction.
Company commitment is also difficult to realize without any
strong support from company human resources. The strength of
support of human resources depends on the ability of operators
as well as managers. In addition, it also depends on the balance
between commitments to affiliate with both the workers and
to improve the skills of workers. The company can claim
workers to increase productivity when meet workers satisfaction.
Research findings indicate that the company's commitment to
meet the physical needs (salaries and wages) of workers is
high, but the commitment to establish good relations (affiliate),
to improve the skills and to improve conducive situation for
workers are also lower. Human not only needs physical thing, so the gap treatment of labor cause to inertia and negligence