Land Capability for Cattle-Farming in the Merapi Volcanic Slope of Sleman
Regency Yogyakarta
Rini Widiati, Naiatul Umami, and Totok Gunawan
Received: 22 12 2016 / Accepted: 07 04 2017 / Published online: 30 06 2017 © 2017 Faculty of Geography UGM and he Indonesian Geographers Association
Abstract his research carried out to study the cattle farming development based on the land capability in rural areas of the Merapi Volcanic slope of Sleman Regency Yogyakarta ater eruption 2010. Samples taken were Glagaharjo village (Cangkringan Sub-District) as impacted area and Wonokerto village (Turi Sub-District) as unimpacted area. Survey method used were to land evaluation analysis supported by Geographic Information System (GIS) sotware. Materials used were Indonesian topographical basemap (RBI) in 1:25000 scale, IKONOS image [2015], land use map, landform map, and slope map as supple- ments. Potential analysis of land capability for cattle forage using the production unit in kg of TDN per AU. he result showed that based on the land capability class map, both villages had potential of carrying capacity for forage feed that could still be increased as much as 1,661.32 AU in Glagaharjo and 1,948.13 AU in Wonokerto.
Abstrak Penelitian ini bertujuan untuk mengkaji pengembangan peternakan sapi potong berdasarkan kemampuan lahan
di daerah perdesaan lereng selatan Gunungapi Merapi Kabupaten Sleman Yogyakarta setelah erupsi 2010. Desa sampel adalah desa Glagaharjo (Kecamatan Cangkringan) sebagai daerah terkena dampak dan Wonokerto (Kecamatan Turi) tidak terdampak. Metode survei digunakan untuk analisis evaluasi lahan dibantu dengan perangkat lunak Sistem Infor- masi Geograis (SIG). Bahan yang digunakan meliputi peta RBI skala 1:25 000 , citra IKONOS (2015), peta penggunaan lahan, peta bentuklahan, dan peta kemiringan lereng sebagai pendukung. Analisis potensi kemampuan lahan untuk hi- jauan pakan sapi menggunakan unit produksi kg TDN per ST. Hasil penelitian menunjukkan bahwa berdasarkan peta kelas kemampuan lahan, kedua desa memiliki potensi daya dukung pakan hijauan yang masih dapat ditingkatkan untuk pengembangan sapi sebesar 1,661.32 ST di Glagaharjo dan 1,948.13 ST di Wonokerto.
Keywords: carrying capacity, cattle farming, forages, land capability.
Kata kunci: daya dukung ,peternakan sapi potong, pakan hijauan, kemampuan lahan
1.Introduction
he development of beef cattle in the rural areas were very depended on the availability of natural resources, especially land as a producer of forage. Even in rural areas today, there were conlict interests between agricultural land use for food crops and forages which have been resulted in deceasing production of beef cattle. Cattle farming was one of the important role in livelihood for rural communities, although, the sustainability was still questionable since there were limited inancial and human resources. Widiati [2012] and Verschelde et al., [2013] stated that in the rural areas, farmers keep livestock as a living bank which
could be sold at any time to meet the family needs in the time of inancial constraints. Ndoro [2014] explained that in rural South Africa, the sustainability of cattle based livelihoods were threatened by competition for natural resources, such as land and water. However, it was believed that animals were kept by smallholder farmers to eliminate poverty, especially in the poor and developing countries [Lloyd et al., 2014].
On the other side, cattle production in the form of meat was important for national food sovereignty and fulilling the nutrition needs of the people, because it contains high animal proteins. However, beef consumption per capita per year of Indonesian people in 2015 was the lowest which was less than 2 kg, compared with China (3.8 kg), Malaysia (4.3 kg), Philippines (3 kg), hailand (2 kg), and Vietnam (9.8 kg) [Department of Food and Agriculture, 2016]. In addition, in the last ive years, imported beef was still accounted of more than 30% [Widiati, 2014]. his was because 95% of cattle in Indonesia were kept by rural people as an integrated farming system that have many constraints [CBS, 2013]. Furthermore, Indonesian farmers, especially in Java Island, had narrow agricultural land below 0.5 ha and it even got smaller in the densed
Rini Widiati
Department of Livestock Socio E
conomics, Faculty of Animal Science, Universitas Gadjah Mada, Indonesia.
Naiatul Umami
Forage and Pasture Science Laboratory, Faculty of Animal Science, Universitas Gadjah Mada, Indonesia.
Totok Gunawan
Department of Geographic Information Sciences, Faculty of Geography, Universitas Gadjah Mada, Indonesia
Correspondent email: [email protected]
population areas like Yogyakarta Special Region. hese factors had made most Indonesian farmers were only smallholder farmers. However, they had contributed substantially to the total agricultural production and total employment. To increase theirincome, farmers in developing countries were including in Indonesia usually kept a few cattle [Widiati,2006; Ryschawy, 2012; Ntale,2013].
In relation to the development of cattle, land resources suitable for forage crops were the main factors that should be prepared to ensure the capability to maintain the carrying capacity for feed. Feed was a very important factor in the animal production and reproduction. he main feed of ruminant was forages. Both quality and quantity of them should be suicient to get the nutrient rrequirements, this become the determinant factors in the ruminant productivity. However, in tropical regions such asYogyakarta Special Region Indonesia, it seems diicult to provide high quality food crops and forages in suicient quantities through out the year [Harini, et al. ,2015].
Forage for cattle could be derived from the grass courts, superior grass, cultivated legume crops, as well as by-products of food crops. Legume plants and grass could be cultivated on marginal lands unsuitable for food crops development, such as paddy ield [Hardjowigeno and Widiatmaka, 2007, Widiatmaka et al.,2014]. herefore, it was necessary to ind a certain of land which not suitable for food crops but suitable to forage feed in consideration to plan how many cattle could be raised in a certain region.
Ssouthern parts of Merapi volcanic slope had a unique ecosystem that was suitable for various type of grasses and legume crops which was also endemic plants, such as, acasia decurrens, calliandra calothyrsus, and many other local crops suitable for cattle [Gunawan, 2012, 2016]. Ecologically, the existing biodiversity in Merapi volcano ecosystem had great for the development of cattle. Unfortunately, the condition had changed since the eruption of Merapi volcano in 2010. he eruption had caused great lost of habitat of several plants and animals species, land cover and / or land use changes as a result of lahar deposition by rainfall. herefore, major aime of this study was to answer the question how the development of cattle in the southern part of Merapi volcanic slope using land capability approach with existing constraints in land resources.
he potential availability of fodder in Cangkringan Sub District as impacted areas and Turi Sub District as non-impacted areas could be contributed as an empirical information for government and stakeholders to create a holistic plan of the cattle development.
2.he Methods
Landform of Cangkringan and Turi Sub Districts in upper slope of Merapi volcano, Sleman Regency were evaluated through land capability approach for
mapping of food crops and forage feeds. In this case, an interest research areas, Glagaharjo and Wonokerto villages were taken as sampling areas. Indonesian Topographical basemap (RBI) of Kaliurang (1408-244) and Pakem (1408-242) 1:25 000 scale, land use map, landform map, slope map, and IKONOS imagery (2015) were used as data source of crops and forages. Parameters of land characteristics were obtained from ield survey. Iinterpretation of agricultural land use data were extracted from IKONOS imagery (2015) using Envi 4.8 sotware.
Land capability analysis were done using LCLP sotware (Land Classiication and Land Use Planning) which would match among certain crop requirements criterion, in this case for both food crops and forages. And then, cclassiication assessment of land capability based on the land unit were composed by landform map, slope map, and land use map using Mapinfo 12 sotware.
he result of the land capability evaluation on each of land unit used to describe the spatial distribution of carrying capacity for cattle farming development, in both villages. Capacity analysis in the ield was using the concept of carrying capacity as issued by the Directorate General of Animal Husbandry [2000]. In calculating the carrying capacity, two approaches were used namely the Actual Carrying Capacity (ACC) and the Potential Carrying Capacity (PCC). he ACC was the value of land capability in a region to produce forage feeds commonly consumed by livestock in the region, divided into two parts: (1) the carrying capacity of natural grass and bush shrubs (CCN), the ability of region to produce natural forage in the fresh or dry form without any treatment, and (2) the carrying capacity of potential of agricultural wastes, grasses and legume superior cultivated (CCC).
Meanwhile, secondary data from several references is done to identify the chemical composition, namely chemical composition for Dry Matter (DM) and Total Digestible Nutrient (TDN) for cattle.
Representative samples of all forages in each group were collected in Herbarium method and taken to laboratory for identiication of classiication. Unit of feed availability was using Total Digestible Nutrition (TDN) of cattle for each type of crop based on the Table of feedstufs composition [Hartadi et al., 2005], and then being compared to the number of requirements per unit of cattle (Animal Unit/AU) according to the National Research Council / NRC [1996].
he potential of carrying capacity (PCC) in an area could be formulated as follows:
of carrying capacity for cattle could be formulated as follow:
PCC for Beef cattle = PCC - number of AU for other ruminants
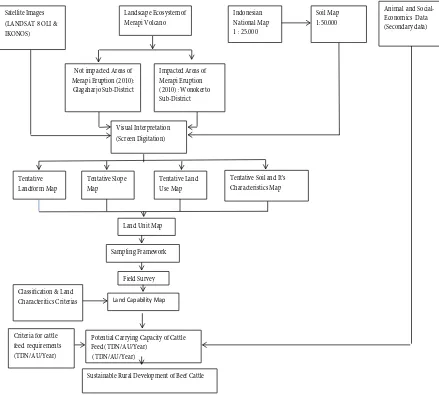
Flow chart of cattle development based on the land capability approach was illustrated in Figure 1.
3.Result and Discussion
Land use and vegetation related to food crops and forages availability ater Merapi Volcano Eruption in 2010. he environmental degradation in bio-geophysical aspects were indicated by the landscape ecosystem and biodiversity changes, so when the potential land was not preserved, it would impact the socio cultural aspects in crops and livestocks integration. here were three signiicant negative impacts, namely (1) loss of vegetation and destruction of land cover, so that lahar low could not be protected and forages availability would be decreased; (2) decreasing stream low and spring discharges that lead to shortage of freshwater
supply; and (3) decreasing the depth of water table and availability of ground water supply which could also lead to shortage of freshwater supply for cattle and the inhabitants.
Field survey result showed that in Glagaharjo Village as impacted areas, mixed garden and dry ield appeared as the dominant land cover/land use, although it had low soil fertility and a little combination with forages. A type and size of land use in Glagaharjo Village which had been extracted from IKONOS images (year 2015) and ield checking on November 2016 could be calculated as follow: (1) dry land: 283.37 hectares (33.89%), (2) mixed garden: 347.81 hectares (41.60%), (3) rural settlement: 117.94 hectares (14.11%), (4) grasses: 86.93 hectares (10.40%). During 6 years ater eruption (2010-2016), there have been spreading land development, dominated by mixed garden (41.60%) and dry land (33.89%). Furthermore it was also combined with a little grassland (10.40%).
On the other side, the result of extracted landcover in Wonokerto village as an unimpacted areas were as
Figure 1. Flow chart of cattle development based on the land capability approach
Satellite Images (LANDSAT 8 OLI & IKONOS)
Landscape Ecosystem of Merapi Volcano
Not impacted Areas of Merapi Eruption (2010): Glagaharjo Sub-District
Impacted Areas of Merapi Eruption (2010) : Wonokerto Sub-District
Indonesian National Map 1 : 25.000
Soil Map 1:50.000
Animal and Social-Economics Data (Secondary data)
Visual Interpretation (Screen Digitation)
Tentative Land Use Map
Tentative Soil and It’s Characteristics Map Tentative Slope
Map Tentative
Landform Map
Land Unit Map
Sampling Framework
Field Survey
Potential Carrying Capacity of Cattle Feed (TDN/AU/Year)
(TDN/AU/Year) Criteria for cattle
feed requirements (TDN/AU/Year)
Sustainable Rural Development of Beef Cattle
Land Capability Map
following, (1) dry land: 476.39 hectares (29.41%), (2) mixed garden: 371.40 hectares (22.93%), (3) wet land paddy and salak tree: 331.29 hectares (20.45%), (4) rural settlement: 300.77 hectares (18.57%), and (5) regreening and grasses: 139.91 hectares (8.64%). During 6 years (2010-2016), there have been rapid landcuse change in Wonokerto village. Since 1980 a lot of paddyield have been changed into salak tree plantation thus the rice production was decreasing. In addition, there were also densiication of salak tree plantation around the rural settlement area mainly in Gondoarum, Balerante, Imorejo, and Nganggrung. However, with the existing mixed garden, Wonokerto village was going through regreening phase into more than 80%.
Land Capability Analysis for Food Crops and Forages.
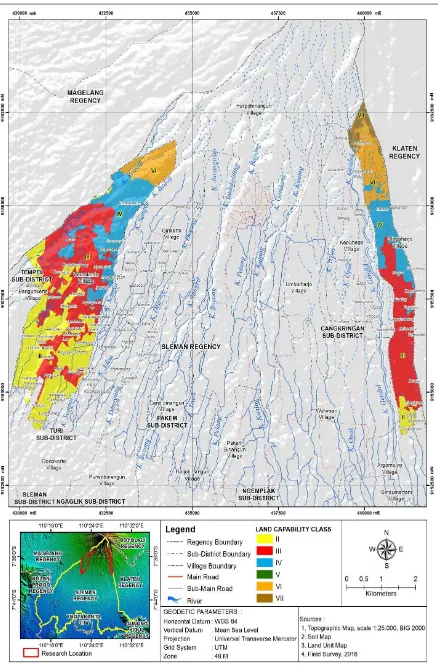
Land capability analysis was used for land classiication based on the soil physical characteristics. Klingebiel and Montgomery [1973 in Arsyad, 2010] classiied land capability class into 8 (eight) categories, I to IV categories were capable for crop farming, and V to VIII categories were capable for green ields. Land capability analysis was showed in the form of land capability map for Glagaharjo and Wonokerto Villages (Figure 2). Land evaluation based on the land capability criterion in Glagaharjo village as impacted areas was mapped into 5 (ive) land capability class which were (1) class II: 34.85 hectares (4.06%), (2) class III: 277.14 hectares (32.29%), (3) class IV: 216.20 hectares (25.19%), (4) class VI: 242.50 hectares (28.26%), and (5) class VII: 87.51 hectares (10.20%).Class V and VIII could not be identiied in Glagaharjo village. Meanwhile in Wonokerto village as an unimpacted areas, land capability could be mapped into 4 (four) class which were (1) class II: .480.12 hectares (28.99%), (2) class III: 539.37 hectares (33.61%), (3) class IV: 386.74 hectares (4.10%), (4) class VI: 213.52 hectares (13.30%). Class V, VII, and VIII could not be identiied in Wonokerto
village.
Spatial distribution of land capability class in Glagaharjo Village was showed on Figure 2. Land capability class of VII and VI were located mainly in river bank and buried valley of Gendol river which had been covered by lahar deposits. Moreover, class VI was spreadly located in Kalitengah Lor and Kalitengah Kidul. Land capability class IV was spreading to settlements of Srunen up to Singlar Villages (in the northern part). Land capability class III was located from Singlar (in the southern part) up to Banjarsari, and the last one, land capability class II was mainly identiied in Besalen which depicted yellow colour map. Meanwhile, land capability class I was not identiied in Glagaharjo Village.
Spatial distribution of land capability class in Wonokerto Village was showed on Figure 2. Land capability class VI was identiied in Tunggularum (in the northern part), whereas, land capability class IV was distributed in Tunggularum (in the southern part). Land capability class III had been located in Tlatar/sempu, Ngembesan, Manggungsari,and also Nganggrung. And the last one, because of the improvement of the soil fertility and water availabiliy the land capability in Imorejo, Nganggrung, Projayan, up to Sangurejo has been increasing from class III to class II.
Assessment of Carrying Capacity of Forage on Various Crops
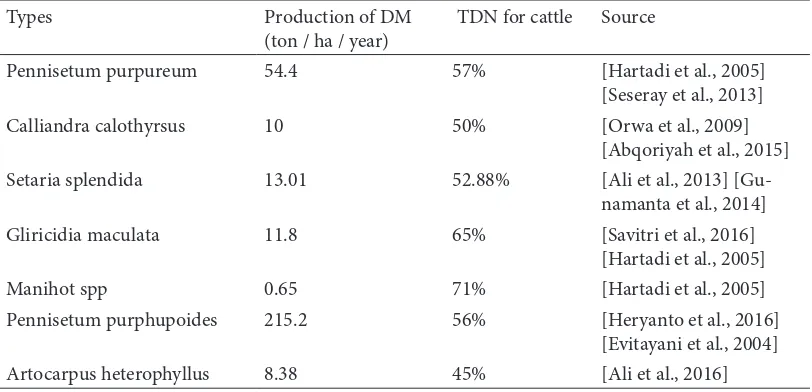
Assessment of potential forages were not only based on the presence of grasses, both natural and cultivated, but could also be obtained from the legume, fobs and leaves of trees planted on agricultural land, mixed gardens and even a garden/settlements, as well as waste of food crops. In this research, the production of various types of plants that could be used as cattle forage was calculated using the table which consists of list of feedstufs composition in Indonesia [Hartadi et al., 2005] and several other research, based on the
Table 1. Production of various types of forage crops from many previous researchers.
Types Production of DM
(ton / ha / year)
TDN for cattle Source
Pennisetum purpureum 54.4 57% [Hartadi et al., 2005]
[Seseray et al., 2013]
Calliandra calothyrsus 10 50% [Orwa et al., 2009]
[Abqoriyah et al., 2015]
Setaria splendida 13.01 52.88% [Ali et al., 2013] [Gu-
namanta et al., 2014]
Gliricidia maculata 11.8 65% [Savitri et al., 2016]
[Hartadi et al., 2005]
Manihot spp 0.65 71% [Hartadi et al., 2005]
Pennisetum purphupoides 215.2 56% [Heryanto et al., 2016]
[Evitayani et al., 2004]
Figure 2. Land Capability Map of Glagaharjo and Wonokerto Villages
production of Dry Matter (DM) and Total Digestible Nutrition (TDN) for cattle as could be seen in the Table 1.
he basic principle of potential forage assessment for cattle was based on the amount of production and/ or productivity of each type of agricultural crops on the area of land use and land capability in the certain class. Measurement of the carrying capacity of forage feed potential was calculated from the estimated production of various types of plants in the unit of kilogram dry matter of TDN for cattle, it was adjusted to equal with the
size requirements per AU of cattle feed by NRC [1996]. Estimation of the potential carrying capacity of each type of forage from various locations of land capability in the sample area of Glagaharjo village (impacted area) and the Wonokerto village (unimpacted area ) were shown in Table 2.
Based on the table list of the National Research Council [NRC, 1996] about the requirement for forage per AU cow weighting 350 kg (estimated average weight of the feeder cattle in Indonesia) with 0.8 kg of average daily gain (ADG) was 5.64 kg TDN / day or 2.06 ton
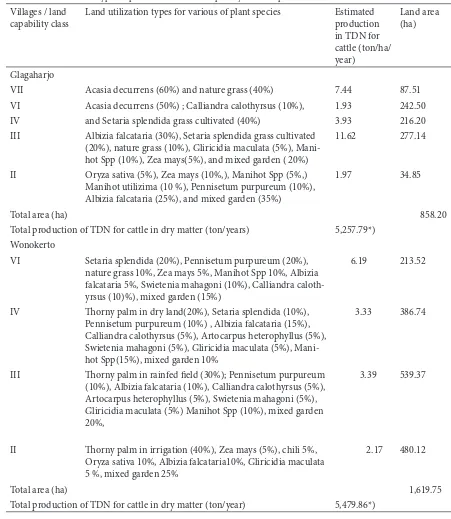
Table 2. Types of plants in each of land capability class and production (ton TDN) for cattle
Villages / land capability class
Land utilization types for various of plant species Estimated
production in TDN for cattle (ton/ha/ year)
Land area (ha)
Glagaharjo
VII Acasia decurrens (60%) and nature grass (40%) 7.44 87.51
VI Acasia decurrens (50%) ; Calliandra calothyrsus (10%), 1.93 242.50
IV and Setaria splendida grass cultivated (40%) 3.93 216.20
III Albizia falcataria (30%), Setaria splendida grass cultivated
(20%), nature grass (10%), Gliricidia maculata (5%), Mani- hot Spp (10%), Zea mays(5%), and mixed garden ( 20%)
11.62 277.14
II Oryza sativa (5%), Zea mays (10%,), Manihot Spp (5%,)
Manihot utilizima (10 %), Pennisetum purpureum (10%), Albizia falcataria (25%), and mixed garden (35%)
1.97 34.85
Total area (ha) 858.20
Total production of TDN for cattle in dry matter (ton/years) 5,257.79*)
Wonokerto
VI Setaria splendida (20%), Pennisetum purpureum (20%),
nature grass 10%, Zea mays 5%, Manihot Spp 10%, Albizia falcataria 5%, Swietenia mahagoni (10%), Calliandra caloth- yrsus (10)%), mixed garden (15%)
6.19 213.52
IV horny palm in dry land(20%), Setaria splendida (10%),
Pennisetum purpureum (10%) , Albizia falcataria (15%), Calliandra calothyrsus (5%), Artocarpus heterophyllus (5%), Swietenia mahagoni (5%), Gliricidia maculata (5%), Mani-hot Spp(15%), mixed garden 10%
3.33 386.74
III horny palm in rainfed ield (30%); Pennisetum purpureum
(10%), Albizia falcataria (10%), Calliandra calothyrsus (5%), Artocarpus heterophyllus (5%), Swietenia mahagoni (5%), Gliricidia maculata (5%) Manihot Spp (10%), mixed garden 20%,
3.39 539.37
II horny palm in irrigation (40%), Zea mays (5%), chili 5%,
Oryza sativa 10%, Albizia falcataria10%, Gliricidia maculata 5 %, mixed garden 25%
2.17 480.12
Total area (ha) 1,619.75
Total production of TDN for cattle in dry matter (ton/year) 5,479.86*)
Source : Field observation, 2016
TDN / year / AU of cattle. Based on the calculation, Glagaharjo village could potentially accommodate up to 2,555.32 AU of cattle, whereas Wonokerto village could be up to 2,660.13 AU of cattle (Table 3).
Carrying Capacity of Forages for Cattle Development
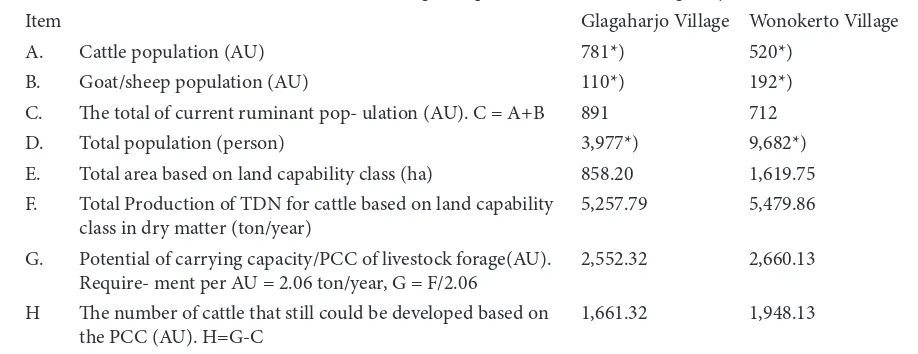
An important factor inluencing the development of cattle, in addition to carrying capacity of feed, were labor and capital. Cattle farming in rural areas were generally operated by small-scale farming and low capital. he total of current ruminant population in Glagaharjo (891 AU) and Wonokerto (712 AU). he current population of cattle in Glagahardjo greater than wonokerto, but for goat/sheep in Wonokerto greater than Glagaharjo (Table 3). Furthermore, in Table 3 could be seen that the total area based on land capability class in Wonokerto village greater (1,619.75 hectares) than Glagaharjo village (858.20 hectares), although the total production of TDN for cattle in Wonokerto village (5,479.86 ton/year) almost the same with Glagaharjo village (5,257.79 ton/year). Further, the potential of carrying capacity (PCC) of livestock forage in Wonokerto village (2,660,13 AU) and Glagaharjo village (2,552.32 AU). Based on the PCC in both villages could still be used to increase of cattle development in Glagaharjo village as much as 1,661.32 AU and Wonokerto village as much as 1,948.13 AU (Table 3), assuming there is not developing of other ruminants. It could be used as an evident that there was the great opportunity for farmers in the two villages to develop of cattle farming in order to generate income and produce manure to fertilize farm land, so that the whole farm was expected can improve the welfare for farmers. Widiati and Widi [2016] have been calculated that every cattle fattening could be done to generate income of IDR 3,545,309/AU within 4 months. It was
became an opportunity and challenge for livestock farmers who were generally small scale and low capital, while to increase the scale of cattle farming requires additional capital. herefore it needs pay attention from government or other stakeholders to capture these opportunities and realize in an efort to increase of local meat production through development of cattle in order to reduce imports and provide employment opportunities for rural communities. To support of the potential of carrying capacity of forage in Glagaharjo village was still needed soil conservation eforts to restore of the soil fertility and water availability. Cultivating of pasture and various types of legumes as cover crops can help improve the eiciency of landuse. It can increase water retention and reduce chemical fertilizer, costs, and labor of farming.
According to Peters, et al.,[2001] stated that to increase of planting forage and leguminous in pastures will help increase the land use eiciency. Recovery of soil fertility and water availability could proportionally change land arrangement and vegetation cover, as shown in Table 2. Moreover, it only needed a little touch of technology in the Wonokerto village, such as giving fertilizer to improve soil fertility and crop diversity, so that it could deine the proportion of land arrangement and vegetation cover.
In general, cattle development in the rural region still needed capital and labor. In addition, training on management skill to develop an integrated farming system as well as livestock agribusiness were urgently needed.
5.Conclusion
Analysis of land capability could be used to assess the potential of land for various purposes of farming activities, including cattle farming. Based on the land capability mapping in Glagaharjo could be mapped more Table 3. he condition of the population, population of ruminants, and carrying capacity of forages with usage
current land use in both village samples (Wonokerto and Glagaharjo)
Item Glagaharjo Village Wonokerto Village
A. Cattle population (AU) 781*) 520*)
B. Goat/sheep population (AU) 110*) 192*)
C. he total of current ruminant pop- ulation (AU). C = A+B 891 712
D. Total population (person) 3,977*) 9,682*)
E. Total area based on land capability class (ha) 858.20 1,619.75
F. Total Production of TDN for cattle based on land capability
class in dry matter (ton/year)
5,257.79 5,479.86
G. Potential of carrying capacity/PCC of livestock forage(AU).
Require- ment per AU = 2.06 ton/year, G = F/2.06
2,552.32 2,660.13
H he number of cattle that still could be developed based on
the PCC (AU). H=G-C
1,661.32 1,948.13
Source: Primary Data Analysis, 2016
*) he recording of a local village oices, 2015.
varied class than Wonokerto. Glagaharjo dominated by grass and Wonokerto dominated by leguminous. he potential of carrying capacity of forages that still could be used to increase of cattle development in Glagaharjo was little bit lower (1,661.32AU) than Wonokerto (1,948.13 AU) although which has twice of total area. Nevertheless, the constraints that faced for the development of cattle farming in general are human resources and capital, in particular in Glagaharjo which was an impacted area of Merapi volcano eruption 2010 still limited the water availability for agriculture and livestock.
Acknewledgement
his research was conducted in the southern part of the Merapi volcanic slope based on the impacted and unimpacted areas ater eruption 2010, village samples were taken in Glagaharjo and Wonokerto. Special thanks to the assistants Raras Indarto, Nur Azis Widodo, and Meita Puspa Dewi which has helped in the laboratory analysis and ield research using remote sensing technology and GIS procedure. hanks also to Head of Village (Glagaharjo and Wonokerto) which has provided secondary data and various informations related this research. Finally, thanks to all of people for their supporting this research until inish.
References
Ali, A., Ismail, A. B. O., Ahmed, M. F.A., Ahmed, E. H. O., and Ahmed, M. E. E., (2016). Nutritional evaluation and palatability of major forbs South Darfur, Sudan. Journal of Animal Science, 5, 42-48. Arsyad, S., (2010). Konservasi tanah dan air. Bogor :
IPB Press.
CBS (Central Berau of Statistic). 2013. Census of agriculture in Indonesia. Press release of Statistics No. 62/09/ XVI, Sept. 2013, 1-5. Ministry of Agriculture. Jakarta Indonesia.
Danoedoro, P., (1996). Pengolahan citra digital; Teori dan aplikasinya dalam bidang penginderaan jauh. Yogyakarta Indonesia: Fakultas Geograi Universitas Gadjah Mada.
Department of Agriculture and Food. (2016). Western Australian Beef Commentary. Retrieved from Department of Agriculture and Food website : https:// www.agric.wa.gov.au/newsletters.
Direktorat Jenderal Peternakan. (2000). Petunjuk teknis identiikasi dan analisis potensi wilayah pengembangan peternakan. Jakarta: Direktorat Jenderal Peternakan, Departemen Pertanian. Ensminger, M. E., Oldield, J. E., and Heinemann, W.
W., (1990). Feeds and nutrition digest. Clovis, CA: he Ensminger Publishing Company.
Evitayani, L., Warly, A., Fariani, T., Ichinohe., and Fujihara, T., (2004). Study on nutritive value of tropical forages in North Sumatra, Indonesia. Journal of Animal Science, 17, 1518-1523.
Gunamanta, P. G., Winten, K. T. I., and Sukasana, I.
W., (2014). Pemberian pupuk NPK dan pupuk kandang sapi terhadap produkstivitas rumput Setaria splendida Stapf. Majalah Ilmiah Universitas Tabanan, 11(1), 36-40.
Gunawan, T., (2012). Kontribusi citra penginderaan jauh untuk kajian perubahan fenomena hidrologi pasca letusan gunungapi Merapi sebagai dasar konservasi lingkungan, Kasus di wilayah Kecamatan Cangkringan, Sleman, Yogyakarta. Laporan Penelitian. Hibah Penelitian Fakultas Geograi Universitas Gadjah Mada. Yogyakarta. Gunawan, T., (2016). Restorasi lingkungan daerah
resapan air dan pengembangan jaringan pengatusan air mata air lereng selatan Gunungapi Merapi berbasis model Saluran Mataram dalam pengelolaan sumberdaya air berkelanjutan. Yogyakarta: Laporan Penelitian. Hibah Penelitian Sekolah Pascasarjana. Universitas Gadjah Mada. Handayanta, E., Ifar, S., Hartutik., and Kusmartono.,
(2014). Botanical composition and quality of ruminant feed resources in the dry land farming areas in Yogyakarta, Indonesia. Journal of Biology, Agriculture and Healthcare, 4 (4), 26-33.
Harini, R., Susilo, B., Nurjani, E., (2015). Geographics Information Systems-Based Spatial Analysis of Agricultural Land Suitability in Yogyakarta. International Journal of Geography, Vol. 47, No. 2, December, 2015. (171-179).
Hardjowigeno dan Widiatmaka., (2007). Evaluasi perencanaan lahan dan perencanaan tataguna lahan. Yogyakarta: Gadjah Mada University Press. Hartadi, H., Reksohadiprodjo, S., dan Tillman, A.D.,
(2005). Tabel komposisi pakan untuk Indonesia. Cetakan kelima. Yogyakarta: Gadjah Mada University Press.
Heryanto, K., Maaruf, S. S., Malalantang, M. R., dan Waani., (2016). Pengaruh pemberian rumput raja (Pennisetum purpupoides) dan tebon jagung terhadap performans sapi peranakan ongole (PO) betina. Jurnal Zootek, 36 (1), 123-130.
Jansen, L. L. F., Bakker, W. H., Gorte, B. G. H., Horn, J. A.,Pohl, J., Reevs, C. V., Weir, M. J. V., and Wold, T., (2000). Principles of remote sensing. he Netherlands: ITC.
Lloyd, N., Owen, M., and Kiriana, D., (2014). he socio- cultural dynamics in smallholder irrigation schemes in rural Zimbabwe: A case study of rupike irrigation scheme in Mavingo South. J. Sociology. Soc. Anth, 5 (2), 247-255.
National Research Council. (1996). Nutrient requirements of beef cattle. Washington : National Academy Press.
Ntale, J. F., and Litondo, K. O., (2013). Determinats of commercial mixed farming on small farms in Kenya. Euro. Journal of Business and Management, 5 (22), 1905-2222.
Orwa, C., Mutua, A., ¬Kindt, R., Jamnadass, R., and Anthony, S., (2009). Agroforestree Database:a tree reference and selection guide version 4.0, retrieved from (http://www. worldagroforestry.org/sites/ treedbs/treedatabases.asp)
Peters, M., Horne, P., Schmidt, A., Holmann, F., Kerridge, P. C., Tarawali, S. A., Schultze-Krat, R., Lascano, . C.E., Argel, P., Stur, W.,Fujisaka, S., Muller-Samann, K., and Wortmann, C., (2001). he role of forages in reducing poverty and degradation of natural resources in tropical production systems. Agricultural Research & Extension Network, 9 (117), 1-11.
Ryschawy, J., Choisis, N., Joannon, A., and Gibon., (2012). Mixed crop-livestock systems: an economic and environmental-friendly way of farming? he Animal Consortium. 6 (10), 1722-1730.
Savitri, M. V., Sudarwati, H., and Hermanto., 2016. Pengaruh umur pemotongan terhadap produktivitas gamal (Gliricidia sepium). Jurnal Ilmu-Ilmu Peternakan, 23( 2), 25-35.
Seseray, D. Y., Santoso, B., and Lekitoo, M. N., (2013). Produksi rumput gajah (Pennisetum purpureum) yang diberi pupuk N, P dan K pada devoliasi hari ke-45. Sains Peternakan. 11 (1), 49-55.
Verschelde, M., MD’ Haese., Rayp, G., and Vandamme, E., (2013). Challenging small-scale farming: a non- parametric analysis of the (inverse) relationship between farm productivity and farm size in Burundi. Journal of Agricultural Economics, 64 (2), 319–342.
Widiatmaka, Ambarwulan, W., Suprajaka, Nurwadjedi, Tambunan, R. P., Nugroho, Y. A., and Santoso, P. B. K., (2014). Land use planning for paddy ield using geographic information systems and land evaluation in west Lombok, Indonesia. International Journal of Geography, vol. 46. No. 1, June 2014 (89-98).
Widiati, R., (2006). he integration of beef cattle farming system on the farm household in Merapi Volcanic Slope, Sleman Yogyakarta (he application of linear programming analysis model toward sustainable livestock development). In: Proceeding 4th International Seminar Tropical Animal Production Faculty of Animal Science Gadjah Mada University. Yogyakarta (Indonesia), p. 536-541.
Widiati, R., (2012). Financial feasibility of beef cattle breeding with various capital aids in rural area of Gunung Kidul District of Yogyakarta. Bulletin of Animal Science, 36(2), 1-7.
Widiati, R., (2014). Developing beef cattle industry at smallholders to support beef self- suiciency. Wartazoa, 24 (4), 191-200.
Widiati, R. and TSM. Widi., (2016). Production systems
and income generation from the smallholder beef cattle- farming in Yogyakarta Province, Indonesia. Indonesian Journal of Animal Production, 18 (1), 51-58.