COMPETITIVENESS RICE FARMING IN SRAGEN REGENCY
Daya Saing Usahatani Padi Di Kabupaten Sragen
Cecep Suhardedi, Dwidjono Hadi Darwanto, Irham Faculty of Agriculture, Universitas Gadjah Mada Jl. Flora, Bulaksumur, Kec.Depok, Kabupaten Sleman,
Daerah Istimewa Yogyakarta 55281 [email protected]
Diterima tanggal 28 April 2017 ; Disetujui tanggal 29 Mei 2017 ABSTRACT
Rice is indonesian agriculture major crop. Indonesian rice historically has been the primary staple food and is an important economic driver and cultural symbol. On the basis of Sragen regency is one of the major rice producer in Central Java. This research aims to determine the level of private and social profi tability and competitiveness of rice farming in Sragen regency. Policy analysis matrix (PAM) is the approach used to determine the level of profi tability and competitiveness of rice farming in Sragen Regency. Sampling conducted by Simple Random Sampling of the 20 districts in Sragen which are rice production area. The results show that the value of profi t for private and social is IDR 9.989.911,16 and IDR 4.273.004,18 respectively. Rice farming in Sragen Regency is profi table and feasible to cultivate. Two indicators to measure the competitiveness were Private Cost Ratio (PCR) which later shows that rice farming in Sragen Regency is more competitive as the PCR < 1, and Domestic Resources Cost Ratio (DRCR) shows that the rice farming has a comparative advantage as the DRCR < 1.
Keywords: Competitiveness, PAM, Private and Social, Rice farming INTISARI
Tanaman padi adalah tanaman pokok yang diusahakan di Indonesia. Menurut Sejarah indonesia padi menrupakan makanan pokok dan penggerak ekonomi yang penting dan juga sebagai simbol sosial mayarakat. Pada dasarnya Kabupaten Sragen adalah salah satu sentra produksi di Jawa Tengah. Penelitian ini bertujuan untuk menentukan besarnya tingkat keuntungan privat dan sosial serta daya saing usahatani padi di Kabupaten Sragen. Policy analysis matrix (PAM) adalah pendekatan yang digunakan untuk besarnya tingkat keuntungan dan daya saing usahatani padi di Kabupaten Sragen. Pengambilan sampel dengan simple random sampling di 20 Kecamatan di Kabupaten Sragen yang mempunyai areal produksi padi. Hasil penelitian menunjukan bahwa nilai keuntungan privat dan sosial adalah Rp 9.989.911,16 and Rp 4.273.004,18, hal ini berarti usahatani padi di Kabupaten Sragen menguntungkan dan layak untuk diusahakan. Dua indikator untuk mengukur daya saing adalah Private Cost Ratio (PCR) menunjukan bahwa usahatani padi di Kabupaten Sragen memiliki keunggulan kompetitif karena nilai PCR < 1, dan Domestic Resources Cost Ratio (DRCR) menunjukan bahwa usahatani padi di Kabupaten Sragen memiliki keunggulan koparatif karena nilai DRCR < 1.
INTRODUCTION
Rice is indonesian agriculture major crop. Indonesian rice historically has been the primary staple food and is an important economic driver and cultural symbol (Rahmasuciana et al., 2015). The government policies to control stocks and imports have kept prices above world price levels and enhanced the ability of farmers (Giamalva, 2015).
The priority agenda of the government is directing the agricultural development forward to attain food sovereignty, and as a nation the government of Indonesia should be able to arrange and meet their food needs of the people. Sovereignty food translated in the form of the ability nation to things: satisfy the needs of food of domestic production, set food policy independently, and protecting and welfare farmers as leading perpetrator of agricultural food businesses. In other words, food sovereignty can be initialized by self-suffi cient food that gradually followed by the enhancement of value added agricultural businesses widely for enhancing the welfare of farmers (Hanani, 2012; Permatasari & Vita, 2016).
The rice farming faces challenges from rising production costs, the migration of farm labor to other sectors of the economy, a decline in the average farm size, the conversion of agricultural land to other uses, deteriorating and inadequate irrigation infrastructure, and stagnant yield growth (Mulyana, 2012; Lukmanto
and Rullan, 2015). These factors threaten the ability of the Indonesian rice farming to grow enough to meet the goal of self-sufficiency in the future as population continues to expand (Suryana, 2014) .
Indonesia is the third largest producer of rice in the world. The rice production in Indonesia is 44,6 million metric tons or about 9 percent of global production in 2014 (FAO, 2015).
In other side Indonesia is also a rice deficit country, and thus must import rice regulary to meet their needs. Indonesia’s rice imports during 2000–2014 were erratic with average 1,26 million matric tons. This inconsistency reflects the Indonesian government’s efforts to maintain self-sufficiency in rice and to strictly control imports to fill domestic shortfalls. Import volumes thus depend both on domestic production levels and government procurement targets, which fl uctuate annually.
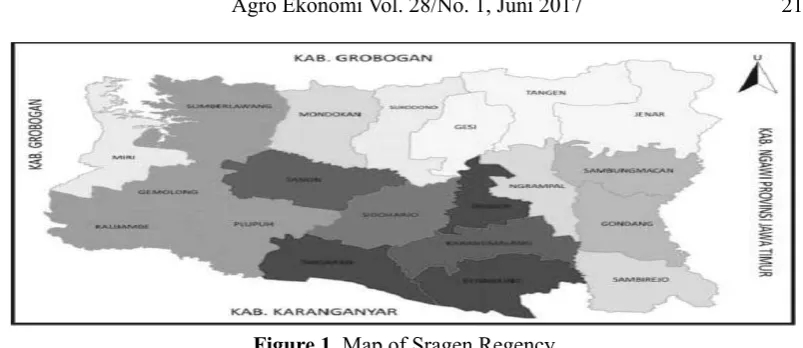
Figure 1. Map of Sragen Regency Source: Badan Pusat Statistik (BPS) (2015) Sragen Regency is one of 35 districts
located in the province of Central Java. Astronomically, Sragen Regency is located between 110°45’ to 111°10’ east longitude and 7°15’ to 7°30’ south latitude. In terms of geographic position, Sragen regency has boundaries as follows: Grobogan Regency in north, Karanganyar Regency in south, Boyolali Regency in west, and Ngawi Regency, the Province of East Java in east (Figure 1).
Sragen Regency has territory area of 941,55 Km2. It is divided into 20 Sub-districts and 208 villages. From the territory area, Sragen consists of 68,753 Hectare (73,02 %) agricultural land and 25.402 Hectare (26,98%) non-agricultural land. Sragen Regency having tropical climates and medium temperature. The average rainfall in Sragen is 3.287 mm per year and the sum of rainfall in Sragen is 173 days per year. A large number of areas in Sragen is lowland with an average height is 109 m above sea level. In addition, Sragen regency is irrigated by several rivers, one of
them is the Bengawan Solo river as a source of irrigation water, so Sragen is suitable for agriculture, especially rice farming.
This research aims to determine the level of private and social profi tability and to know the competitiveness of rice farming through the competitive and comparative advantage of rice farming in Sragen.
Bolaang Mongondow have comparative and competitive advantages.
The principles of cost analysis is that each farmer does have some control over the costs of production on his farm, but he has little or no control over the prices that he receives for his products or the value that he should place on them because these are determined by country and worldwide factors. The most important classifi cation of farm costs is their division into fixed and variable. Fixed costs remain the same regardless of volume of output. The farmer would have to pay them regardless of how much his farm produces. Variable costs are those which change as the size of operation changes. They occur only if something is produced and they do not occur if nothing is produced (Soekartawi et al., 2011).
Study of farming management is defi ned as a study that learning about how someone allocated the available resources effectively and efficiently to earn high profits. Effective means the farmer can allocate their resources as well as possible and efficient means the utilization of resources generate the output that exceed the input (McBride and James, 2006).
The fi nancial and economic analyses are thus complementary, the financial analysis takes the viewpoint of individual and the economic analysis that of the society. In fi nancial analysis market prices are normally used. These take into account taxes and subsidies. In economic analysis
some market prices may be changed so that they more accurately refl ect social or economic values. These adjusted prices are called shadow prices (Dreze and Stren, 1990).
The competitiveness is a concept that states the ability of a producers to produce a commodity or product with the quality is quite good and costs is quite low so the prices that occurred in markets commodity or the product can be produced and marketed by the producers to earn the suffi cient profi ts so it can sustain the cost of production. (Aprilia et al., 2015).
Measurement of the competitiveness of a commodity or product can be measured by two approaches. Both of those approaches is the level of profi ts generated and the effi cient operation of commodity or product. Through The fi rst approach is the level of profi ts generated can be viewed from two sides those are private profi ts and social profi tability. Whereas, through approach to the efficient operation of commodity or product, can be viewed from two indicators of comparative advantage and competitive advantage. (Zhong et al., 2010).
foreign exchange gained or saved) being considered as the ensuring benefi ts from production. The rationale for using the foreign exchange gained (through exports) or saved (through imports) as a standard of reference is that foreign exchange is relatively, and often critically, scarce in many developing countries (Banerji & Donges, 1974).
The reason that international trade causes this increase in world output is that it allows each country to specialize in producing the good in which it has a comparative advantage. A country has a comparative advantage in producing a good if the opportunity cost of producing that good in terms of other goods is lower in that country than it is in other countries (Handoyo et al., 2012; Andini et al., 2016).
In the analysis of farming is often conducted through by fi nancial analysis (private) and economic analysis (social). Financial analysis of cost data used is real data that is actually issued, while the economic analysis of the data used is according to the size of the shadow price (Soekarwati, 2006).
Policy Analysis Matrix (PAM) is a tool or approach that examines the impact of government policy on agriculture both pricing policy and investment policy. According to Pearson et al.(2005), the three main objectives from the PAM method are (1) to provide information and analysis to help decide agricultural policy related
to the issue of the competitiveness of farming, the impact of public investment in the construction of new infrastructure on the effi ciency of farming systems, and last issue is the impact of new investments in the form of research and technology, (2) to calculate the level of social profi ts of a farming, produced by assessing output and cost of effi ciency prices (social opportunity costs), 3) to calculate the transfer effects, as the impact of a policy. PAM method calculates the impact of policies affecting output and factors of production (land, labor and capital).
According to Pearson et al., (2005), the policy analysis matrix (PAM) approach is a system of double-entry bookkeeping. Analysts using PAM have to provide complete and consistent coverage to all policy infl uences on returns and costs of agricultural production. The main empirical task is to construct accounting matrices of revenues, costs, and profits. Three principal issues can be investigated with the PAM approach: (1) the impact of policy on competitiveness and farm level profi t, (2) the influence of investment policy on economic effi ciency and comparative advantage, and (3) the effects of agricultural research policy on changing technologies.
METHODS
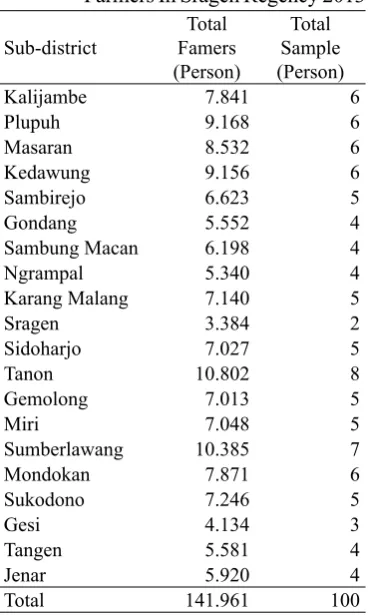
where is the sample size, is the population size, and is the margin of error. The size of the farmer population is around 141.961 with the level margin of error is 10%, so that the number of samples taken consisted of 100 respondents rice farmers in Sragen spread in the 20 districts (Table 1). The instrument used in this study is a questionnaire.
The method of analysis utilized to measure profi tability (social and private) and competitiveness of rice farming in Sragen Regency was the Policy Matrix Analysis (PAM) (Table 2). The policy analysis matrix is a product of two accounting identities, one defi ning profi tability as the difference between revenues and costs and the other measuring the effects of divergences (distorting police and market failures) (Kanaka & Chinnadurai, 2015).
To apply the PAM method, the fi rst step is to construct a table of private budgets, using quantities and prices of inputs and outputs in actual market prices. The next step is to construct a table of social budgets, using social prices for both inputs and outputs. The social prices of tradable commodities are given by comparable world prices. These prices are compared with domestic prices at the identical location, over the same period, and with comparable quality. Social prices for tradable are found by calculating import Table 1. The Total Sample Per district
Based On The Number Of Farmers In Sragen Regency 2013 Sub-district
Sambung Macan 6.198 4
Ngrampal 5.340 4
Karang Malang 7.140 5
Sragen 3.384 2
Source: Primary Data Analysis (2017) selection of a subject group was based on the characteristics or specifi c traits which deemed to have a close relationship with the population (Ningtyas et al., 2016), and based on consideration of Sragen is one of the area of rice production centers in Central Java province. The Collecting data was conducted in November 2016 to December 2016. The data were divided into primary and secondary data. Samples of farmers were taken by simple random sampling.
parity for goods that substitute for imports and export parity prices for goods that enter export markets (Pearson et al., 2005).
The PAM is comprised of revenues, costs and profi ts, at private and social. The top row of the matrix is a budget showing costs of production and marketing at market prices, the only unusual aspect being the division of cost elements into two categories: tradable and domestic factor (non-tradable inputs) (Khai & Mitsuyasu, 2013).
The second row in the matrix shows the same cost elements expressed at social prices. For tradable inputs, adjusted world prices are normally taken as social prices. The social price of domestic factors is taken as their opportunity cost, in other words the Return at the margin in the best available alternative.
The third row of the PAM is simply the fi rst row minus the second. It shows the net impact of distorting policies and market failure. The signs of the revenues
Table 2. Policy Analysis Matrix
Revenues
Costs
Profi t Tradable Inputs Domestic
Factors
Private Prices A B C D
Social Prices E F G H
Divergences I J K L
Table Notes:
A : Private Revenues G : Cost Domestic Factors Social B : Cost Tradable Inputs Private H : Social Profi ts
C : Cost Domestic Factors Private I : Output Transfers D : Private Profi ts J : Input Transfers E : Social Revenues K : Factor Transfers F : Cost Tradable Inputs Social L : Net Transfers Source : Monke and Pearson(1989) in Akhtar et al.(2007)
and cost terms in the third row indicate whether the net effects of policy and market imperfections for these categories amount to an implicit subsidy or tax.
The data entered in the first row of Table 2 provides a measure of private profitability. The term private refers to observed revenues and costs reflecting actual market prices received or paid by farmers.
Private profi ts (D) are the difference between private revenues (A) and cost tradable inputs private added with cost domestic factors private (B+C). Using the PAM framework the private profi tability (D) can be expressed as:
Social profi ts (H) are the difference between social revenues (E) and cost tradable inputs social added with cost domestic factors social (F+G). Using the PAM framework the Social profi tability (H) can be expressed as:
The Competitive advantage with an indicator Private Cost Ratio (PCR). PCR is the ratio of factor costs (C) to value added in private prices (A-B). This ratio measures the competitiveness of a commodity system at the farm level. The commodity system was competitive if the PCR is less than 1. Using the PAM framework the PCR can be expressed as:
Notes :
PCR : Private Cost Ratio
C : Cost Domestic Factors Private A : Private Revenues
B : Cost Tradable Inputs Private
The comparative advantage with an indicator Domestic Resource Cost Ratio (DRCR), if the DRCR is less than 1, the system uses domestic resources effi ciently and had a comparative advantage. If the DRCR is greater than 1, then the system shows ineffi ciency in domestic resource use and had a comparative disadvantage (Setiawan et al., 2014). The method of calculating the DRCR in the PAM framework is expressed as:
Notes :
DRCR : Domestic Resource Cost Ratio G : Cost Domestic Factors Social E : Social Revenues
F : Cost Tradable Inputs Social
RESULTS AND DISCUSSION
The average age of respondents is 48.61 Years farmers, the average education level of farmer respondents is high school, with an average area of farm 0.27 hectares. The average production per hectare is 5.6 tons.
The first step to apply the PAM method is to construct a table of private budgets, using quantities and prices of inputs and outputs in actual market prices (Table 3). The next step is to construct a table of social budgets, using social prices for both inputs and outputs (Table 4). The tradable input rice farming in Sragen is fertilizer made by factory (inorganic and organic fertilizer).
Inorganic fertilizer use in rice farming in this research location consists of a fertilizer containing macro nutrients, which consists of a single fertilizer urea (nitrogen) and TSP/ SP 36 (phosphate) and compound fertilizers (NPK) ZA (nitrogen and sulfur) and NPK (nitrogen, phosphate, and potassium). For organic fertilizer is Petroganik.
Tabel 3. Private Prices and Budgets of Rice Farming in Sragen Regency
Input/Output Items Usage
(Kg/Ha) Price (IDR) Amounts (IDR/Ha) Tradeble
Inputs
Fertilizer
a.Urea 273,46 IDR 1.800,00 IDR 492.223,44 b.TSP (SP 36) 262,14 IDR 2.000,00 IDR 524.278,93 c. NPK (PHONSKA) 249,73 IDR 2.300,00 IDR 574.370,21 d. ZA 36,51 IDR 1.400,00 IDR 51.113,55 e. PETROGANIK 176,71 IDR 500,00 IDR 88.353,41 Domestic
Factors
Seed 68,20 IDR 10.000,00 IDR 682.000,73 Manure 7,30 IDR 2.500,00 IDR 18.254,84
Pesticide IDR 443.921,14
Labor 1. Seedbed Preparation (Hr/Ha) 12,83 IDR 60.000,00 IDR 769.989,05 2. Land Preparation
a. Manual Cultivated (Hr/Ha) 13,47 IDR 60.000,00 IDR 808.141,66
b. Tractor (Rent) IDR 1.431.179,26
3. Planting (Hr/Ha) 22,33 IDR 60.000,00 IDR 1.339.905,07 4. Crop care (Hr/Ha) 15,67 IDR 60.000,00 IDR 940.124,13 5. Harvesting (Rent) IDR 2.683.461,12 6. Post Harvesting 5,22 IDR 60.000,00 IDR 313.253,01
Others 1. Depresiation IDR 46.367,29
2. Land (Rent) IDR 3.333.333,33
3. Tax (PBB) IDR 50.000,00
4. Irigation IDR 365.096,75
5. Transportation IDR 100.000,00
Total Costs IDR 15.055.366,92
Output Total Revenue 5566 IDR 4.500,00 IDR 25.045.278,08
Profi t IDR 9.989.911,16
Source: Primary Data Analysis (2017) land. The output is dry paddy (unmilling rice) with 14% of humidity.
The total costs for private prices is IDR 15.055.366,92, while the total costs for social prices is IDR 17.248.238,35. The total costs for social prices more than total costs for private prices, this indicate the government apply input subsidies and output prices protection.
Based on Table 5. The analysis result of PAM rice farming in Sragen regency, showed that rice farming in Sragen profi table both privately and social. The amount of private profi t is IDR 9,989,911.16, means the
rice farming in Sragen feasible to cultivated, because it has the profi t above 0, while the amount of social benefi t is IDR 4,382,200.25 showed that rice farming process is more efficient and have a high comparative advantage. The difference in rates of private profi ts to the level of social profi ts allegedly because infl uenced by government policies. Government policies, especially in the form of subsidies will inhibit the effi cient allocation of resources and thus creates divergences.
Tabel 4. Social Prices and Budgets of Rice Farming in Sragen Regency
Input/Output Items Usage
(Kg/Ha) Price (IDR) Amounts (IDR/Ha) Tradeble
Inputs
Fertilizer
a.Urea 273,46 IDR 3.916,01 IDR 1.070.862,25 b.TSP (SP 36) 262,14 IDR 5.508,04 IDR 1.443.874,38 c. NPK (PHONSKA) 249,73 IDR 7.292,23 IDR 1.821.060,20 d. ZA 36,51 IDR 2.540,81 IDR 92.763,97 e. PETROGANIK 176,71 IDR 2.387,69 IDR 421.921,26 Domestic
Factors
Seed 68,20 IDR 8.636,53 IDR 589.012,22 Manure 7,30 IDR 2.500,00 IDR 18.254,84
Pesticide IDR 443.921,14
Labor 1. Seedbed Preparation (Hr/Ha) 12,83 IDR 48.000,00 IDR 615.991,24 2. Land Preparation
a. Manual Cultivated (Hr/Ha) 13,47 IDR 48.000,00 IDR 646.513,33
b. Tractor (Rent) IDR 1.431.179,26
3. Planting (Hr/Ha) 22,33 IDR 48.000,00 IDR 1.071.924,06 4. Crop care (Hr/Ha) 15,67 IDR 48.000,00 IDR 752.099,31 5. Harvesting (Rent) IDR 2.683.461,12 6. Post Harvesting 5,22 IDR 48.000,00 IDR 250.602,41
Others 1. Depresiation IDR 46.367,29
2. Land (Rent) IDR 3.333.333,33
3. Tax (PBB) IDR 50.000,00
4. Irigation IDR 365.096,75
5. Transportation IDR 100.000,00
Total Costs IDR 17.248.238,35
Output Total Revenue 5566 IDR 3.886,44 IDR 21.630.438,60
Profi t IDR 4.382.200,25
Source: Primary Data Analysis (2017)
Table 5.The Analysis Policy Analysis Matrix Rice Farming In Sragen Regency
Revenues (IDR)
Costs
Profi t (IDR) Tradable Inputs
(IDR)
Domestic Factors (IDR)
Private Price 25.045.278,08 1.730.339,54 13.325.027,38 9.989.911,16 Social Prices 21.630.438,60 4.850.482,06 12.397.756,29 4.382.200,25 Divergences 3.414.839,49 (3.120.142,52) 927.271,09 5.607.710,91 Source: Primary Data Analysis (2017)
1), implying that rice farming in Sragen Regency has a competitive advantage. That value means to improve value-added output at a unit price of rice farming in the private Sragen district, only require an additional cost factor of 0.57 or less than one unit.
Table 6. shows that the DRCR of rice farming in Sragen Regency was 0,74
$ 0,74 to produce rice in Sragen Regency. It suggests that paddy commodities (rice) is preferably to own production in Sragen Regency.
CONCLUSION AND SUGGESTION Based on research fi ndings, it can be concluded as follows: rice farming in Sragen Regency is profi table as privately and socially. It can be seen from the private and social profi ts are positive. Sragen rice farming has competitive and comparative advantage. This can be seen from the indicators PCR and DRCR smaller than one.
Researchers have some suggestions for the advancement of the cultivation of rice in Sragen Regency: To increase profi t and competitiveness farming rice the government should apply input subsidies and output prices protection. Beside with an input subsidies and output prices protection, the government should provide an infrastructure such as irrigation facilities to increase the productivity. Increased productivity is one way to increase the profi t and farming rice competitiveness.
Table 6. The Results Privat Cost Ratio (PCR) and Domestic Resource Cost Ratio (DRCR) of Rice Farming In Sragen Regency
Criteria The Value
Privat Cost Ratio (PCR) 0,57
Domestic Resource Cost Ratio (DRCR) 0,74
Source: Primary data analysis (2017)
ACKNOWLEDGMENT
I am using this opportunity to express my gratitude to everyone who supported me throughout the course of this research paper. I am thankful for their aspiring guidance, invaluably constructive criticism and friendy advice during the project work. I am sincerely grateful to them for sharing their truthful and illuminating views on a number of issues related to the project. The authors would like to thank to my beloved wife for support and funding. A special note of thanks to Prof. Dwidjono H.D, Prof. Irham, and Dr. Slamet Hartono in Universitas Gadjah Mada for advice in writing of this journal.
REFERENCES
Akhtar, W., Muhammad, S. & Nadeem A. 2007. Analysis of Economic Efficiency and Competitiveness of the Rice Production Systems of Pakistan’s Punjab. The Lahore Journal of Economics. 12 (1). 141-153. Antriyandarti, E., Susi W., & Minar F.
2012. Analisis Privat dan Sosial Usaha Tani Padi di Kabupaten Grobogan. Jurnal SEPA . 9 (1): 12 –18.
di Pasar Internasional (Studi pada Ekspor Produk Olahan Kakao Indonesia tahun 2009-2014). Jurnal Administrasi Bisnis (JAB). 38(2). 171-174.
Aprilia, F., Zainul, A., & Sunarti. 2015. Posisi Daya Saing dan Spesialisai Perdagangan lada Indonesia dalam Menghadapi Globalisasi (Studi Pada Ekspor Lada Indonesia Tahun 2009-2013). Jurnal Administrasi Bisnis (JAB). 27(2). 1-7.
Badan Pusat Statistik. 2015. Jawa Tengah Dalam Angka 2014. BPS dan BAPPEDA Prov. Jawa Tengah. Semarang. 458 p.
. 2016. Sragen Dalam Angka 2015. BPS Kabupaten Sragen. Sragen. 319p.
Banerji, Ranadev., & Donges, Juergen B. 1974. The domestic resource cost concept: Theory and an empirical application to the case of Spain. Kiel Working Papers, No. 24. 1-38 Dreze, J., & Stren, N. 1990. Policy Reform,
Shadow Prices, and Market Prices. Journal of Public Economics. (42) 145. 1-45.
Food and Agriculture Organization (FAO). 2015. Food Outlook. FAO. Rome (Italia). 142 p.
G i a m a l v a , J . 2 0 1 5 . R i c e : G l o b a l Competitiveness of the U.S. Industry. United States International Trade Commission Washington, DC. 442p. Handoyo, M. J., Dwidjono H.D., Sugiyarto,
& Setiyawan S.K.J. 2012. Kinerja Daya Saing Teh Indonesia di Pasar Internasional: Analisis Data Sekunder. Journal of World Trade Studies. 3(1) : 57-74.
Hanani, N. 2012. Strategi Pencapaian Ketahanan Pangan Keluarga.
E-Journal Ekonomi Pertanian. (1) 1. 1-10.
Kanaka, S. & M. Chinnadurai. 2015. The Policy Analysis Matrix Of Rice Cultivation In India. European Journal of Basic and Applied Sciences. 2 (1): 33-45.
Khai, H.V., & Mitsuyasu, Y. 2013. The Comparative Advantage of Soybean Production in Vietnam: A Policy Analysis Matrix Approach. A C o m p re h e n s i v e S u r v e y O f International Soybean Research Genetics, Physiology, Agronomy and Nitrogen Relationships. 7. 161-179. Lukmanto, C.M.E., & Rullan, M. 2015.
K o n s e p A g r i k u l t u r S e b a g a i Penyelesaian Dari Isu Pertanian. Jurnal Sains dan Seni ITS. (4) 2. 82-87.
Mantau, Z., Harianto., Nunung, N. 2014. Analysis of competitiveness of of low land rice farming in Indonesia, case study of Bolaang Mongondow District Nort Sulawesi Province. J o u r n a l O f E c o n o m i c s a n d International Finance 6(4) : 85-90. McBrige, W.D. & James, D.H. 2006.
D e f i n i n g a n d C h a r a c t e r i z i n g Approaches to Farm Management. Journal of Agricultural and Applied Economics.(38) 1. 155-167.
Mulyana, A. 2012. Penguatan Ketahanan Pangan Untuk Menekan Jumlah Penduduk Miskin dan Rentan Pangan di Tingkat Nasional dan Regional. Journal of World Trade Studies. 3(1): 11-18.
E-Jurnal Agribisnis dan Agrowisata. (5) 2. 362-369.
Pearson, S., C. Gotsch & S. Bahri. 2005. Aplikasi Policy Analysis Matrix pada Pertanian Indonesia. Terjemahan. Yayasan Obor Indonesia. Jakarta. 398 p.
Permatasari, D. L., & Vita R. 2016. Pemodelan Ketahanan Pangan di Indonesia dengan Pendekatan Regresi Probit Ordinal. Jurnal Sains Dan Seni ITS.(5) 2. 151-156. Rahmasuciana, D.Y., Dwidjono, H. D.,
& Masyhuri. 2015. Pengaruh Pengadaan Beras dan Operasi Pasar Terhadap Harga Beras Dalam Negeri (Effect of Rice Procurement and Market Operations Toward Domestic Rice Price). Agro Ekonomi (26) 2. 129-138.
Setiawan, K., Slamet, H & Any, S. 2014. Analisis Daya Saing Komoditas Kelapa Di Kabupaten Kupang. JurnalAgritech. 34(1): 88-93.
Soekartawi. 2006. Analisis Usahatani. Penerbit Universitas Indonesia. Jakarta. 110p.
Soekartawi., Soeharjo, A., John, L.D., & J.B. Hardaker. 2011. Ilmu Usahatani dan Penelitian untuk Pengembangan Petani Kecil. Penerbit Universitas Indonesia (UI press). Jakarta. 253 p. Sugandi, Dede. 2014. A Model Of
Environmental Conservation For Sagara Anakan. International Journal Of Conservation Science. 5 (1). 95-106.
Suryana, A. 2014. Toward Sustainable Indonesian Food Security 2025: Challenges and Its Responses ( M e n u j u K e t a h a n a n P a n g a n Indonesia Berkelanjutan 2025: Tantangan dan Penanganannya. Jurnal Forum Penelitian Agro Ekonomi. (32) 2. 123 – 135.