ANALYSIS COMPETITIVENESS OF SUGARCANE FARMING
IN CENTRAL JAVA AND EAST JAVA
Analisis Daya Saing Usahatani Tebu di Jawa Tengah dan Jawa Timur
Wahyu Adhi Saputro1, Masyhuri2, Any Suryantini3
1Master Student of Agricultural Economics, Faculty of Agriculture, UGM 2,3Faculty of Agriculture, UGM Jl. Flora No. 1 Bulaksumur, Yogyakarta
Diterima tanggal : 18 Agustus 2017 ; Disetujui tanggal : 17 September 2017 ABSTRACT
This study aims to determine the competitiveness of sugarcane farming in Central Java and East Java based on comparative advantage (DRCR) and competitive advantage (PCR). The method used was the Policy Analysis Matrix (PAM). The result in Central Java explained that the sugarcane farming do not have comparative advantage but have competitive advantage. It is indicated by the value of Domestic Resource Cost Ratio DRCR>1 which is 1.23 and the value of Private Cost Ratio PCR<1 which is 0.71. Meanwhile The result in East Java explained that the sugarcane farming do not have comparative advantage but have competitive advantage. It is indicated by the value of DRCR>1 which is 1.05 and the value of PCR<1 which is 0.56. Partial test was conducted to ind out how many respondents in each region in Central Java and East Java that have competitiveness sugarcane farming. Based on the partial test of each respondent in Central Java, about 51.67%, 45.00% and 3.33% of respondents are categorized as very competitive, medium competitiveness and very low competitive respectively. Meanwhile, in East Java Province, there are 25.00% of respondents with very high competitiveness, 65.00% medium competitiveness and 10.00% very low competitive.
Keywords : Competitiveness, PAM, Sugarcane
INTISARI
INTRODUCTION
One of the commodities that has been developed since the past in Indonesia is sugar cane commodity. The business of sugar cane was developed by of Dutch East India government during the oppression era. At that time, the local sugar cane farm could produce 3 millions of sugar. Sugar cane is a very important commodity in Indonesia. The increasing rate of sugar consumption due to the increasing number of population and the development of industries that use sugar as their main raw material have made sugar cane as the essential commodity. The International Sugar Organization (ISO) stated that the Indonesian sugar consumption will grow 4% every year. ISO is predicting that in 2012-2013, the import of raw crystal sugar of Indonesia will continue to increase even surpassing China which would make Indonesia as the irst importer of Sugar all over the world (Kurniasari, et al, 2015).
One of the main causes of Indonesia to import sugar is the incapability of local sugar industries in fulfilling the increasing needs and demands from the community for sugar. The decreasing productivity of sugar in Indonesia is proved by the decreasing amount of sugar
production produced by farmers and the sugar factories. The indecent management of national sugar factories are causing Indonesia to be incapable in fulilling the sugar demand thus the annual import is required (Prabowo, 2013).
Even since the rule of Dutch East India Government, the sugar cane has been seen as the commercial and potential commodity and being developed continuously by the Indonesian Government through the state-owned and the private sector farm companies. The sugar cane farming is also conducted by the local farmer through the government policy regarding the Intensiication of Community Sugar Cane by the rotational planting area system. The productivity of community sugar cane farm which extends to 56% of sugar cane farms in Indonesia still considered low. Fitriani (2013) mentioned that the potential production of sugar cane farm in Indonesia could reach 8 tons per ha, while the BPS data shows the productivity of Indonesia Sugar Cane in 2013 was only 5.8 tons per ha.
The sugar cane has a very important role in moving the economic condition of one particular area. This role related to its position as the main raw material sangat rendah. Sementara itu di Provinsi Jawa Timur terdapat 25,00% responden berdaya saing sangat tinggi, 65,00% berdaya saing sedang dan 10,00% berdaya saing sangat rendah.
of sugar industry. Sugar is a strategic commodity protected by the government, thus the interventions from them are heavily conducted towards sugar industry. As the manifestation of government concern towards sugar industry, several policies have been issued through price policy, which regulating sugar provenue as the price acceptable either by farmer or sugar industry as the producent. If reviewed from the perspective of sugar cane production in Indonesia, there are three regions that have a massive contribution to sugar cane production including Sumatra, Java, and Sulawesi. Aside from that, it can be also discovered that 64.24% of sugar raw material production in Indonesia comes from Java Island. While Sumatra has 34.41% percentage and Sulawesi has 2.34%. In that order, the biggest supplier of sugar in Indonesia is located in Java Island. Java Island has the highest production compared to other islands. In Java Island, there are four provinces that have the highest sugar cane production including East Java in the top rank, followed by Central Java, West Java, and Yogyakarta Special Province. East Java Province has 75.73% of percentage in producing sugar cane, while Central Java has 17.73%. These two provinces are the regions that own massive contribution in supplying the sugar cane in Java Island. This condition has become the basis of this research to study the sugar cane competitiveness in
Java Island especially in Central Java and East Java Province, thus Indonesia would be no longer depended on sugar import.
O n e o f t h e r e a s o n s o f l o w competitiveness of sugar commodity is the incapability of national sugar industry in fulfilling the national sugar demand, thus the sugar import is relatively high (Susilowati and Rahman, 2016). The high rate of sugar import in Indonesia resulted in decreasing price of sugar, therefore the farmer’s motivation to conduct sugar cane agricultural farming also decreased. In that order, the development of several determining factors of this commodity has to be monitored.
The high price of sugar in the domestic market is a relection of low competitiveness in the market. Government policy in the field of production, processing that leads to intervention to the problem. Meanwhile, subsidies are only aimed at suppressing higher prices and world market prices. The market’s actors that favor the subvention are sugar factory, BULOG and traders. On the other hand (the customer) has to bear the loss due purchasing sugar with a higher price. For the sugar cane’s farmer, although they also favor the subvention in the form of provenue price and production facility price, they are still at disadvantages due to the inability to produce other commodities.
Due to the emergence of that problem, then the analysis towards sugar cane business competitiveness need to be conducted as the consideration in selecting the policy to improve the competitiveness of sugar cane’s farmer. This research aimed to discover the comparativeness and competitiveness of sugar cane farming in East Java and Central Java.
METHODS
Location and Data
The selection of the research location was purposive because geographically the land structure in Kediri was a good sugar cane plantation that has a high sugarcane rendering while for the location of Central Java was chosen in Karanganyar this was due to have in place have a sugar factory
with the largest milling capacity and one of the cane centers. The survey was conducted at government-owned sugar cane plantations, where the selected recipes were built from the Tasikmadu sugar factory in Karanganyar and Pesantren Baru sugar factory in Kediri. Types of data collected in this study were primary and secondary data and data were collected from September to December 2016. Primary data were obtained from interviews with farmers who run sugar cane farming, as respondents using a structured questionnaire. The number of respondents used in each district 60 cane farmers. The sample selection method was simple random sampling. Sugarcane farmers who become respondents are farmers who are milled sugar cane, so that more understand the inputs used to produce the output.
Analysis Method
This research is analyzed using PAM (Policy Analysis Matrix) method. Stages in the preparation of PAM tables are as follows (Monke and Pearson in Setiawan et al, 2014):
1. Identify all inputs used in the production process
2. Allocate tradable input and non tradable input.
3. Calculating the price of shadow input, output, and exchange rate.
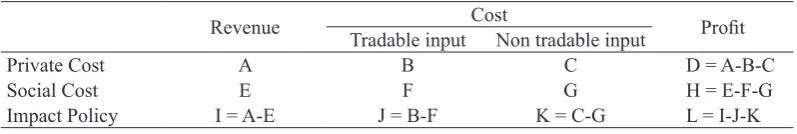
PAM is composed of a matrix constructed by inputting components of acceptance, cost, and profit. The PAM analysis results inform the competitive and comparative advantage as well as the impact of government policies on particular commodity systems. Model of PAM matrix can be seen in table 2.
Where :
The acceptance of sugar cane farming at private prices = A
Total cost tradable sugarcane farming at private price = B
Total cost of non tradable sugarcane farming at private price = C
Private proit = D
The acceptance of sugar cane farming at social prices = E
Total cost tradable sugarcane farming at social price = F
Total cost of non tradable sugarcane farming at social price = G
Social proit = H Transfer output (OT)= I Transfer input (IT) = J Transfer Factor (TF) = K Transfer bersih (NT)= L
Private Cost Ratio (PCR)=C/(A-B) Domestic Resources Cost Ratio (DRCR) = G/(E-F)
Nominal Protection Coefficient Output (NPCO)= A/E
Nominal Protection Coefficient Input Table 1. Input Output Cost Allocation in Domestic and Foreign Components
Component Domestic (%) Foreign (%)
Sugar 0.00 100.00
ZA 0.00 100.00
Phonska 0.00 100.00
Transport 44.86 55.14
Labor 100.00 0.00
Land Rent 100.00 0.00
Rent a Tractor 33.00 67.00
Capital Interst 100.00 0.00
Depreciation Equipment 100.00 0.00
Source: Table Input Output Indonesia, 1995 (processed) in Saptana, 2002 Table 2. Policy Analysis Matrix (PAM)
Revenue Cost Proit
Tradable input Non tradable input
Private Cost A B C D = A-B-C
Social Cost E F G H = E-F-G
Impact Policy I = A-E J = B-F K = C-G L = I-J-K
(NPCI)= B/F
Effective Protection Coeficient (EPC) = (A-B)/(E-F)
Proitability Coeficient (PC) = D/H Subsidy Ratio to Producers (SRP) = L/E
The irst line is a calculation based on the private price of the actual price actually received by the farmer, including the government’s policy. The second line is a calculation based on the social price of the price received economically without any government policy in it. The social price is derived from the international price already converted to the shadow exchange rate.
The determination of the Rupiah exchange rate is based on the development of the foreign currency exchange rate of US Dollar in 2016. Gittinger (1986 in Marjaya et al, 2013) based on Squire Van de Tak formulated a formula for determining the currency exchange rate shadow value: Standard conversion factors. The standard conversion factor value which is the ratio of the import and export value plus the tax can be determined as follows.
)
SCFt : Standard Conversion Factor for year-t
Xt : Export Value of Indonesia for year-t (Rp)
Mt : Indonesian Import Value for year-t (Rp)
Txt : Government Revenue from Export Tax for year-t (Rp)
Tmt : Government Revenue from Import Tax for year-t (Rp)
SERt : Shadow exchange rate (Rp) OERt : Oficial exchange rate (Rp) SCFt : Standart conversion factor (Rp)
RESULTS AND DISCUSSION
Policy Analysis Matrix (PAM)
input components of sugar cane agricultural business of Central Java and East Java Province in 2016.
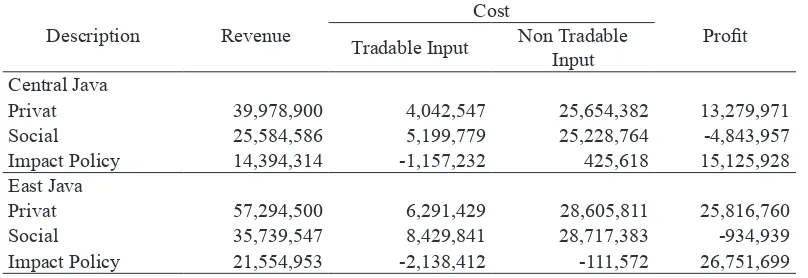
According to the Table 3, the private and social revenues in Central Java Province are IDR 39,978,000 and IDR 25,584,586 respectively, while the private and social revenues in East Java Province are IDR 57,294,500 and IDR 35,739,547 respectively. Private revenues in East Java are greater when compared to private revenues in Central Java due to the result of sugar cane output in East Java greater than in Central Java so that the effect on revenues will be greater in East Java
Reviewed from these numbers, the private revenues are bigger compared to the social revenues. The difference in these revenues resulted from the market divergence. Market divergence causing the difference value between private and social prices, in this context is the output that earned by the sectors. The existing market divergence is causing the revenue deicit
about IDR 14,394,314 for Central Java Province and IDR 21,554,953 for East Java Province. Market divergence can possibly occur due to the government policy that is protective towards the output price.
The tradable input cost in private price is lower compared to the tradable input cost in social price. The non-tradable input cost in private price is also lower compared to the non-tradable input cost in social price. The difference of tradable input value in private price with the tradable input value in social price is – IDR 1,156,232 for Central Java and – IDR 2,138,412 for East Java Province. The difference of non-tradable input value in private price with the non-tradable input value in social price is – IDR 111,572 for East Java Province. This condition shows the existence of subvention caused by the government policy that applied in the market of tradable and nontradable input. This subvention is naturally profiting the farmer, or on the other words, the Table 3. Policy Analysis Matrix (PAM)
Description Revenue
Cost
Proit Tradable Input Non Tradable
Input Central Java
Privat 39,978,900 4,042,547 25,654,382 13,279,971 Social 25,584,586 5,199,779 25,228,764 -4,843,957 Impact Policy 14,394,314 -1,157,232 425,618 15,125,928 East Java
Privat 57,294,500 6,291,429 28,605,811 25,816,760 Social 35,739,547 8,429,841 28,717,383 -934,939 Impact Policy 21,554,953 -2,138,412 -111,572 26,751,699
government policy is on the farmer side. In the column of cost for Central Java Province, if the cost value of tradable and non-tradable inputs are summarized thus the cost value of input in private price will be larger than the cost input in social price. The total cost amount in private and social prices are IDR 26,698,929 and IDR 30,428,543 or IDR 731,614 in difference. This number shows that the input price in the international market is higher compared to the domestic prize as well as the inefficient input utilization. Aside from that, the allocation of input cost from the domestic sector is larger than the input allocation from the international sector. Therefore, the transformation in social price only has a small influence towards the total cost of social input. By discovering the difference of price between the domestic and the international, the competitiveness of sugar cane agricultural business in Central Java and East Java Provinces could be found. The sugar cane agricultural business in Central Java and East Java Province is inancially proitable, however, it’s economically disadvantaging. This can be seen from the proit column.
The inancial proit or the proit of sugar cane agricultural business of private sector in Central Java and East Java Province is positive, while for the economic or social proit is negative. The difference between financial and economic profit also valued positively. The government policy is causing the proit transfer from the consumer towards the producent.
Analysis of Comparative Advantage of
Sugar Cane Farming in Central Java
and East Java Provinces
The comparative advantage is the ability of a particular region to produce a commodity with decent quality and eficient cost. The comparative advantage can be discovered from the social profitability (SP) exist in the PAM matrix on the second line of profit column. Aside from that, domestic resource cost ratio (DRCR) is also used. The indicators of social proit and the domestic resource cost ratio are the indicators acquired from the calculation by using social price or the price that applied in the international market.
The social profit of sugar cane agricultural business in Central Java and
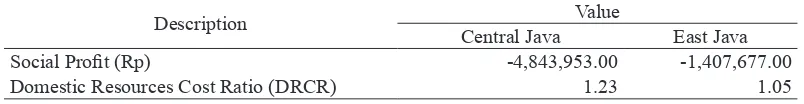
Table 4. Indicator of Comparative Advantage of Sugarcane Farming Central Java and East Java Provinces
Description Value
Central Java East Java Social Proit (Rp) -4,843,953.00 -1,407,677.00
Domestic Resources Cost Ratio (DRCR) 1.23 1.05
East Java according to the Table 4 is negative about IDR 4,843,953 and IDR 1,407,477. This shows that there is a subsidy used by farmers in East Java especially for fertilizers, besides that sugarcane farmers in East Java are more eficient to use the inputs that are compared to inputs used by sugar cane farmers in Central Java. This value acquired from the difference of revenues in social price subtracted with the tradable and non-tradable price in social price as well. The value of social proit of sugar cane agricultural business in Central Java and East Java is negative. In that order, it can be deined that the sugar cane agricultural business in Central Java and East Java Province is not economically proitable.
The domestic resource cost ratio (DRCR) is acquired from the ratio calculation between non-tradable input cost in social price and the difference of revenue and tradable input cost in social price. According to the analysis in the PAM Matrix, the DRCR value of sugar cane agricultural business in Central Java Province is 1.23 and for the East Java Province is 1.05; it means that to gain one unit output of social price, 1.03 unit of domestic price need to be sacriiced. The 1.23 and 1.05 value of DRCR (DRCR>1) shows that the sugar cane agricultural businesses in Central Java and East Java Province are not economically eficient. The sugar cane’s farmers in Central Java
and East Java Province are unable to pay the domestic factor input. The DRCR values of sugar cane agricultural business in Central Java and East Java Province are more than one which means that the sugar cane agricultural business does not have comparative advantages. This condition shows that exporting sugar from agricultural business in Central Java and East Java Province is not proitable.
and Jember Regency show the opposite (DRCR<1). The sugar cane agriculture businesses in Madiun, Kediri, and Malang Regency (agriculture farm) will have the comparative advantages if the productivity of sugar cane is improved by 20% or the global price of sugar is 220 USS per ton. The sugar cane agriculture businesses in the entire location could pay the scariication of eficient domestic price (PCR<1). The input policy regulated by the government has induced an incentive towards sugar cane’s farmer in the form of half prices of input price paid by them. Aside from that, the sugar selling price relished by the farmer is higher, around 30-45% of the actual sugar selling price.
The research conducted by Saptana, et al (2002) regarding the efficiency and the competitiveness of sugar cane and tobacco agriculture businesses in East Java and Central Java show that the sugar cane agriculture businesses in Kediri, Ngawi, and Klaten Regency do not have the comparative advantages with DRC>1 coefficient, however they still have the competitive advantages showed by PCR<1 coeficient. However the competitive own by sugar cane farmer is tend to have resulted from the protective policy. The implication is when the sugar cane plant to be developed continuously then the invocation in producing primary good variety, the balance of fertilizer utilization, the improvement of eficiency
in the processing industry through the management of brand standardization, the efficiency improvement in distribution through the reduction of any distortion existed as well as through the conducive government’s policy.
Analysis of Competitive Advantage of
Sugar Cane Farming in Central Java
and East Java Provinces
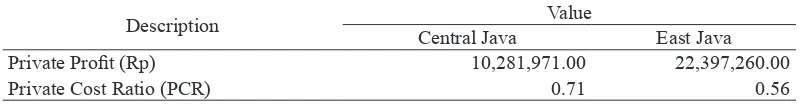
The competitive advantage is a measurement for competitiveness in the actual economic condition, where the analysis is conducted to measure the financial feasibility. The competitive advantage of a commodity can be seen in accordance with the indicators of Private Proit and Private Cost Ratio. The private proit is calculated based on the price from the accumulation of domestic price factor and the addition output value from the input price that applied in the market (private price) and the private cost ratio (PCR). These indicators show the level of proit inancially and the level of eficiency for the utilization of input resources that trading at the private price. Table 5 The Indicators of Competitive Advantage of Sugar Cane Agriculture Business in Central Java and East Java Province.
non-tradable cost about IDR 25,645,382 thus the private proit is acquired about IDR 10,281,971,00 for Central Java Province. The private proit of East Java Province is better which acquired IDR 57,294,500 from the revenue difference with the tradable input cost about IDR 6,291,429 and the domestic input or non-tradable cost about IDR 28,605,811 thus the private proit is acquired about IDR 22,387,260. The value of positive private proit (PP>0) shows that inancially the sugar cane agriculture businesses in Central Java and East Java Province are proitable. Therefore, those sugar cane agriculture businesses are decent to be afforded.
The analysis result acquired from the Table 5.10 shows the PCR value for sugar cane agriculture businesses in Central Java and East Java Province are 0.71 and 0.56 which less than one (PCR<1), it shows that the sugar cane agriculture businesses are inancially eficient which the farmer can afford the domestic input factor or it can be said that the sugar cane agriculture businesses have competitive advantages. The PCR value is closer to the value of 0 or
the smaller the value of PCR will actually raise its competitive competitivenessThe 0.71 PCR value also means that to produce one addition of output value in private price, the 0.71 value of domestic input cost has to be sacriiced. Similar to the 0.56 PCR value in East Java Province that means to produce one addition of output unit, 0.44 values can be saved. The smaller PCR value resulted in higher competitive advantage own by that certain commodity. PCR values in East Java are better due to outcomes between the output generated with the input used is more eficient when compared with central Java
This result also in accordance with the research of Soetrion regarding the competitiveness of soybean commodity in the central production of Banyuwangi that mentioned the actual BSD value is smaller than the oficial exchange value or the competitive advantage will be acquired of the actual KBSD value is < 1. The entire businesses conducted by the soybean’s farmer and the producent of tempe and tofu have a smaller value than its oficial exchange value with the actual KBSD value is <1, it means that the agro-industry Table 5. Indicator of Competitive Advantage of Sugarcane Farming in Central Java and
East Java Provinces
Description Value
Central Java East Java Private Proit (Rp) 10,281,971.00 22,397,260.00
Private Cost Ratio (PCR) 0.71 0.56
commodities of soybean; tempe and tofu in Banyuwangi Regency have the competitive advantages for business.
T h e P C R a n a l y s i s t o w a r d s sugar cane agriculture business above resulted in PCR <1, thus the sugar cane agriculture business in Central Java has competitiveness in inancial value but not having the competitiveness in economic value (international) or having the competitiveness but not comparativeness because DRCR > 1. The government policy is required to improve the sugar social price. This policy can be embodied as the pricing policy. Pricing policy could increase the selling price of imported sugar that could increase the comparative advantage. Aside from that, it has to be known that the PCR value of sugar cane agriculture business has lower value compared to its DCR value or PCR < DCR. This condition reveals that without government policy, in order to produce one additional value, the larger domestic factor compared to the existence of a policy is required. On the other words,
the government policy is still required to support the competitiveness in economic value (international).
P a r t i a l Te s t o f S u g a rc a n e F a r m
Competitiveness of each respondent in
Central Java and East Java Provinces
The assessments of competitiveness for each respondent of sugar cane agriculture business in Central Java and East Java Province are indeed required. Partial test of each respondent will be divided into three categories of competitiveness is very high, medium, and very low. This assessment is related to the capability of producent to sell and stock the goods or service provided in the market. Aside from that, in order to discover if each respondent has competitiveness, the assessment towards competitive and comparative advantage needs to be conducted. The assessment of the competitiveness of sugar cane agriculture business for each respondent in Central Java and East Java can be seen in Table 6 below.
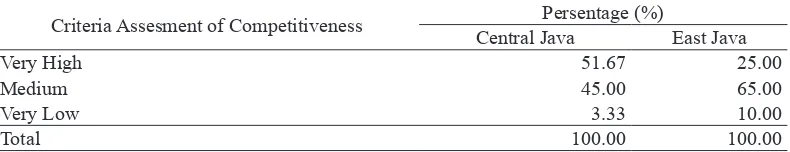
Table 6. Criteria Assessment of Competitiveness of Each Respondent ini Central Java and East Java Province in 2016
Criteria Assesment of Competitiveness Persentage (%)
Central Java East Java
Very High 51.67 25.00
Medium 45.00 65.00
Very Low 3.33 10.00
Total 100.00 100.00
According to Table 6 regarding the assessment of the competitiveness of each respondent for sugar cane agriculture business; it can be known that 31 people (51.67%) in Central Java and 15 people (25%) in East Java have the high criteria of competitiveness. It means that they already conceive the advantages either in competitive or comparative. Aside from that, 27 people (45%) in Central Java and 39 people (65%) in East Java have decent competitiveness; it means that those respondents already have competitiveness but not comparativeness. The existence of sugar cane farmers whose competitiveness is very high and low. This is because there are some sugarcane farmers who are still new and can be categorized as sugarcane farmers who are intensive cultivation by Sinder (cane foreman), while the high competitiveness is usually independent sugarcane farmers.
In that case, the medium/decent criteria still possible to be developed with a note that the government policy that could increase the sugar social price exists, this policy can be embodied as pricing policy. The pricing policy will increase the selling price of imported sugar that could increase the comparative advantage. While there are still two respondent (3.33%) in Central Java and six people (10%) that conceive neither comparativeness nor competitiveness which do not need to be developed.
CONCLUSION AND SUGGESTION
The sugar cane agriculture businesses in Central Java and East Java Province have competitiveness according to the competitive advantage but conceive no comparative advantage. The protection towards the output and input of sugar cane agriculture business in Central Java and East Java due to the policy applied by the government, thus the sugar cane farmer receive output price that higher than its social price and the tradable input price that lower than the social price. The output and input protections applied are one of the efforts implemented by the government to increase the production.
Increased competitive advantage of each sugar cane farmer, especially in East Java, which most of the farmers are still in the category of moderate competitiveness, namely by improving the technical system of sugar cane cultivation where farmers often maintain the production of sugar cane in the fourth ratoon and after. In addition, government policy applies price and output price protection. The use of non-tradable inputs should be more eficient so that it will lower costs.
REFERENCES
Ariani, M., Askin, A, dan Hestina, J. 2006. Analisis daya saing usahatani tebu di Propinsi Jawa Timur. Jurnal Sosial Ekonomi Pertanian dan Agribisnis Hal: 1-19.
Fitriani., Sutarni., dan Irawati,L. 2013. Faktor-Faktor yang Mempengaruhi P r o d u k s i , C u r a h a n K e r j a d a n Konsumsi Petani Tebu Rakyat di Propinsi Lampung. Jurnal Ilmiah ESAI Volume 7 No.1 Hal : 1.
Gittinger, J. P. 1986. Analisa Ekonomi Proyek-proyek Pertanian Edisi II. Universitas Indonesia Press, Jakarta. Kurniasari, R. I., D. H. Darwanto, dan
S. Widodo. 2015. Permintaan gula kristal mentah Indonesia. Jurnal Ilmu Pertanian. Vol 18 : 24 – 30.
Marjaya, Hartono S, Masyhuri, Darwanto DH. 2013. Analisis Daya Saing Komoditas pada Sistem Usahatani Integrasi Jagung-sapi di Kabupaten Kupang. Jurnal Agribisnis 2: 15-29. Ogbe, A, O., Okurawa, V, O., and Saka, O.J.
2011. Competitiveness of Nigerian Rice and Maize Production Ecologies : A Policy Analysis Approach, Tropical and Subtropical Agroecosystem Journal, (14): 493-500
Pearson, S.R., Gotsch, C., dan Bahri, S. 2004. Aplikasi Policy Analysis Matrix Pada Pertanian Indonesia. Yayasan Obor Indonesia, Jakarta. Prabowo, A. S. 2013. Analisis
faktor-faktor yang mempengaruhi produksi gula di Jawa Tengah 2004 – 2013. Economics Development Analysis Journal (3): 420 – 426.
Saptana, Supena, dan Bastuti,T. P. 2002. Eisiensi dan Daya Saing Usahatani Tebu dan Tembakau di Jawa Timur dan Jawa Tengah. Pusat penelitian dan Pengembangan sosial Ekonomi Pertanian.
Soetrion. 2004. Analisis Daya Saing Komoditas Kedelai di Sentra Produksi Guna Menunjang Pengembangan Agroindustri. Jurnal Agroekonomi 11 (2): 82 - 91