Proceedings of the IConSSE FSM SWCU (2015), pp. BC.51–54 ISBN: 978-602-1047-21-7
SWUP SC.51
Survival analysis for recurrent event data
with Andersen–Gill approach
Nariza Wanti Wulan Sari and Santi Wulan Purnami
Department of Statistics,Sepuluh Nopember Institute of Technology, Indonesia Email: *[email protected]
Abstract
Cervical cancer is the second most common cancer among women worldwide. In Indonesia, cervical cancer ranked for the second highest cancer next only to breast cancer and is the leading cause of cancer-related death. Survival analysis can also be used to analyze the recurrent failure event. Recurrent event in this study was the return of a patient to the hospital for examination or treatment. Recurrent event data in this study analysis with Andersen–Gill approach. Andersen–Gill Model is a generalization of the Cox proportional hazard regression for analysing independent increment models of the Cox type on the basis of the theory of counting process for survival analysis, the risk of an event is assumed not to be affected by previous events.Data in this study were patients with cervical cancer who had undergone treatment in RSUD Dr. Soetomo in 2014 and variable used is age, education, domicile, stadium, medication, comorbidities, complication, weight, and parity. The result show that there exist 3 variables that affect the recurrent data of patients with cervical cancer is stadium, complication and weight.
Keywords Andersen
–
Gill, recurrent, servix, survival1. Introduction
Survival analysis is the phrase used to describe the analysis of data that corresponden to the time from a well-defined time origin until the occurence of some particular event or end-point (Collect, 2003). Survival analysis can also be used to analyze the recurrent failure event. Recurents events, that is, events that occur several times for the same subject (Eimermacher, 2008). There are several approaches used to analyze the recurrent data derived from Cox proportional hazard is counting process approach dan stratified Cox approach. The stratified Cox approach there are three approaches that can be used is stratified counting process, gap time, dan marginal. In addition, recurrent data can also be analyzed with parametric approach using a frailty model (Kleinbaum & Klein, 2012).
Kelly & Lim (2000) researching survival analysis for recurrent event data an application to childhood infectious diseases by comparing five models of Cox for recurrent event: Andersen
–
Gill (AG), Prentice Williams and Peterson–gap time GT) dan total time (PWP-CP), Lee Wei and Amato (LWA), and Wei Lin and Weissfeld (WLW). This study concludes that five models give different result. however, have not been able to conclude which model is suitable for recurrent event data.Survival analysis for recurrent event data with Andersen–Gill approach
SWUP SC.52
different between the Andersen–Gill (AG) dan frailty models in terms of model selection, goodness of fit or occuracy. Accordingly, Recurrent event data in this study analysis with Andersen–Gill approach. Andersen–Gill Model is a generalization of the Cox proportional hazard regression for analysing independent increment models of the Cox type on the basis of the theory of counting process for survival analysis, the risk of an event is assumed not to be affected by previous events (Eimermacher, 2008).
Cervical cancer is the second most common cancer among women worldwide, with an estimated 471.000 new cases (and 233.000 deaths) in the year 2000. Almost 80% of the cases occur in developing countries, where, in many regions, it is the most common cancer among women. The highest incidence rates are observed in Latin America and the Caribbean, sub-Saharan Africa and south and south-east Asia (WHO, 2005). Cervical cancer continues to be a widespread public health problem in women throught the world, especially in developing country like Indonesia (Nuranna, 2012). In this study will examine the implementation model Andersen–Gill in cervical cancer patients data.
2. Materials and methods
2.1
Data and method
Data in this study case are patients with cervical cancer who had undergone treatment at the Hospital Dr. Soetomo 2014. Data obtained from cervical cancer patient medical record data cervical cancer patients Obstetrics Gynecology section. Variables Research in this study, there are several variables where each variable has a classification.
2.2
Proportional Hazard test
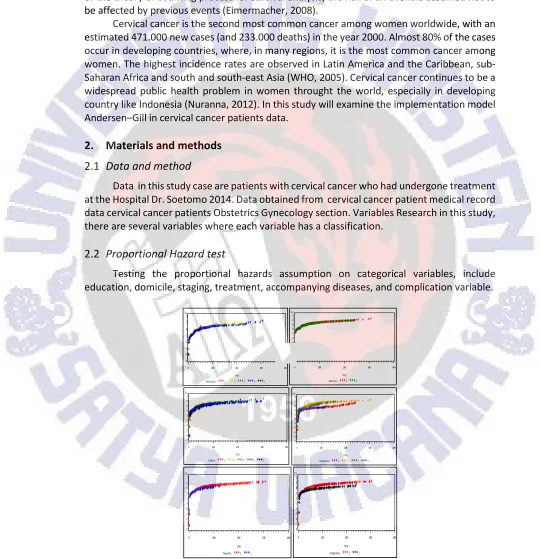
Testing the proportional hazards assumption on categorical variables, include education, domicile, staging, treatment, accompanying diseases, and complication variable.
N.W.W. Sari, S.W. Purnami
SWUP
SC.53
Based on Figure 1, known plot for the variable: (a) education, (b) the domicile, (c) stage, (d) treatment, (e) accompanying diseases, and (f) the complications shows that the line between categories parallel the proportional hazards assumption for all categorical variables have been met. Because the proportional hazards assumption test with graphical approach is subjective, then the approach to the goodness of fit test, the results are as follows.
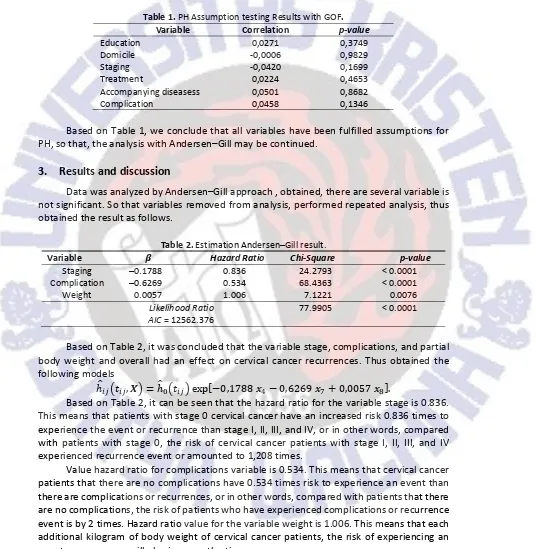
Table 1. PH Assumption testing Results with GOF. Variable Correlation p-value
Education 0,0271 0,3749
Domicile -0,0006 0,9829
Staging -0,0420 0,1699
Treatment 0,0224 0,4653
Accompanying diseasess 0,0501 0,8682
Complication 0,0458 0,1346
Based on Table 1, we conclude that all variables have been fulfilled assumptions for PH, so that, the analysis with Andersen–Gill may be continued.
3.
Results and discussion
Data was analyzed by Andersen–Gill approach , obtained, there are several variable is not significant. So that variables removed from analysis, performed repeated analysis, thus obtained the result as follows.
Table 2. Estimation Andersen–Gill result.
Variable ä Hazard Ratio Chi-Square p-value
Staging –0.1788 0.836 24.2793 < 0.0001
Complication –0.6269 0.534 68.4363 < 0.0001
Weight 0.0057 1.006 7.1221 0.0076
Likelihood Ratio 77.9905 < 0.0001 AIC = 12562.376
Based on Table 2, it was concluded that the variable stage, complications, and partial body weight and overall had an effect on cervical cancer recurrences. Thus obtained the following models
ℎãIa1(Ia, å2 = ℎãÅ1(Ia2 exp[−0,1788 !é− 0,6269 !ë+ 0,0057 !ìo.
Based on Table 2, it can be seen that the hazard ratio for the variable stage is 0.836. This means that patients with stage 0 cervical cancer have an increased risk 0.836 times to experience the event or recurrence than stage I, II, III, and IV, or in other words, compared with patients with stage 0, the risk of cervical cancer patients with stage I, II, III, and IV experienced recurrence event or amounted to 1,208 times.
Survival analysis for recurrent event data with Andersen–Gill approach
SWUP SC.54
4.
Conclusion and remarks
Survival analysis for recurrent event data with Andersen–Gill approach with study case patients cervical cancer data was studied and major conclusions are as follows:
1. In this case study showed various ways to check the PH assumption graphically and analytically, both give the same result, all categorical variables have fulfilled proportional hazards assumption.
2. This study showed there are three variables that affect the recurrent data of patients with cervical cancer, complication have greatest risk, where the risk is two times compared with no complications.
It is important to check model assumptions before carrying out analysis using any statistical model. The proportional hazard assumption is especially important for the use of the Cox model, and is commonly or intentionally ignored.
References
Collett, D. (2003). Modelling survival data in medical research (2nd ed.). London: Chapman and Hall. Eimermacher, A.J. (2008). Comparison of the Andersen-Gill model with poisson and negatif binomial
regression on recurrent event data. Computational Statistics and Data Analysis, 52, 4989–4997. Kleinbaum, D.G., & Klein, M. (2012). Survival analysis a self-learning text (3rd ed.). London: Springer. Kelly, P. J., & Lim, L. L.-Y. (2000). Survival analysis for recurrent event data: An application to childhood
infectious siseases. Statistics in Medicine, 19, 13–33.
Ullah, S., Gabbett, T. J., & Finch, C. F. (2012). Statistical modelling for recurrent events: An application to sports injuries. Br J Sport Med., 0, 1–8.
WHO, I.A. (2005). Cervical Cancer Sreening. Lyon: IARCH Press.