Serial MRI, functional recovery, and long-term infarct maturation in a
non-human primate model of stroke
J.W.B. Marshall
a, R.M. Ridley
a,∗, H.F. Baker
a, L.D. Hall
b, T.A. Carpenter
b,1, N.I. Wood
b,2aMRC Comparative Cognition Team, Department of Experimental Psychology, University of Cambridge, Downing Street, Cambridge, CB2 3EB, UK bHerchel Smith Laboratory for Medicinal Chemistry, University of Cambridge, Robinson Way, Cambridge, CB2 2PZ, UK
Received 17 December 2002; received in revised form 10 June 2003; accepted 1 July 2003
Abstract
We have examined the effects of permanent middle cerebral artery occlusion (pMCAO) in marmoset monkeys over 5 months, using behavioural and magnetic resonance imaging (MRI) techniques. Three marmosets were trained on behavioural tests before pMCAO. Shortly after surgery, these marmosets were scanned with T2-weighted (T2W) and diffusion-weighted (DW) MRI. Three, 10 and 20 weeks after
surgery, these marmosets were re-tested on the behavioural tasks and had further MRI sessions to monitor lesion development. This was followed by histological analysis. All these marmosets had a persistent contralesional motor deficit and a spatial neglect which resolved over the 20 weeks of testing. Percentage infarct volume assessed by MRI on the day of surgery and at 20 weeks matched the percentage infarct volume measured histologically at 20 weeks. However, the apparent infarct size at 3 weeks was considerably less than that measured by histological analysis or that measured at the other MRI time points. Additional histological analysis of the brains of two further marmosets removed 3 weeks after pMCAO found considerable infiltration by lipid filled macrophages into the ischaemic zone which may have caused an MRI “fogging” effect leading to an apparent reduction in infarct volume.
© 2003 Elsevier Inc. All rights reserved.
Keywords:Marmoset monkeys; Ischaemia; Magnetic resonance imaging; Behaviour
1. Introduction
Magnetic resonance imaging (MRI) has been used in stroke research to examine the acute oedematous changes that follow cerebral ischaemia in rodents [7,10,16], in cats
[8,18,23] and to a lesser extent in non-human primates
[3,17,26]. Behavioural studies have also been important in the development of neuroprotective and restorative drugs for stroke. However, only a few studies in rodents have com-bined these approaches [6,24]. The ability both to monitor infarct development with MRI and to assess the functional deficits with behavioural techniques in the same animals could be a powerful tool in stroke research. This is partic-ularly so in primates since their larger brain size provides
∗Corresponding author. Tel.:+44-1223-339015; fax:+44-1223-339014.
E-mail address:[email protected] (R.M. Ridley).
1Present address: Wolfson Brain Imaging Centre, Box 65,
Addenbrooke’s Hospital, Hills Road, Cambridge, CB2 2QQ, UK.
2Present address: Department of Pharmacology, University of
Cambridge, Tennis Court Road, Cambridge, CB2 1QJ, UK.
more detailed MRI scans than can be obtained with rodents, the brain architecture and, particularly, the territory of the middle cerebral artery (MCA) is similar in all primates in-cluding man, and motor tasks requiring skilled use of the hand and arm can be used in primates.
We have developed a model of stroke in the marmoset, a species of New World monkey, to assess whether neuro-protective drugs can reduce long-term functional disability
[13–15]. Unilateral occlusion of the proximal M1 segment of the MCA produces a large infarct of the frontal, tempo-ral and parietal cortex, the underlying white matter and the
caudate and putamen [12]. Following this occlusion,
mar-mosets have disabilities similar to some of those seen in stroke patients with damage to the same arterial territory. These include a transient contralesional spatial neglect, and a contralesional hemiparesis which, in the marmosets, does not improve over 10 weeks of testing. The present study was designed to test the feasibility of combining long-term MRI and behavioural techniques in a non-human primate species, to examine the long-term maturation of an experimentally induced infarct in this species, and to look at functional re-covery beyond 10 weeks after an induced stroke.
Five young adult laboratory-bred, common marmosets (Callithrix jacchus), aged∼12 months at the start of the
ex-periment, were used. They were kept within a large colony and had good visual and auditory interaction with other mar-mosets. All procedures were carried out in accordance with United Kingdom Home Office regulations. Three marmosets (A, M and O) had surgical permanent middle cerebral artery occlusion (pMCAO), participated in behavioural assessment and received 4 MRI scans over 20 weeks. Two further mar-mosets received pMCAO and were assessed histologically 3 weeks later.
2.2. Surgery
The marmosets were anaesthetised with 18 mg/kg Saf-fan (alphaxolone [9 mg/ml]/alphadolone acetate [3 mg/ml], 0.15 ml/100 g: Glaxo Vet Ltd., Uxbridge, UK) administered intramuscularly. Under sterile conditions, a large cranial flap was turned, the dura were opened, and the right MCA was occluded and bisected as previously described[15]. The site of occlusion was at the M1 segment of the MCA, 2 mm medial to the olfactory tract [12]. During surgery, blood pressure and heart rate were monitored using an Ultrasonic Doppler Flow Detector (model 811-B; Perimed UK Ltd., Bury St Edmunds, UK) with the probe attached to the tail below an inflatable cuff and pressure gauge. Rectal tempera-ture was also measured, and recordings were taken at 10 min intervals. The marmosets were transported to the MRI unit as soon as the surgery was finished while still under anaes-thetic.
After the MRI scans, the marmosets were returned to the marmoset colony and were kept in incubators to maintain body temperature during recovery from anaesthesia. They remained in the incubators and were hand-fed and watered for 2–3 days until they were capable of self-care. Prophylac-tic antibioProphylac-tic cover was not required. The marmosets were injected with analgesic (Finadyne; Schering-Plough Animal Health Mildenhall UK; 0.01 mg/kg subcutaneously) in the post-operative period as required.
2.3. Behavioural assessment
The behavioural tasks have been described previously
[11], and therefore only a brief description of each task is included here. All behavioural testing was performed in a modified home cage. The marmosets were fed the main part of their normal daily diet after behavioural testing each day but food and water deprivation was not required since the re-wards used in the tasks (marshmallow pieces) are greatly de-sired by the marmosets. Before surgery, all marmosets were familiarised with the tasks after which a formal pre-operative test was performed. The marmosets were then re-tested 3, 10 and 20 weeks after surgery.
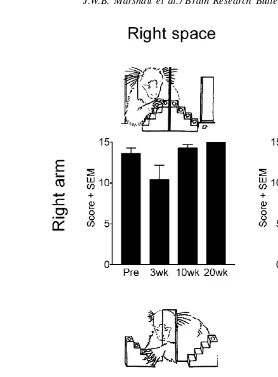
vertical slots in a Plexiglas screen, which was attached to the front of the cage, to retrieve food rewards, placed on the steps of two staircases on the other side of the transparent screen. In the Hill task, there were two laterally positioned slots and the staircases rose towards the centre of the apparatus. The marmosets used their right arm to reach to the right staircase and their left arm was used to reach to the left staircase. In the Valley task, there was one centrally positioned slot and the staircases rose towards the outside of the apparatus. The right arm was used to reach to the left staircase and their left arm was used to reach to the right staircase. Using these two styles of staircase tasks, a motor impairment in one arm can be dissociated from a perceptual impairment in one hemispace (SeeFig. 1).
2.3.2. Six tube search task
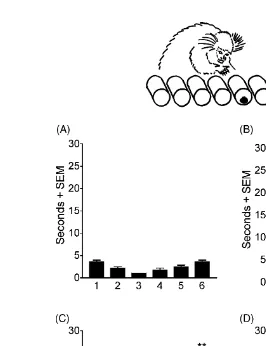
This task measured the time taken for the marmoset to search for and retrieve a single reward hidden, on each trial, in one of the six tubes presented in a horizontal array. The monkey was free to orientate itself towards the array of tubes and to use either hand to retrieve the reward. The tube which contained the reward on each trial was chosen randomly. This is a test of spatial neglect which assesses the ability of the marmoset to orient itself within its environment rather than a test of the spatial boundary of perceptual sensitivity (seeFig. 2).
2.4. Magnetic resonance imaging
The first MRI session was started 4–6 h after pMCAO and continued for approximately 6 h. Follow-up MRI ses-sions were then performed at the end of each post-operative behavioural testing period: 3, 10 and 20 weeks after surgery. For imaging, the marmosets were maintained under Saffan anaesthesia, administered either intravenously at approx-imately 0.2 ml/h via the tail vein, or intramuscularly, as required (approximately 0.2 ml/h). Throughout all MRI sessions, heart rate was monitored by pulse oximetry and temperature was kept constant with a rectal thermosister linked to a homeothermic blanket, in which the marmoset was partially wrapped. The marmoset’s head was inserted into a 4.35 cm internal diameter 8-strut quadrature birdcage design, custom-built radio-frequency probe.
MRI was performed with an Oxford Instruments 31 cm horizontal bore, 2.0 T superconducting magnet, driven by a Bruker MSL100 console using TOMIKON software. Pilot images were obtained to ensure correct positioning of the target images (fast refocused gradient-echo, repeti-tion time (TR) = 100 m s, echo time (TE) = 10 m s, flip angle = 30◦, number of excitations per scan (Nex)
= 2
with 38 s/scan). The target images covered the entire lesion
(field of view (FoV) = 6 cm, slice thickness = 2 mm).
Fig. 1. Mean score achieved by marmosets A, M and O on the Hill and Valley staircase tasks, before surgery and 3, 10 and 20 weeks after surgery. pMCAO was performed in the right hemisphere. The results were analysed by ANOVA followed by post hoc Newman–Keuls analysis, comparing post-lesion scores with appropriate pre-operative score.∗∗P <0.01.
2500 m s, TE = 54 m s, Nex = 2) were acquired using
a Stejskal-Tanner sequence with a diffusion weighting of 900 s/mm2. T2-weighted (T2W) images were acquired
im-mediately before the DW images, using the same sequence but without the diffusion gradients. Apparent diffusion
co-efficient (ADC) maps were obtained from the T2W and DW
images.
DW imaging detects reduced movement of water molecules during cytotoxic oedema which results from stroke and can be seen early after the stroke when the T2W
image remains normal. The areas of oedema appear bright and are likely to be the areas with most severe damage and
which are likely to die. T2W images may detect a number
of pathological features, so ADC maps are calculated from the MRI scan since only ischaemia results in reduced ADC. Image analysis was carried out using the in-house soft-ware CMRVIEW. Lesion volumes were calculated from the
ADC maps at the post-surgery time point, and from T2W
images thereafter, by manually drawing around the outline of the hypointense area of each slice and measuring its area,
as well as that of the two hemispheres. In order to compare the lesion volume derived from the MRI with that from the histological sections (see below), the area of lesion on each MRI slice was determined by subtracting the area of the hypointense region from the area of the ipsilesional hemi-sphere, and subtracting this amount from the size of the con-tralesional hemisphere. Area measurements were then inte-grated across the anterior–posterior levels to calculate per-centage lesion volume.
2.5. Quantitative histological analysis
After the final MRI session, the marmosets were deeply anaesthetised and were perfused transcardially with 200–300 ml of saline followed by 250–300 ml of 10% for-mal saline. The brains were removed and immersed in 10% formal saline. Coronal sections (8m) were taken at various
Fig. 2. Mean time for marmosets A, M and O to find the food reward hidden in one of the six tubes in a horizontal array (A) before pMCAO; (B) 3 weeks after pMCAO; (C) 10 weeks after pMCAO and (D) 20 weeks after pMCAO. The results were analysed by ANOVA followed by post hoc Newman–Keuls analysis, comparing performance on each tube with the appropriate pre-operative score,∗∗P <0.01.
Solochrome cyanin stained sections, at approximately 2.0 mm intervals through the brain from A 14.5 to P 1.5 of the stereotaxic atlas[22], were videocaptured with a dig-ital camera connected to a Leica M420 Wild macroscope. Using a computerised image analysis system (Global Lab Image, Data Translation Ltd., UK), the area of the remain-ing ipsilesional hemisphere, excludremain-ing areas of peri-infarct damage and tissue loss, delineated by microscopic analysis of the sections, was measured. The area of tissue damage at each level was calculated by subtracting this measure from the area of the contralesional hemisphere. Area mea-surements were integrated across the levels to produce volume measurements for the lesion and for the contrale-sional hemisphere. The lesion volume as a percentage of hemispheric volume was then calculated.
2.6. Additional histology
Once the MRI results had been analysed, we realised that there was a need for some additional histology from earlier reference points to understand the progression of pathology. However, to undertake a quantitative statistical study
(com-paring histology immediately after surgery, at 3, 10 and 20 weeks after pMCAO) would require upwards of six sub-jects per group, i.e. a total of 24 animals. This highlights the benefit of MRI in reducing numbers of animals needed for such timeframe studies. Since a large histological study was neither feasible nor warranted, it was decided to under-take a more qualitative study to examine the pathological state of the brain 3 weeks after pMCAO in this species. Two marmosets therefore received pMCAO and were perfused 3 weeks later, prior to histological examination of the brains.
3. Results
3.1. Behavioural assessment
3.1.1. Hill and the Valley staircase tasks
The results are shown inFig. 1. Three factorial analysis of variance (ANOVA) was used to examine the data using
arm(ipsilesional versus contralesional),staircase(Hill ver-sus Valley) andtime(Pre-op, 3, 10 and 20 weeks) as factors. ANOVA revealed a significant arm×staircase×time interac-tion [F(3,24)=5.736,P <0.01]. Post hoc Newman–Keuls analysis was used to compare performance at each time af-ter surgery with pre-operative performance. Pre-operatively marmosets performed these tasks with ease, successfully
re-trieving most pieces of reward (maximum score=15) well
within the time allotted using either their left or right arms. On all test sessions following pMCAO, the marmosets were unable to perform the task using their left, contralesional arm, on both staircase tasks, i.e. reaching into contralesional and ipsilesional space. This demonstrates a persistent motor impairment in the contralesional arm.
Although the marmosets were not impaired at reaching with their right, ipsilesional arm into ipsilesional space on the Hill task, they were impaired at reaching with their ip-silesional arm into contralesional space on the Valley task at 3 weeks, to a lesser extent at 10 weeks, but not at 20 weeks, after surgery. This demonstrates a temporary perceptual ne-glect of contralesional hemispace.
3.1.2. Six tube search task
The results are shown in Fig. 2. These data were
anal-ysed by two factorial ANOVA withposition(tubes 1–6) and
testing phase(Pre-op, 3, 10 and 20 weeks) as factors. There was a significantposition×testing phaseinteraction effect [F(5,15) = 14.610, P < 0.01]. Post hoc Newman–Keuls analysis was used to compare performance at each time af-ter surgery with pre-operative performance. Pre-operatively, the marmosets rapidly became accustomed to this test, and were quick to find rewards wherever they were hidden, al-though the marmosets were marginally quicker at finding rewards hidden in the middle tubes of the array than in the outer ones. When first tested after pMCAO, the marmosets had severe contralesional hemineglect. Not only did they fail to find rewards hidden in the tubes on the contralesional side of the array, they were also impaired at finding rewards in any tube other than the most ipsilesional tube, to which they had a marked attraction. By 10 weeks, there was some recovery, but the marmosets were still significantly slower at finding rewards hidden in either of the two most contrale-sional tubes than they had been pre-operatively. The mar-mosets had recovered 20 weeks after surgery.
3.2. MRI
It took several hours after the stroke had been induced to complete the surgery, transport the marmosets to the MRI unit, and adjust the scanner. Therefore, the first time points
at which T2W and diffusion-weighted (DW) images could
be acquired were∼4.5 h after pMCAO for marmoset M and
∼7.5 h for marmosets A and O. Lesions were not clearly
visible at these time points in T2W images. T2W scans are
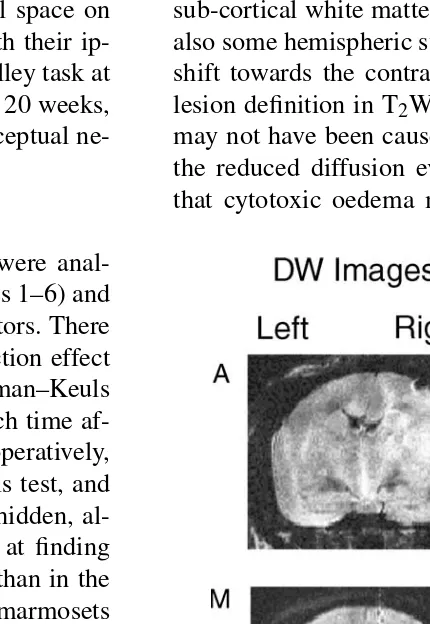
sensitive to static tissue water, so the absence of hyperin-tensity in the first scan suggests that there was little acute vasogenic oedema. Although the lesions were not visible, it was possible to see in the 7.5 h T2W images (see Fig.
4 for marmoset O) that the scalp was hyperintense, due to
vasogenic oedema from surgical trauma. Hyperintense re-gions could be detected in DW images at this time, suggest-ing reduced diffusion. Restricted water protons experience relatively less variation in the magnetic gradient and retain the coherence of their spins, thereby increasing signal in-tensity. ADC maps most clearly delineated the affected ar-eas at this time and showed non-uniform hypointense arar-eas. This reduction in ADC in the lesioned hemisphere compared with the other hemisphere, as mentioned above, suggests de-creased water diffusion throughout the affected areas. The areas affected in the lesioned hemisphere included frontal, temporal and parietal cortex, as well as the striatum and sub-cortical white matter in all three marmosets. There was also some hemispheric swelling, which resulted in a midline shift towards the contralesional left hemisphere. The poor lesion definition in T2W images suggests that this swelling
may not have been caused by vasogenic oedema. However, the reduced diffusion evident in the ADC maps indicates
that cytotoxic oedema may have been responsible. Fig. 3
(the third marmoset was not scanned at this time because it was not fit for the prolonged anaesthesia required). There were noticeable differences between the two hemispheres in
both T2W and DW images. The loci of damage were similar
to those detected on the day of surgery. The T2W images
clearly showed non-uniform hyperintense regions. The DW and ADC images demonstrated heterogeneous lesions, with patches of hypo- and hyperintensity. In the more posterior sections, the major change was an increase in volume of the lateral ventricle. Anterior to stereotaxic level A 4.5, there was considerable cortical damage extending from the motor and parietal cortex to the frontal cortex. In all slices, the ipsilesional lateral ventricle was enlarged, and there was a small midline distortion towards the ipsilesional hemisphere,
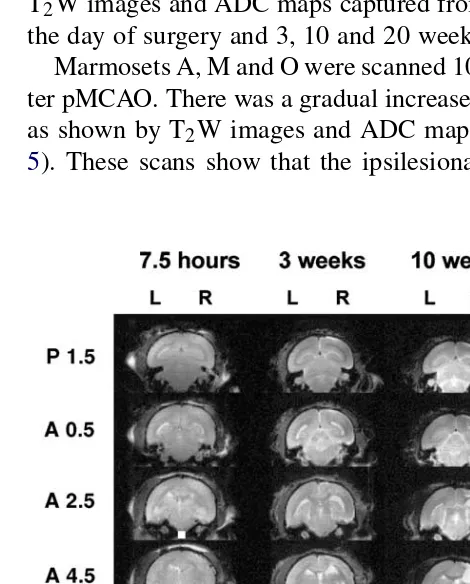
which was shrunken.Figs. 4 and 5show complete sets of
T2W images and ADC maps captured from marmoset O on
the day of surgery and 3, 10 and 20 weeks after surgery. Marmosets A, M and O were scanned 10 and 20 weeks af-ter pMCAO. There was a gradual increase in the infarct size
as shown by T2W images and ADC maps (seeFigs. 4 and
5). These scans show that the ipsilesional lateral ventricle
Fig. 4. Complete set of T2-weighted images from marmoset O at
stereo-taxic levels A 14.5–P1.5 obtained 7.5 h, 3, 10, and 20 weeks after pM-CAO. The lesion can be seen as a bright area in the upper right quadrant of the coronal sections, particularly at levels A 14.5–A 6.5 at 3 weeks, A 14.5–A 2.5 at 10 weeks and A 14.5–A0.5 at 20 weeks. The lesion is not visible 7.5 h after surgery. Scale bar=20 mm.
Fig. 5. Complete set of ADC maps from marmoset O at stereotaxic levels A 14.5–P1.5 obtained 7.5 h, 3, 10 and 20 weeks after pMCAO. The lesion can be seen as a bright area in the upper right quadrant of the coronal sections, particularly at levels A 10.5–A 6.5 at 3 weeks, A 14.5–A 2.5 at 10 weeks and A 14.5–A 0.5 at 20 weeks. The lesion is visible as a dark area in the same place at 7.5 h after surgery. Scale bar=20 mm.
was substantially enlarged and the damaged tissue had been largely replaced by a fluid-filled cyst. There was extensive damage to all cortical regions, especially the motor cortex, the dorsal part of the temporal cortex, and some of the pari-etal cortex. There was damage to the corona radiata and the external capsule. At both 10 and 20 weeks, the ipsilesional hemisphere was smaller than the contralesional hemisphere.
3.3. Histology
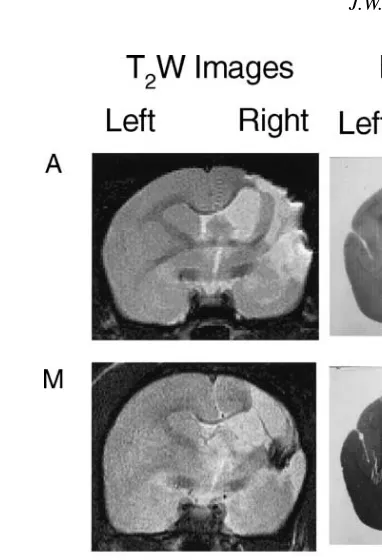
Marmosets A, M and O had extensive infarcts involving the whole of the MCA territory including parts of the frontal, temporal and parietal cortex, the underlying white matter and the caudate and putamen. The areas of tissue loss and damage in the histological sections closely matched those
areas seen in the MRI scans. Fig. 6 shows T2W images
acquired at 20 weeks and the corresponding histological sections from marmosets A, M and O.
3.4. Comparison of MRI and histology
Fig. 6. T2W image captured 20 weeks after pMCAO and corresponding
histological sections stained with solochrome cyanin from marmosets A, M and O.
The average percentage volume of damage (i.e. comparing the volume of the lesioned hemisphere to the unlesioned hemisphere between stereotaxic levels A14.5–P1.5) was
cal-culated from ADC maps, T2W images or histological
sec-tions between the stereotaxic levels A14.5–P1.5 (seeFig. 7). ADC maps constructed on the day of surgery were good predictors of average percentage lesion volume as measured histologically after 20 weeks. MR images acquired 3 weeks after pMCAO were predictive of lesion location but showed a marked reduction in apparent lesion volume. Ten weeks after pMCAO, lesion volume had increased and was approx-imately the same as that estimated on the day of surgery. There was a small increase in lesion volume by 20 weeks which closely matched that estimated by histological anal-ysis.
3.5. Additional histology
An examination of the two brains perfused 3 weeks af-ter pMCAO revealed areas of tissue degradation in the same brain areas which comprised the infarct in the marmosets killed 20 weeks after surgery. In agreement with the size of the lesion as shown by serial MRI scans, the area of tissue damage was not as large as that seen in other marmosets at 20 weeks. However, at this immature stage of lesion de-velopment it is difficult to predict how much tissue would eventually be lost. It is likely that the lesion in these mar-mosets was similar to that seen in marmar-mosets A, M and O.
Fig. 7. Average percentage volume of damage as estimated by MRI at different time points after surgery or by histology measured at 20 weeks after surgery. Comparison of the apparent lesion volume at different time points in the first four columns should be made with the post-mortem lesion volume as shown in the right hand column. The histogram is the mean of two marmosets, A and O. Marmoset A is shown as squares, and marmoset O is shown as circles. Marmoset M could not be scanned at all time points but scans for marmoset M on the day of surgery and at 20 weeks are shown inFigs. 3 and 6. The ADC map was used to calculate the lesion size 7.5 h after surgery since the lesion was not visible on T2W
images at that time. At 3, 10 and 20 weeks the measurements made with ADC or T2W were very similar but the T2W images were clearer and
more detailed, providing more accurate estimates of damage. The lesion looked smaller in both ADC and T2W images at 3 weeks than it did at
10 weeks.
The lesion area in the two brains examined histologically at 3 weeks was partially filled with large round fluid filled cells, seeFig. 8. In the early development of this model, we had identified cells with this morphology using RC120 (a lectin stain) as being lipid filled macrophages. It is likely that 3 weeks after pMCAO, the area which will develop into a cyst becomes infiltrated and occupied by macrophages. As these macrophages clear the necrotic tissue, they become lipid filled. This would reduce the hyperintensity in the MRI scans and therefore reduce the apparent lesion size.
stroke in marmosets and have assessed infarct development and progression of the behavioural deficits over a 5-month period. We have shown that the motor deficit is a persis-tent disability whereas the spatial neglect ameliorates with time. We have reported previously on the deficits seen in the Staircase and Six Tube Search tasks when the marmosets
were tested up to 10 weeks after pMCAO[11–15]. We have
now extended the test period to 20 weeks and have shown that while the spatial neglect does ameliorate with time, the motor disability extends to at least 20 weeks after surgery. In man, there can be continued recovery of motor function many months after a stroke, and it is possible that the mar-mosets would show improvement of the motor disability if given a longer time to recuperate. Nonetheless, this study confirms that there is dissociation in time between recovery from motor disability and recovery from neglect, implying that they have different neural substrates.
The T2W images revealed little evidence of the lesion
on the day of surgery, although damage was more obvious on the DW images. This is consistent with data from stud-ies in rats[5,9]and stroke patients[25]. T2W imaging has
been used to demonstrate the presence of vasogenic oedema due to blood–brain barrier breakdown as early as 3.75 h post-occlusion in the rat photothrombotic model[10], but it is less sensitive in MCAO models where there is less dam-age to the blood–brain barrier, and where the time course of lesion development is slower. The ability of DW protocols to delineate lesions at early time points may be due to reduced water diffusion related to cytotoxic oedema[2]. Interruption of the blood supply leads to an acute shortfall in oxygen and energy that compromises cell metabolism, causing loss of cellular osmoregulation. Water then moves from extracel-lular to intracelextracel-lular compartments which have lower ADC values, due to the relative restriction of water protons by in-tracellular components such as mitochondria and endoplas-mic reticulum[19]. Lack of perfusion and hydrostatic pres-sure in the territory of the occluded MCA may also decrease the net mobility of water. Although the actual oedema could be seen most clearly in the DW images, the consequences, in terms of tissue swelling, could be identified in both the
T2W and the DW images. There was a midline shift of the
ipsilesional hemisphere towards the contralesional side. After 3 weeks, the ipsilesional hemisphere had shrunk with a corresponding increase in the size of the lateral ven-tricle. Quantitative analysis showed that the lesion volume was apparently greatly reduced. This phenomenon has been reported in rats[4,20,24]and was thought to result from an over-estimate of lesion size in the immediate aftermath of the ischaemic onset due to tissue oedema and swelling. This is part of a four-stage pathological process of infarct develop-ment that starts with neuronal death, and leads to inflamma-tion, re-organisation and finally, resolution which is thought
considered to be complete. The marmosets in this study were scanned 3 weeks after their induced stroke, and it might have been supposed that the infarct would then be near the end of its development and stable in size. It was therefore surpris-ing that when the marmosets were re-scanned 10 weeks after pMCAO, the lesion volume had increased and had returned to that estimated from the ADC maps acquired on the day of surgery. However, it has been reported in a few human stud-ies that an apparent decrease in T2W lesion volume occurs
between 1 and 3 weeks after stroke[1,21]. This phenomenon has been named “MRI fogging”, and although its origins are not clear, it may be due to (a) magnetically active erythro-cytes leaking out of pathologically altered blood vessels 2–3 weeks post-ischaemia and/or (b) the replacement of dam-aged tissue with scavenging, lipid-laden macrophages and a decrease in bulk water[21]. Either of these would lead to masking of the true extent of the lesion when examined us-ing MRI. Our additional histological analysis made 3 weeks after surgery supports the role that macrophages may play in this “fogging” effect since there was considerable infiltration by macrophages into the area of necrotic tissue breakdown. Once lipid-filled, these macrophages would displace water
reducing the size of damage detected on the T2W image.
When the number of macrophages have returned to normal, the true extent of the lesion would again become apparent on T2W images. Our MRI results at 10 weeks fit well with
this theory.
At 20 weeks, volumetric analysis showed that there had been a further apparent increase in infarct volume, although this increase was not as large as that observed between 3 and 10 weeks. The infarct and ventricle had become confluent and a large fluid-filled cyst had formed. Following this last imaging session, the marmosets were perfused and the vol-ume of infarct was calculated from the histological sections. Percentage measurements were made to allow comparison between the MR images and the histology as the fixing and embedding process had caused considerable shrinkage of the tissue. Using this calculation, the proportion of ischaemic damage seen in the 20 week images, assessed from either
T2W images or ADC maps, closely matched that calculated
from the histological sections.
the onset of stroke before being treated with a putative ther-apeutic agent, then the MRI data could be used to match the original damage between different treatment groups, thus reducing the number of animals needed for each study. Fur-thermore, an indication from these early scans of the likely infarct size if left untreated would allow estimation of the therapeutic value of neuroprotective treatment within each animal.
References
[1] R. Asato, R. Okumura, J. Konishi, “Fogging” effect in MR of cerebral infarct. Case report, J. Comput. Assist. Tomogr. 15 (1991) 160–162. [2] H. Benveniste, L.W. Hedlund, G.A. Johnson, Mechanism of detection of acute cerebral ischaemia in rats by diffusion-weighted magnetic resonance microscopy, Stroke 23 (1992) 746–754.
[3] D.P. Boisvert, E.D. Hall, Tirilazad prevention of reperfusion edema after focal ischemia in cynomolgus monkeys, Can. J. Neurol. Sci. 23 (1996) 46–52.
[4] R.K. Clark, E.V. Lee, C.J. Fish, R.F. White, W.J. Price, Z.L. Jonak, G.Z. Feuerstein, F.C. Barone, Development of tissue-damage, in-flammation and resolution following stroke—an immunohistochem-ical and quantitative planimetric study, Brain Res. Bull. 31 (1993) 565–572.
[5] M. Forsting, W. Reith, A. Dorfler, R. Vonkummer, W. Hacke, K. Sartor, MRI in acute cerebral-ischemia—perfusion imaging with su-perparamagnetic iron-oxide in a rat model, Neuroradiology 36 (1994) 23–26.
[6] R. Gerlai, H. Thibodeaux, J.T. Palmer, M.V. Campagne, N. Van Bruggen, Transient focal cerebral ischemia induces sensorimotor deficits in mice, Behav. Brain Res. 108 (2000) 63–71.
[7] M.L. Gyngell, T. Back, M. Hoehn-Berlage, K. Kohno, K.-A. Hoss-mann, Transient cell depolarisation after permanent middle cerebral artery occlusion: an observation by diffusion-weighted MRI and lo-calised 1H-MRS, Magn. Reson. Med. 31 (1994) 337–341. [8] H. Ide, H. Kobayashi, Y. Handa, T. Kubota, M. Maeda, S. Itoh,
Y. Ishii, Correlation between somatosensory-evoked potentials and magnetic resonance imaging of focal cerebral ischemia in cats, Surg. Neurol. 40 (1993) 216–223.
[9] R.A. Knight, M.O. Dereski, J.A. Helpern, R.J. Ordidge, M. Chopp, Magnetic-resonance-imaging assessment of evolving focal cerebral-ischemia—comparison with histopathology in rats, Stroke 25 (1994) 1252–1261.
[10] V.E. Lee, N.G. Burdett, A.C. Carpenter, L.D. Hall, P.S. Pambakian, S.P. Patel, N.I. Wood, M.F. James, Evolution of photochemically in-duced focal cerebral ischemia in the rat: magnetic resonance imaging and histology, Stroke 27 (1996) 2110–2119.
[11] J. Marshall, K.J. Duffin, A.R. Green, R.M. Ridley, NXY-059, a free radical trapping agent, substantially attenuates the functional
disability induced by stroke in a primate species, Stroke 32 (2001) 190–198.
[12] J.W.B. Marshall, A.J. Cross, D.M. Jackson, A.R. Green, H.F. Baker, R.M. Ridley, Clomethiazole protects against hemineglect in a primate model of stroke, Brain Res. Bull. 52 (2000) 21–29.
[13] J.W.B. Marshall, A.J. Cross, R.M. Ridley, Functional benefit from clomethiazole treatment after focal cerebral ischaemia in a non-human primate species, Exp. Neurol. 156 (1999) 121–129. [14] J.W.B. Marshall, E.J. Jones, K.J. Duffin, S.H. Curry, R.M. Ridley,
AR-R15896AR, a low affinity, use-dependent, NMDA receptor an-tagonist, is protective in a primate model of stroke, J. Stroke Cere-brovasc. Dis. 9 (2000) 303–312.
[15] J.W.B. Marshall, R.M. Ridley, Assessment of functional impairment following permanent middle cerebral artery occlusion in a non-human primate species, Neurodegeneration 5 (1996) 275–286.
[16] K. Minematsu, L. Li, M. Fisher, C.H. Sotak, M.A. Davis, M.S. Fiandaca, Diffusion-weighted magnetic resonance imaging: rapid and quantitative detection of focal cerebral ischæmia, Neurology 42 (1992) 235–240.
[17] L.H. Monsein, V.P. Mathews, P.B. Barker, C.A. Pardo, S.J. Black-band, W.D. Whitlow, D.F. Wong, R.N. Bryan, Irreversible regional cerebral-ischemia—serial MR-imaging and proton MR spectroscopy in a nonhuman primate model, Am. J. Neuroradiol. 14 (1993) 963– 970.
[18] M.E. Moseley, A.J. de Crespigny, T.P. Roberts, E. Kozniewska, J. Kucharczyk, Early detection of regional cerebral ischemia using high-speed MRI, Stroke 24 (1993) I60–I65.
[19] T. Niendorf, D.G. Norris, D. Leibfritz, Detection of apparent re-stricted diffusion in healthy rat brain at short diffusion times, Magn. Reson. Med. 32 (1994) 672–677.
[20] L. Persson, H.G. Hardemark, H.G. Bolander, L. Hillered, Y. Olsson, Neurologic and neuropathologic outcome after middle cerebral-artery occlusion in rats, Stroke 20 (1989) 641–645.
[21] A. Scuotto, S. Cappabianca, M.B. Melone, G. Puoti, MRI “fogging” in cerebellar ischæmia: case report, Neuroradiology 39 (1997) 785– 787.
[22] H. Stephan, G. Baron, W. K. Schwerdtfeger, The Brain of the Com-mon Marmoset (Callithrix jacchus): a Stereotaxic Atlas, Springer, Berlin, 1980.
[23] G.R. Sutherland, J.T. Perron, P. Kozlowski, D.J. McCarthy, AR-R15896AR reduces cerebral infarction volumes after focal is-chemia in cats, Neurosurgery 719–20 (46) (2000) 710–719. [24] D. Virley, J.S. Beech, S.C. Smart, S.C.R. Williams, H. Hodges,
A.J. Hunter, A temporal MRI assessment of neuropathology after transient middle cerebral artery occlusion in the rat: correlations with behavior, J. Cereb. Blood Flow Metab. 20 (2000) 563–582. [25] S. Warach, J. Gaa, B. Siewert, P. Wielopolski, R.R. Edelman, Acute
human stroke studied by whole-brain echo-planar diffusion-weighted magnetic-resonance-imaging, Ann. Neurol. 37 (1995) 231–241. [26] A. Young, O. Touzani, J.-M. Derlon, G. Sette, E. MacKenzie, J.-C.