Optimization of Cutting Parameters When Machining of
Magnesium AZ31 Using Box Behnken Design
1
G.A. Ibrahim, A. Hamni
2, Y. Burhanudin
3and W. Nadhira
4Department of Mechanical Engineering, Faculty of Engineering, University of Lampung *email : [email protected]
Abstract. Magnesium alloy is one type of metals that is currently widely used to replace various components in the biomedical field, but because of its low melting point. special attention is required during the machining process of magnesium alloy. This study aims to optimize machining parameters specifically cutting speed, feed rate and rotary tool speed. Analyze was done by using Response Surface Method of Box Behnken Design. The rotary turning of magnesium AZ31 was done to achieve minimum wear value on the cutting tool. The use of pressurized cold air was also applied to this study to reduce the temperature between work piece and rotary cutting tool. Based on the analysis using Response Surface Method of Box Behnken Design obtained, the optimum value for the minimum tool wear in the amount of 0,27728 mm at cutting speed of 80 m/min, feeding speed of 0,1 mm/rev and rotary tool speed of 45,7071 rotation/min. The mathematical modeling obtanied is Vb = 0.3550 + 0.000797 Vc + 0.3950 f - 0.008159 Vt + 0.000090 Vt*Vt.
Key words: magnesium AZ31, rotary tool, tool wear, Box Behnken Design
INTRODUCTION
Magnesium and its alloys are metals that have good cutting characteristics such as low specific cutting strength, short chip pieces, low tool wear and high surface quality. So many used as metal substitute components of steel and aluminum [1,2]. However, the weakness possessed by magnesium is its combustible character, especially at the time of cutting speed and high feeding speed [1]. So that proper machining parameters are needed to reduce the heat during machining process. Research conducted by Ibrahim (2010) states that turning process of lightweight material by using dry machining can reduce the temperature during machining process so as to reduce the wear rate in the edge of cutting tool [3].
To obtain optimum parameters in machining process can also be done by using statistical analysis. One of them is the Response Surface Method Box Behnken Design (BBD). The Response Surfce Method is a set of statistical and mathematical techniques that are very useful for modeling and analysis applications where the desired response by some variables and responses is to optimize the output response [4]. Box Behnken Method is an experimental design formed from a combination of two level factorial and incomplete bock design which can be used for 3 to 12 and 16 factors. In BBD, there are several repetitions that can be combined against all factor levels. In some experiments there is interaction between factors when there is a difference in response from a level on a factor that is not the same at each level in the other factor [5,6].
Box Behnken design has no axial or star runs in its design so this method is more efficient for designing because fewer experiments [7]. Kanlayasiri investigate the optimization of machining parameters on machining K460 tool steel, where this research using three factors studied are cutting speed, peak current, and offset distance. While the response is the accuracy of dimensions and surface roughness. The results show that peak current and offset distances have a significant effect on the dimensions of the specimen and only peak currents affect the surface roughness [8].
METHODOLOGY
Research is done by using Surface Response Method (Box Behnken Design) to get the proper parameter so that the optimum condition for turned machining process of magnesium AZ31using actively driven rotary tool is obtained resulting in minimal tool wear. Data retrieval was done based on experimental design of Box Behnken Design which then analyzed using MINITAB 17 software.
With the number of 3 parameters that each parameter has 3 levels obtained the number of test samples as much as 15 times, as shown in Table 1 and Table 2. Where the number of test samples can be known by entering directly the number of parameters to be used into the software MINITAB 17 or by using the equation [9]
𝑁 = 2𝑘(𝑘 − 1) + C0 (1).
Where N is the number of test samples, k is the number of parameters to be used and C0 represents
the number of midpoints. Figure 1 shows that machining process be done using rotary cutting tool with diameter of 18 mm. The cutting tool used in the experiment is carbide round insert with coating layer.
FIGURE 1. The machining process of magnesium AZ31 using rotary tool
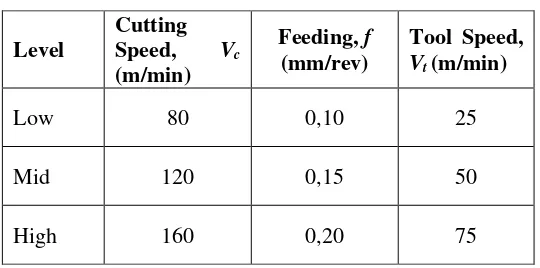
Table 1. Machined factor with each levels
Level
Cutting Speed, Vc
(m/min)
Feeding, f (mm/rev)
Tool Speed, Vt (m/min)
Low 80 0,10 25
Mid 120 0,15 50
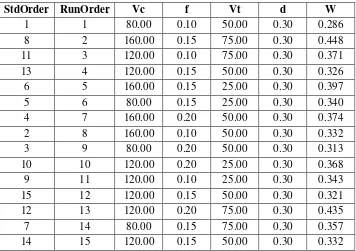
Table 2. Design experimental table
Table 3 is one set of experimental result data when cutting by using rotary tool. The number of data are fifteen with each selected parameters. After one pass machining, the wear of tool (Vb) was recorded and following to next turning until the Vb reached 0.3 mm. cales on magnesium AZ31 lathe machining process.
Table 3. Data of measurement result of rotary tool wear
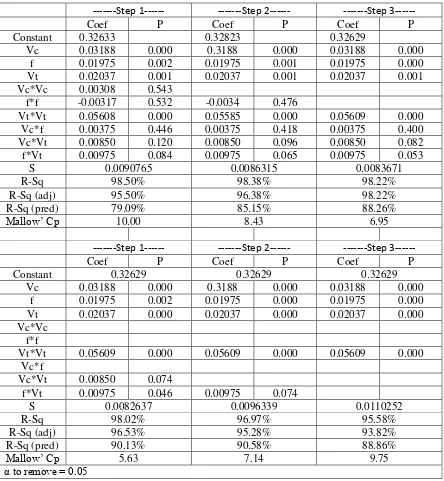
Table 4 shows that the cutting speed, feeding and speed of the rotary tool shown with p-value on each parameter. In the engineering experimental case, the significant value selected is 5%. With a confidence level of 95%, the statistically significant parameters will have a p-value of less than 0.05, which means if p-value ≤ 0.05 then independent variables have a statistically significant effect on dependent variables, otherwise if p-value ≥ 0.05 then independent variable does not influence statistically to dependent variable [10].
Table 4 also shown the steps of analysis by backward method to get the significant values of each parameters. The stepping from 1 until 6 were done repetitively. At the step of 6, the significant values for all parameters are significant, because all values are lower the 0.05. So, based on Table 4 we get a mathematical model for magnesium AZ31 with turning by using rotary cutting tool as followed Vb = 0.3550 + 0.000797 Vc + 0.3950 f - 0.008159 Vt + 0.000090 Vt*Vt
Table 4. Response surface regression of Vb vs Vc, f, Vt with Backward Elimination of Terms
---Step 1--- ---Step 2--- ---Step
3---Coef P Coef P Coef P
Constant 0.32633 0.32823 0.32629
Vc 0.03188 0.000 0.3188 0.000 0.03188 0.000
S 0.0090765 0.0086315 0.0083671
R-Sq 98.50% 98.38% 98.22%
Constant 0.32629 0.32629 0.32629
Vc 0.03188 0.000 0.3188 0.000 0.03188 0.000
S 0.0082637 0.0096339 0.0110252
R-Sq 98.02% 96.97% 95.58%
R-Sq (adj) 96.53% 95.28% 93.82%
R-Sq (pred) 90.13% 90.58% 88.86%
Mallow’ Cp 5.63 7.14 9.75
Where if one of the independent variables increases as much as one percent and the other independent variable remains, then any one percent increase in the cuting speed will increase the value of the rotary tool wear by 0.000797%. Likewise, if the feeding increased in one percent will raise 0.3950% the value of rotary tool wear, if the speed of rotary tool increased one percent will decrease the tool wear value by 0,008159% and if the rotary tool speed is raised one percent then it will raise the value of rotary tool wear by 0.000090%. Some tests were done to see the suitability of the model that is coefficient of determination test (R2), lack of fit and F test. The coefficient of
determination test is done to see how big the prediction model influences the response variable [11]. The coefficient value of determination is 95.58%, so the linear model of cutting speed parameters, rotary tool speed, feeding and quadratic model of rotary tool speed affect the value of tool wear significantly by 95.58%.
The test of lack of fit is performed to show the accuracy of the test result model. If the value of
lack of fit is greater than the value of α then the model is acceptable [12]. The value of lack of fit
occurs at 0.185, where the value is greater than α = 0.05 so it can be said that first order linear model
is appropriate and appropriate to the given model. F test can also be done to find out whether the regression model of analysis result can be accepted or not. If the value Fcount> Ftable then the regression
model can be accepted [13]. Where Fcount is 54.12 and for F
table is 3.89. Which means that the
regression model of the results of the analysis made acceptable.
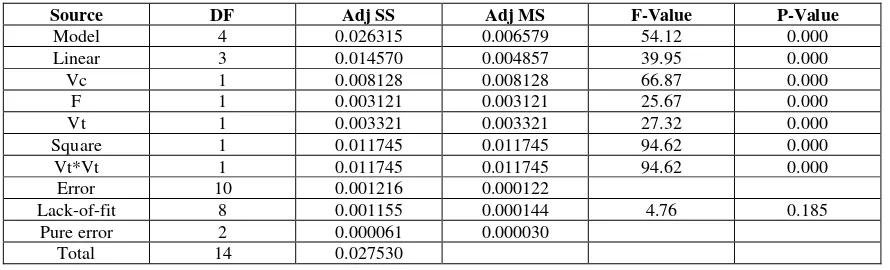
Table 5 shows the analysis variance of tool wear on the cutting edge of the tool when machining of magnesium AZ31 using rotary cutting tool at various cutting parameter based on Box Behnken Design. Fron the Table 5, all P-value of each factor in the machining process are 0.000 (or lower than 0.05). it means that all factor give significantly contribution on the wear on the edge of the cutting tool. For individual factor, speed of work piece, feed rate, and speed to tool are significant contribution. Whereas, for interaction factor, quadratic of speed of cutting tool factor give significant effect on the tool wear.
Table 5. Analysis Variance (ANOVA) for cutting tool wear (Vb)
Figure 2. Graph for identical residuals
Figure 3. Graph of residual test results normally distributed
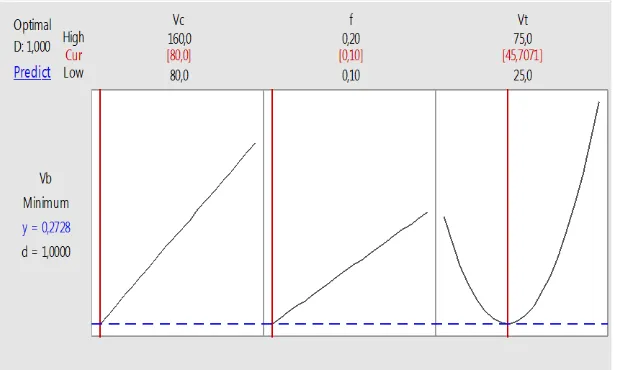
Based on mathematical modeling, the optimum condition for turning of magnesium alloy AZ31 was done using rotary cutting tool with tool wear of 0,277 mm. Machining condition was took place at cutting speed of 80 m/min, feed rate of 0,10 mm/rev and rotary tool speed of 45,77 rotation/as shown in Figure 4.
CONCLUSIONS
Based on the analysis using Response Surface Method Box Behnken Design for rotary tool turning process of magnesium AZ31, that the prediction of the optimum condition of the machining parameters is at the cutting speed of 80 m/min, the feed rate of 0.10 mm/rev and the rotary tool speed of 45.7071 rotation/min. The prediction value of tool wear obtained is 0.27728 mm. Where cutting speed, feed rate and speed of rotary tool have statistically significant effect to tool wear an shown by coefficient of determination model of 95.58%. it has an effect on to response variable and p-value at each paramter less than 0,05. A mathematical model that can be used to find tool wear value based on statistical analysis Response Surface Method Box Behnken Design on rotary tool process of magnesium AZ31 is following Vb = 0.3550 + 0.000797 Vc + 0.3950 f - 0.008159 Vt + 0.000090 Vt*Vt
ACKNOWLEDGMENTS
These authors acknowledge the financial support from Directorate General of Higher Education of Ministry of Research and High Education of Indonesia. The acknowledgment is addressed to University of Lampung which facilitated the equipment to finish this experiment
REFERENCES
[1] Kalpakjian, S. (2009). Manufacturing Engineering and Technology sixth edition. New York: Pearson.
[2] Su, J., dkk. (2015). Characteristics of magnesium AZ31 alloys subjected. Materials Science & Engineering A, 582-592
[3] Ibrahim, G. A., Che Haron, C. H., & Ghani, J. A. (2010). Tool Wear Mechanism in Continous Cutting of Difficult-to-Cut Material under Dry Machining. Advance Materials Research Vols. 126-128, 195-201.
[4] Montgomery, D. (2013). Statistical Quality Control: A Modern Introduction, Seventh edition. Singapore: Jhon Wiley and Sons.
[5] Nguyen, N., & Borkowski, J. J. (2008). New 3-level Response Surface Designs Costructed from Incomplete Block Designs. Statistical planning and inference, 294-305.
[6] Tekindal, M. A., dkk. (2012). Box - Behnken experimental design in factorial experiments: the importance of bread for nutrition and health. Turkish Journal of Field Corps, 115-123.
[7] Endang, P. P. & Pilarian, F. (2013). Optimasi parameter proses pemotongan stainless steel SUS 304 untuk kekasaran permukaan dengan metode response surface.
[8] Kanlayasiri, K. & Jattakul, P. (2013). Simultaneous optimization of dimensional accuracy and surface roughness for finishing cut of wire-EDMed K460 tool steel. Precision Engineering, 556-561. [9] Ferreira, S. L. C. (2007). Box-Behnken design: An alternative for the optimization of analytical methods. Analytica Chimicia Acta 597, 179-186
[10] Minitab. (2017). Minitab 17. Retrieved January 26, 2017, from Minitab web site: http://www.support.minitab.com
[11] Wahyono, R. E. S. (2012). Pengaruh corporate governance terhadap manajemen laba di industri perbankan Indonesia. Jurnal Ilmu & Riset Akuntansi Vol. 1 No. 12, 1-22.
[12] Winhaju, Wiwiek Setya. 2013. Analisis Variasi dan Statistik Matematika Yang Terkait. ITS. Surabaya.