Policy Model of Sustainable Infrastructure Development (Case Study :
Bandarlampung City, Indonesia)
To cite this article: C Persada et al 2018 IOP Conf. Ser.: Earth Environ. Sci.124 012008
Policy Model of Sustainable Infrastructure Development
(Case Study : Bandarlampung City, Indonesia)
C Persada1, S R P Sitorus2, Marimin2, and R D Djakapermana3
1University of Lampung, Bandarlampung, Lampung, Indonesia
2Graduate School, Bogor Agricultural University, IPB Campus Dramaga, Bogor, Indonesia 3Public Works Department, Republic of Indonesia
* E-mail of the corresponding author: [email protected]
Abstract. Infrastructure development does not only affect the economic aspect, but also social and environmental, those are the main dimensions of sustainable development. Many aspects and actors involved in urban infrastructure development requires a comprehensive and integrated policy towards sustainability. Therefore, it is necessary to formulate an infrastructure development policy that considers various dimensions of sustainable development. The main objective of this research is to formulate policy of sustainable infrastructure development. In this research, urban infrastructure covers transportation, water systems (drinking water, storm water, wastewater), green open spaces and solid waste. This research was conducted in Bandarlampung City. This study use a comprehensive modeling, namely the Multi Dimensional Scaling (MDS) with Rapid Appraisal of Infrastructure (Rapinfra), it uses of Analytic Network Process (ANP) and it uses system dynamics model. The findings of the MDS analysis showed that the status of Bandarlampung City infrastructure sustainability is less sustainable. The ANP analysis produces 8 main indicators of the most influential in the development of sustainable infrastructure. The system dynamics model offered 4 scenarios of sustainable urban infrastructure policy model. The best scenario was implemented into 3 policies consist of: the integrated infrastructure management, the population control, and the local economy development.
Keywords: ANP, city, dynamic model, policy, Rapinfra, sustainability infrastructure
1.Introduction
High population growth in city areas has implications for the improvement of the community infrastructure needs. The relationship between cities and infrastructure is now emerging as a key city policy issue [14]. Many relevant aspects and actors involved in city infrastructure development and planning and it required a comprehensive and integrated policy to be sustainable [7, 14, 17, 27]. A variety of strategies, policies, plans and programs of action for the development of an integrated and sustainable infrastructure in urban have been prepared, but the development of urban infrastructure still faces unresolved issues [16, 28]. Infrastructure development does not only affect the economic aspects, but also social and environmental aspects, those are the main dimensions of sustainable development. Therefore, it is important to determine the measuring instrument to identify the ability to build sustainable infrastructure.
infrastructure [1, 15, 22] and solid waste [3, 24]. Based on these studies it is known that there has been no research on criteria and indicators for integrated and sustainable infrastructure. The main objective of this research is to formulate policy of sustainable infrastructure development, with specific objectives are: firstly, to measure the level of sustainability of the city's infrastructure; secondly, to formulate the indicators that influence the sustainability of city infrastructure development and thirdly, to design a policy model of sustainable urban infrastructure with dynamic system. The influential indicators was obtained from the results of stakeholders assessment, public opinion and the assessment of infratsructure planning report against all indicators of sustainable infrastructure development. This research was conducted in Bandarlampung which is one of the fast-growing large cities in Indonesia and in year 2015 it is expected becoming a metropolitan city [21]
2.The Research Method
The scope of the city infrastructure research restricted to a basic network infrastructure that influence city development, namely: transportation, water systems (drinking water, storm water, waste water), green open spaces and solid waste. The research was carried out by Multi Dimensional Scaling (MDS) method, which consisted of the application of Rapinfra (Rapid Appraisal of Infrastructure), Analytic Network Process (ANP) and dynamic system model. The primary data were the data obtained directly from respondents through Focus Group Discussion (FGD) and the data collected from questionaire survey of the community in Bandarlampung City. FGDs conducted in Bandarlampung 3 times (July 2013, August 2013, and January 2014). The sampling technique in this research was the method expert survey [13] by conducting in-depth interviews to the 15 respondents who had been determined. For the survey to the public, the sampling technique the purposive sampling was used to 126 respondents. Analyzing the sustainability status using Multi Dimensional Scaling (MDS) with software Rap-fish [8] were modified to Rapinfra. Sustainability status in this study were analyzed with the five dimensions of sustainability namely environmental, social, economic, technology and good governance. Sustainability analysis conducted through three stages: 1) Attributes determination for sustainable infrastructure development, which includes dimensions of environmental, economic, social, technology and good governance. 2) The valuation of each attribute in an ordinal scale based on sustainability criteria for each dimension. The scoring is based on the result of questionaires in accordance with the stipulated requirement. The scores ranged from 0 – 3, which is interpreted from strongly disagree (poor) to strongly agree (good). 3) Results of the scoring was analyzed using Rapinfra program to determine the position of the sustainability status in each of these dimensions (Table 1).
Leverage analysis was used to determine the sensitive attributes which was very influential in improving the status of sustainable infrastructure development. The determination of sensitive attributes was based on the priority of analysis leverage result that taking into account of the changes the root mean square (RMS) ordination on the X axis. The greater the change in RMS value, the greater the role of these attributes in increasing the sustainability status of city infrastructre.
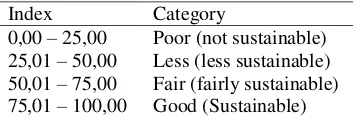
Table 1. Sustainability Index and Status
Index Category
0,00 – 25,00 Poor (not sustainable) 25,01 – 50,00 Less (less sustainable) 50,01 – 75,00 Fair (fairly sustainable) 75,01 – 100,00 Good (Sustainable)
infrastructure development. 5). Testing consistency of pairwise comparison matrices that already meet the inconsistency ratio ≤ 10%. The next step is to calculate the weights of criteria and synthesis of indicators alternative of sustainable infrastructure development with a super decisions software use. Dynamic system is a comprehensive and integrated way of thinking, it is able to simplify the complex issues without losing the important things of concern [18]. A system dynamics model can not only arrange and describe the complicated connections among each element in different levels, but also deal with dynamic processes with feedback in a system. It also can predict the complex system change under different scenarios, which is very useful in examining and recommending policy decisions in city management.
3.Results and Discussion
3.1. The level of sustainability infrastructure
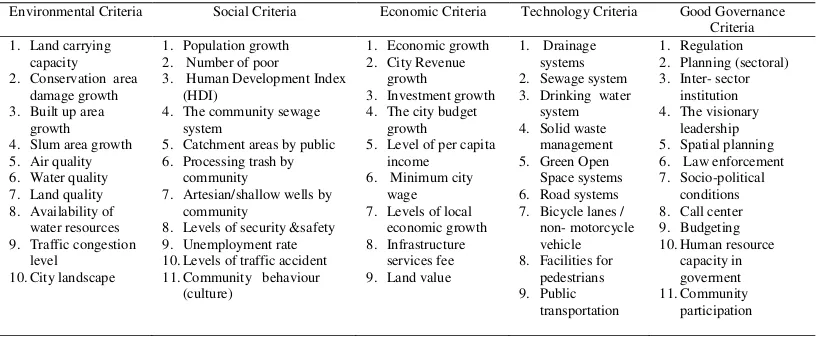
The findings on sustainable criteria and indicator for infrastructure development from various studies were summarized in Table Appendix 1. Analyzing for indicators of sustainable infrastructure development on previous research, there were obtained 5 criteria with 50 indicators for sustainable infrastructure development (Table 2). The criteria and indicators which resulted from literature review in Table 1 were used for further consulted with experts through focus group discussions (FGD). From the FGD, it fixed the number of criteria to be 5 criteria, while the number of indicators was reduced to 47 indicators.
Table 2 Criteria and indicators of sustainable infrastructure
Environmental Criteria Social Criteria Economic Criteria Technology Criteria Good Governance Criteria 1. Land carrying
capacity 2. Conservation area
damage growth 3. Built up area
growth 4. Slum area growth 5. Air quality 6. Water quality 7. Land quality 8. Availability of
water resources 9. Traffic congestion
level 10.City landscape
1. Population growth 2. Number of poor 3. Human Development Index
(HDI)
4. The community sewage system
5. Catchment areas by public 6. Processing trash by
community
7. Artesian/shallow wells by community
8. Levels of security &safety 9. Unemployment rate 10.Levels of traffic accident 11.Community behaviour
(culture)
1. Economic growth 2. City Revenue
growth 3. Investment growth 4. The city budget
growth 5. Level of per capita
income 6. Minimum city
wage 7. Levels of local
economic growth 8. Infrastructure
services fee 9. Land value
1. Drainage systems 2. Sewage system 3. Drinking water
system 4. Solid waste
management 5. Green Open Space systems 6. Road systems 7. Bicycle lanes /
non- motorcycle vehicle 8. Facilities for
pedestrians 9. Public
transportation
1. Regulation 2. Planning (sectoral) 3. Inter- sector
institution 4. The visionary
leadership 5. Spatial planning 6. Law enforcement 7. Socio-political
conditions 8. Call center 9. Budgeting 10.Human resource
capacity in goverment 11.Community
participation
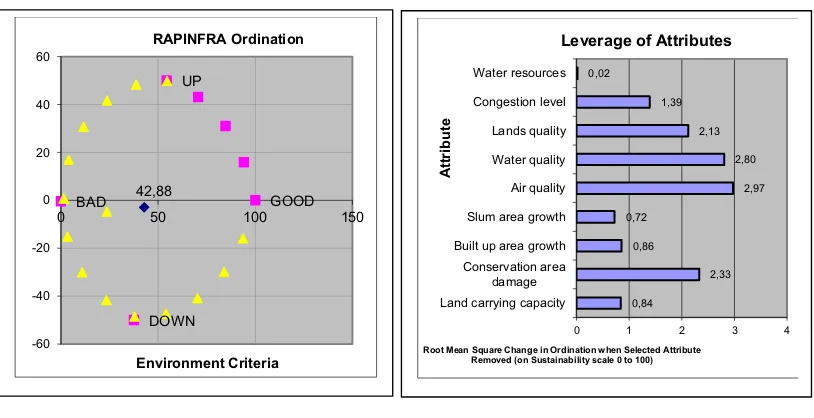
The results of MDS using Rapinfra showed that the sustainability index value of environmental criteria was 42.88% as shown in Figure 1. It was classified as less sustainable, due to 2 attributes laid in bad score which were the rate of conservation, damage and level of traffic congestion. Seven (7) attributes laid in moderate score which were land carrying capacity, the growth rate of built up area, slum area growth, air quality, water quality, land quality and water resources. The less sustainable status was influenced by 4 key indicators that leverage analysis results and it can be seen in figures root mean square (RMS). Key indicators were indicators of the middle to the highest RMS value. The RMS of key indicators were air quality level; the rate of conservation area damage; the level of water quality; the soil quality level (Figure 2).
Figure 1. Value Criteria Environmental Sustainability Index Figure 2. RMS Value of Environmental Criteria
The category was not sustainable due to 7 attributes laid in bad score which were the population growth, the number of poor, artesian/shallow weel by public, catchment area by public, trash processing by public, community behaviour, and safety, security, comfort level. It was also due to 3 attributes laid in moderate score which were HDI, sewage system by public and unemployment rate. The unsustainable status was affected by the 6 key indicators. The RMS of key indicators were: the rate of human development index; the sewage system by public; unemployment rate; trash processing by public; catchment area by public and the making artesian or wells drilled by the public.
The sustainability index value for the economic criteria was 43.88 % which was relatively less sustainable. The category was less sustainable due to all economic attributes laid in moderate score.
The less sustainable status was influenced by three key indicators, that the RMS of key indicators were: the rate of investment; level of income per capita, and the local economy growth.
Sustainability index value for technology criteria was 28.32 %. It was classified as less sustainable due to 5 attributes laid in bad score which were sewage system, drinking water system, bicycle lanes/non-motorcycle vehicle, facilities for pedestrians, public transportation. Four (4) attributes laid in moderat score which were drainage systems, solid waste management, green open space systems and road systems. The less sustainable status was influenced by eight key indicators, the RMS of key indicators were: the level of water services; availability of green open space; availability of roads; availability of pedestrian facilities; waste management; availability of municipal sewage system; the availability of bike lanes/non- motorcycle vehicles and the availability of public transport systems. The sustainability index value of good governance criteria was 44.58 %. It was classified as less sustainable due to 4 attributes laid in bad score which were regulation, inter-sector institution, law enforcement, social political conditions. Five (5) attributes laid in moderate score which were the visionary leadership, spatial planning, budgeting, human resource capacity in goverment, and community participation. Only one attribute laid in good score, it was call center. The less sustainable status was influenced by 5 key indicators, the RMS of key indicators were: law enforcement; call centers; inter-sector institution; leadership, and the local socio-political conditions.
The results of MDS using Rapinfra shows that multicriteria sustainability infrastructure Bandarlampung index value was 38.05 % or less sustainable , as shown in Table 3 and Figure 3.
42,88
GOOD BAD
UP
DOWN
-60 -40 -20 0 20 40 60
0 50 100 150
Environment Criteria RAPINFRA Ordination
0,84
2,33 0,86
0,72
2,97 2,80 2,13 1,39 0,02
0 1 2 3 4
Land carrying capacity Conservation area
damage Built up area growth
Slum area growth Air quality Water quality Lands quality Congestion level Water resources
Root Mean Square Change in Ordination when Selected Attribute Removed (on Sustainability scale 0 to 100)
A
ttribute
Table 3. Sustainable status of infrastructure Figure 3 Kite diagram
To determine whether the indicators examined in MDS analysis was quite accurate and can be justified scientifically, this can be seen from the stress and the coefficient of determination (R2). This value was obtained in the MDS analysis using Rapinfra software. The results of the analysis were considered sufficiently accurate and reliable because it has a smaller stress value of 0.25 or 25% and the coefficient of determination (R2) values approaching 1.0 or 100 percent [11]. The analysis showed that all indicators were assessed fairly accurate and accountable. It was shown that the stress value by 14% -15% and the coefficient of determination (R2) of 0.95%. Stress value indicates the proportion of variance that was not explained by the model. It showed that, the lower the value the better the model MDS stress.
3.2. Priority Indicators Analysis on Sustainable Infrastructure Development
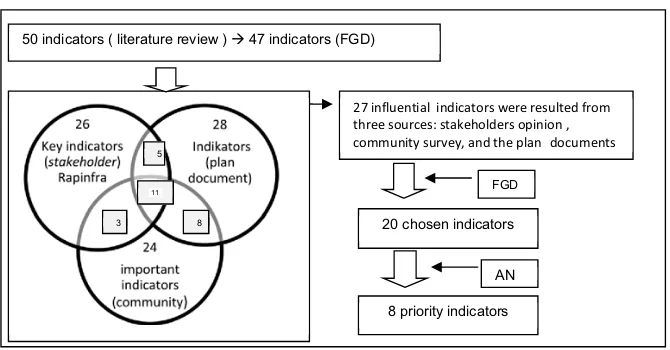
The processes to obtain indicators of sustainable infrastructure development priorities starting from the results of a literature review of 50 indicators, then taken to the FGD, in order to obtain 47 indicators. These indicators is used for the assessment of the various sources which include: stakeholders opinion, communities and planning documents performance. The combined results from the three sources were obtained 27 influential indicators, then this influential indicator was brought to the FGD, in order to obtain 20 indicators were selected to be analyzed in the ANP. ANP analysis results obtained with 8 priority indicator , this stage can be seen in Figure 4.
The community survey showed that 24 indicators of the level of importance according to 5 criteria. Influential indicators for environmental criteria were 5 namely: the level of congestion, water quality, availability of raw water sources, air quality and growth of built up area. There were 5 influential indicators for social criteria, namely: HDI level, level of security and safety, unemployment growth rate, waste management system by community and community behavior. There were 4 influential indicators economic criteria, which include: city minimum wage level, local economy development, the growth of infrastructure budget and economic growth (GDP). Influential indicators for technology criteria were 6 consist of: the availability of drinking water system, waste management system, drainage system, green open space system, wastewater system, and public transport system. There were four influential indicators for governance criteria, namely: visionary leadership, law enforcement, infrastructure planning and infrastructure budget.
Sustainable Status
No. Criteria Index value
Sustainable status
1 Environment 42.88 less sustainable
2 Economic 43.88 less sustainable 3 Social 15.80 not sustainable
4 Technology 28.32 less sustainable
5 Governance 44.58 less sustainable
0 20 40 60 80 100 Environment
Economic
Social Technology
Figure 4. Phases analysis of priority indicator in sustainable infrastucture development
Planning document, which it was the reference of infrastructure development was the Spatial Plan, Sectoral Master Plan and Mid-Term Development Plan (RPJMD). There was also the Mid-Term Infrastructure Plan (RPIJM) space -based and sector and it was currently in the process of preparing the plan. The results showed that the existing infrastructure development plans in the form of a program of activities still does not meet the indicators of sustainable infrastructure development even most plans do not formulate some sort of performance indicators as a measure of development, except RPJMD. Indicators of sustainable infrastructure development on RPJMD were 28 indicators consist of: 6 indicators of environmental criteria, namely: reduced rate of destruction of mountains and hills (conservation area), city slum area, growth of built up area, reduced air pollution, preservation water sources and reduced traffic congestion point. The attributes of social criteria were include 5 indicators, namely: increasing HDI level, reduced the number of poor, security and safety; waste management and unemployment rate. Economic criteria which consist of 5 indicators were: economic growth, city revenue growth, GDP growth rate, the rate of minimum city wage. Criteria technology has 7 indicators namely: growth of number of roads, arranged green open space areas, reduced sedimentation of waterways and drainage, increasing water service, available sewerage installation, available facilities and mass transit traffic. Good governance criteria has 5 indicators, namely: increasing the amount of the approved legislation, capacity building through discipline and education of civil servants, availability of media complaints, budgeting, availability of information planning in accordance with the implementation plan.
The key indicators of MDS previous results (26 indicators) then combined with the results of the community survey (24 indicators) and outcome indicators in the assessment of infrastructure planning documents (28 indicators) to obtain the most influential indicators in the sustainable infrastructure development. Composite indicator made up of indicators that appear at least twice in all three stages of the analysis, in order to obtain 27 indicators (Figure 4).
Figure 4 shown that there were 27 the powerfull indicators in sustainable infrastructure development. The environmental criteria has 6 indicators namely: availability of raw water, air quality, water quality, damage of conservation, growth of built up area development and traffic congestion. The social criteria has 4 indicators consist of: HDI, security and safety, unemployment rate, public participation and citizen behavior. The economic criteria has 4 indicators namely: the rate of investment, income per capita, the rate of the local economy and minimum city wage. The technological criteria has 7 indicators namely: the availability of clean water systems, waste management, green open spaces, road network, drainage system, waste water system, and public transport. The governance criteria has 6 indicators including: visionary leadership, call center, law enforcement and sanctions, infrastructure
FGD
20 chosen indicators
AN
8 priority indicators
27 influential indicators were resulted from three sources: stakeholders opinion ,
community survey, and the plan documents
50 indicators ( literature review ) Æ 47 indicators (FGD)
8 3
5
planning and infrastructure budgets. The 27 powerfull indicators on Figure 4 discussed by experts in the FGD and obtained 20 indicators, and then these indicators will be processed at the stage of ANP (Figure 5).
The calculation result with the super decisions obtained the weight of each indicator, the greater the weight of indicator, the greater the influence of these indicator on sustainable infrastructure development. There were 8 main indicators that the most influential or the priority indicators on sustainable infrastructure development. The priority indicator on economic criteria was local economic growth with weights 0.725. For governance criteria, there were two priority indicators, namely: infrastructure planning with weights 0.475 and infrastructure budget with weights 0.446. On the technological criteria, the priority indicator was the availability of clean water system with weights 0.425. For social criteria there were two priority indicators, namely: community participation with weights 0.418 and people's behavior with weights 0.404. On environmental criteria, there were two priority indicators namely: air quality with a weight of 0.369, and the growth of built up area with weight 0.345.
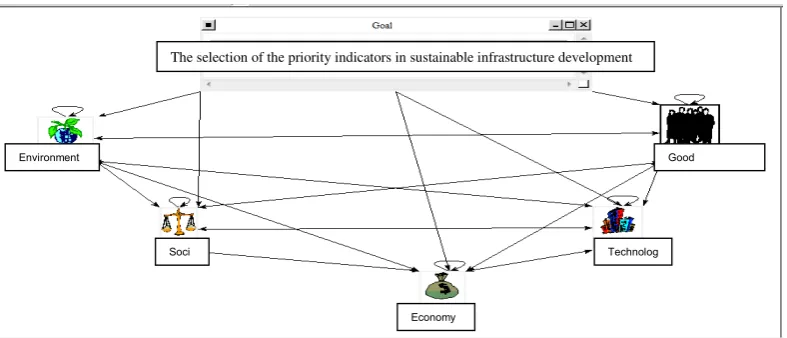
Figure 5. Network link between sustainable infrastructure development criteria in ANP
The results of the analysis of ANP recommend policy directions in the development of sustainable infrastructure ought to consider 8 priority indicators. Policy recommendations in sustainable infrastructure development were the first: the local economic growth that address the needs of micro economic infrastructure such as: provision of space for small enterprise and street vendors in the city. Second: an integrated infrastructure planning between spatial and sectoral development plans. The Indonesian government is currently preparing a program planning development of spatial-based infrastructure to support integrated development through The Medium Term of Infrastructure Investment Program Plan (RPI2JM). This program may be the first step in planning an integrated infrastructure development and sector-based spatial development. This plan can work well if the planning process also involves decision-makers from related sectors. Third: an increase in the infrastructure budget, efficiency and effectiveness of the budget. Fourth: the availability of clean water system which was distributed to all parts of the city, increasing the amount of raw water sources and water management with 5 R (restore, reduce, reuse, recycle, rechargeable). Fifth: increased community participation in the management of city infrastructure, building consensus between the government and the residents of the city as well as the transparency of information. Sixth: city infrastructure management that considers the behavior of (cultural) communities, for example the pattern of movement of people in the use of transport (public transport, bicycle or on foot) and open space utilization patterns. Seventh:
The selection of the priority indicators in sustainable infrastructure development
Environment
Technolog Good
Soci
air quality with the increased use of public transport, periodic emissions testing, vehicle age restrictions, environmentally friendly fuel, green industry and waste management without burning. Eighth: the city land use in accordance with the city spatial plan, that requires the provision of 30% open space, minimizing damage to protected areas (mountains, slopes and hills) and the efficient use of space with vertical building development.
3.3. Policy Model of Sustainable Infrastructure Development
Sustainable infrastructure development model of Bandarlampung represents the existence of various factors affecting the availability of the city's infrastructure. This dynamic system model is constructed from three models: the model of social, model of the physical environment , and the sub-model of economic. Sub physical sub-model of the environment consists of sub-sub-models of road system, water resources system, waste sytem and green open space system (Appendix 1 and Appendix 2).
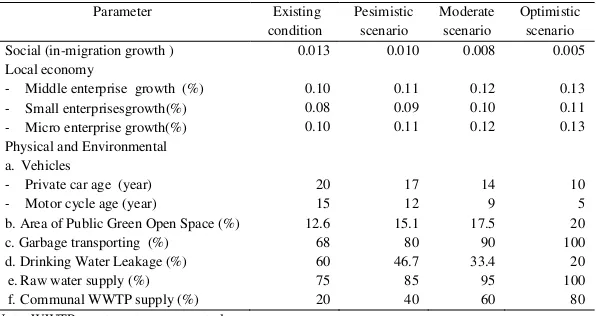
Dynamic simulation models are used to create a scenario of sustainable infrastructure development in Bandarlampung. Simulations carried out for a period of 20 years (2007- 2026). Scenarios developed by simulation intervention on model parameters, namely social (population), economic (medium, small, micro enterprises/MSMEs), physical and environment (clean water, green space, sewage and roads), see table 4. Alternative policy scenario includes four types of scenarios which consisted of 1 scenario without intervention (bussiness as usual), and 3 types of scenarios with interventions namely: pessimistic, moderate and optimistic. The third scenario simulated by changing the parameters of current conditions into better conditions in the future. Optimistic scenario is the scenario that led to the intervention expectations of appropriate conditions of minimum service standards (SPM) which is adapted from the Minister of Settlement and Regional Infrastructure Regulation No. 534/KPTS/M/2001 on Guidelines for Minimum Service Standards, and the Minister of Public Works Regulation No. 01/PRT/2014 on Minimum Service Standards for all public works and Spatial Planning, and the target of achieving the Millennium Development Goals (MDGs) as outlined in Long-term National Development Plan (RPJPN) 2015 -2019.
Table 4. Intervention of Scenario Parameter
Parameter Existing condition
Pesimistic scenario
Moderate scenario
Optimistic scenario Social (in-migration growth ) 0.013 0.010 0.008 0.005 Local economy
- Middle enterprise growth (%)
- Small enterprisesgrowth(%)
- Micro enterprise growth(%)
0.10 0.08 0.10
0.11 0.09 0.11
0.12 0.10 0.12
0.13 0.11 0.13 Physical and Environmental
a.Vehicles
- Private car age (year)
- Motor cycle age (year)
20 15
17 12
14 9
10 5 b. Area of Public Green Open Space (%) 12.6 15.1 17.5 20 c. Garbage transporting (%) 68 80 90 100 d. Drinking Water Leakage (%) 60 46.7 33.4 20 e.Raw water supply (%) 75 85 95 100 f.Communal WWTP supply (%) 20 40 60 80 Note: WWTP: waste water treatment plan
3.4. Sustainable index of infrastructure development
Table 5. Sustainable index of infrastructure development
Scenario
Sustainable index of infrastructure development Popu-
lation
Local economy
Water supply
Waste treatment
Flood index
Traffic jam index
Public green
open space Without
intervention 0.761 0.704 0.452 4.092 1.004 3.416 0.405 Pesimistic 0.739 0.813 0.593 2.151 0.972 1.898 0.731 Moderate 0.724 0.927 0.977 2.463 0.952 0.517 0.827 Optimistic 0.703 1.072 1.295 1.118 0.934 0.331 0.870 Weight (AHP) 0.349 0.133 0.136 0.058 0.087 0.152 0.085 Trend (CPI) negative positive positive negative negative negative positive
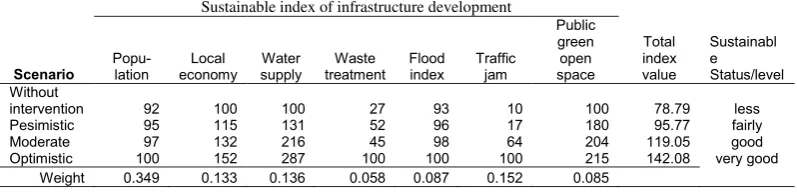
Table 6. Infrastructure sustainability index value with CPI
Scenario
Sustainable index of infrastructure development
Total index value
Sustainabl e Status/level
Popu-lation
Local economy
Water supply
Waste treatment
Flood index
Traffic jam
Public green open space Without
intervention 92 100 100 27 93 10 100 78.79 less Pesimistic 95 115 131 52 96 17 180 95.77 fairly Moderate 97 132 216 45 98 64 204 119.05 good Optimistic 100 152 287 100 100 100 215 142.08 very good
Weight 0.349 0.133 0.136 0.058 0.087 0.152 0.085
Note : The weight is the result of assessment using AHP (Analytic Hierarcy Process) ; CPI: Composite Performance Index
Model of sustainable urban infrastructure development policies with moderate scenario is chosen the most appropriate scenario to be implemented in the time frame until 2026 with consideration of the availability of the resources available today, include: human resources in the government, budgetary resources, and resources of land. The priority policy for the sustainable development of the city's infrastructure moderate scenario are:
a. Physical and environmental policy field is through an integrated infrastructure management program that includes: (1) the management of water resources, in particular the increase in the volume of raw water, clean water service improvement, reduction of loss/leakage of water, integrated solid waste management, communal waste water treatment plan/WWTP; (2) the provision of mass transit is easily accessible, secure, inexpensive and convenient; and the imposition of restrictions on the age of a motor vehicle; (3) an increase the quantity and quality of public green open space.
b. Social policies that include population control through restrictions on the number of people coming into the city. To support the program it is necessary to measure the change in the form of equitable development of infrastructure to the suburbs and judicial operations.
c. Policy economics is managing the local economy through an increase in the number of medium, small and micro enterprises (MSMEs) by providing access to MSMEs on the provision of urban infrastructure needed such as: cheap transport, accessible water supply and integrated waste management.
4.Conclusion
The sustainable infrastructure development benchmarks were generated in this study which included 5 criterias such as environmental, social, economic, technological and governance, and 47 indicators. The status of Bandarlampung infrastructure sustainability was considered as less sustainable with a score of 38.05 % which means that the availability of the infrastructure was still in good condition. However, it needs to be improved to achieve sustainable infrastructure development.
planning, infrastructure budgets, availability of clean water systems, community participation, people’s
behavioral, air quality and growth of built up area. The were eight (8) recommendation policies in sustainable infrastructure development. Firstly: the local economic growth that address the needs of micro economic infrastructure such as: provision of space for small enterprise and street vendors in the city. Secondly: an integrated infrastructure planning between spatial and sectoral development plans should consider the indicators of sustainable infrastructure development through The Medium Term of Infrastructure Investment Program Plan (RPI2JM). Thirdly: an increase in the infrastructure budget for more efficiency and effectiveness. Fourthly: the availability of clean water system which was widely distributed throughout the city by increasing the amount of raw water sources and water management with 5 R (restore, reduce, reuse, recycle, rechargable). Fifthly: increased community participation in the management of city infrastructure, building consensus between the government and the residents of the city as well as the transparency of information. Sixthly: city infrastructure management that considers the community behavior, for example the pattern of movement of people in the use of transport (public transport, bicycle or on foot) and open space utilization patterns. Seventhly: air quality with the increased use of public transport, periodical emission testing, vehicle age restrictions, environmental friendly fuel, green industry and waste management without burning. Eighthly: the city land use in accordance with the city's spatial plan, that requires the provision of 30% open space, minimizing damage to protected areas (mountains, slopes and hills) and the efficient use of space with vertical building development.
The system dynamics model of sustainable infrastructure development in the study area is comprised of three models: the sub social model, model of the physical environment, and sub-model of the economy has resulted in the formulation of the sustainability index value of city infrastructure. The index value can be increased in line with the simulation scenarios. The results without the intervention and pessimistic scenario showed a trend is not sustainable with the sustainability level is still relatively low. Results of moderate and optimistic scenarios already showed a better level of sustainability or already ongoing and highly sustainable. Selected scenario is the most moderate scenario might be implemented because of the limitations of existing resources include budgetary resources, human resources in bureaucracy and land resources. Under the moderate scenario, estimated in 2026 at Bandarlampung infrastructure development is still ongoing, but should be anticipated external influences also the city which can lower the level of sustainability.
In order to increase the value of the city's infrastructure and the status of sustainability in order to materialize the scenario chosen, it must be supported by appropriate policies. The findings of priority policy can be used as a basis for intervention in the upgrading of the sustainability of urban infrastructure in the future. So that the policy can be implemented, it is equipped with programs and action change as follows:
a. Policy priorities for sustainable infrastructure development is the policy of physical and environmental fields through an integrated infrastructure management program that includes: (1) the management of water resources in an integrated manner, in particular the increase in the volume of raw water, clean water service improvement, reduction of water leakage and waste management ( liquid and solid); (2) the provision of mass transit is easily accessible, secure, inexpensive and comfortable which is supported by the provision of facilities for pedestrians such as sidewalks, pedestrian bridges and public transportation stops, restrictions on the age of a motor vehicle; (3) an increase in the breadth and quality of public availability of green open space through revitalization of existing open space, developing innovative garden (the wall garden, vertical garden and roof garden) and increase the number of parks in the suburbs. b. Supporting policies to policy priorities are:
Policy management economics is the local economy through an increase in the number of MSMEs by providing access to MSMEs through supporting the provision of basic urban infrastructure in the form of adequate infrastructure.
Recommendation
In order to improve further sustainability infrastructure development of Bandarlampung City, the priority indicators in determining the policy of the city's infrastructure development should be taken into consideration by the local authorities. Model of sustainable infrastructure development policy is a policy concept design that can be adopted in the planning of city infrastructure. The preparation of policy planning and sustainable infrastructure development in urban areas are advised to apply the criteria and indicators generated in this study .
Acknowledgement
The author would like to thank to the colleagues of Bandarlampung Planning and Development Board for supporting data. Thanks should also be conveyed to the Education Ministry of the Republic of Indonesia for supporting funds for this research through BPPS scholarship.
References
[1] Aji A 2000 Sustainable Green Open Space Management (Case Studi: Kota Bandarlampung)
Dissertation (Bogor : Bogor Agricultural Institute Indonesia)
[2] Andayani S Yowono B E Soekrasno 2012 J. Civil Engineering11 2 p 148-157 [3] Astuti P Amran T G Herdono 2011 Semarang J. Industrial Engineering VI 2 p 87-94 [4] Benzerra A Cherrared M Chocat B Cherqui F Zekiouk T 2012 J.. Environmental
Management101 p 46-53
[5] Barter P Raad T 2000 Taking Steps Community Action Guide to People-Centered, Equitable and Sustainable City Transport Sustainable Transport Action Network for Asia and the Pacific The Sustran Network
[6] Danko C C and Lourenco J M 2007 A Discussion on Indicators and Criteria for Sustainable City Infrastructure Development Cost 27 Sustainable Development Policies for Minor Deprived City Communities Evora Workshop
[7] Engel-Yan J Kennedy C Saiz S Pressnail K 2005 Canadian. J. Civil Engineering31 p 45–57 [8] Fauzi A and Anna S 2005 Modeling of Fisheries and Marine Resources for Policy Analysis
(Jakarta: PT Gramedia Pustaka Utama)
[9] Haghshenas H and Vaziri M J. Ecological Indicators15 p 115–121
[10] Litman T and Burwell D 2006 Issues J. Global EnvironmentalIssues 6 4 p 331-347
[11] Kavanagh P and Pitcher T J 2004 Implementing Microsoft Excel Software for Rapfish: A Technique for the Rapid Appraisal of Fisheries Status (Fisheries Centre Research Reports) 12
2 p 75.
[12] Kusbimanto I W 2013 Models of Sustainable City Transport Infrastructure Development Policies in Metropolitan Mamminasata Southern Sulawesi Dissertation (Bogor: Graduate School, IPB) [13] Marimin 2004 Techniques and Applications: Multi Criteria Decision Making (Jakarta : Grasindo) [14] Marvin S and Slater S 1997 J. Progress in Planning 48 4 p 247-313
[15] Mell I C 2009 Can Green Infrastructure Promote City Sustainability? (Proceeding of The ICE- Engineering Sustainability) 162 1 p 23-34
[16] Miharja M 2007 Institutional Approaches in Transportation Planning-Metropolitan Land Use. Paper presented at the Sustainable Transportation Seminar (Bandung: West Hall Bandung Institute of Technology)
Economic, Management (Jakarta: UMJ Press)
[19] Newell J P Seymour M Yee T Renteria J Longcore T Wolch J R. Shishkovsky A 2013 J. Cities
31 p 144-155
[20] Pandit A Jeong H Crittenden JC and Xu M 2011 An Infrastructure Ecology Approach for City Infrastructure Sustainability and Resiliency IEEE/PES Power System Conference and Exposition PSCE (Phoenix AZ US)
[21] Pontoh N K and Kustiwan I 2009 Introductory to City Planning (Bandung: Bandung Institute of Technology Publisher)
[22] Putri W E F 2013 Sustainable Analysis of City Green Open Space in Bengkulu City Jurnal Urip Santoso https://uripsantoso.wordpress.com./tag/ruang-terbuka-hijau. access 25 Mei 2013. [23] Sahely H Kennedy C A and Adams B J 2005 Developing sustainability Criteria for city
infrastructure system Canadian. J. Civil Engineering32 p 72-85
[24] Safitri D Chaerul M Sembiring E 2012 A Multicriteria Decision Model for Organic Solid Waste Management with Analytic Network Process Case Study: Jambi Indonesia Environmental Engineering Department Graduate School ITB (Bandung: Bandung Institute of Technology) [25] Saniti D 2012 Alternative Determination of Sustainable Water Supply Systems at Muara Angke
Bandung. J. City and Regional Planning23 3 p 197-208
[26] Setiawati E Notodarmodjo S Soewondo P Efendi A J Otok B W 2013 Infrastructure Development Strategy for Sustainable Waste Water System by Using SEM Method (Case Study: Setia Budi and Tebet District, South JakartaJ. Procedia Environmental Sciences17 p 685-692.
[27] Singh K and Steinberg F 1996 J. Asia Habitat International 20 p 1-3.
[28] Steinberg F 2007 Jakarta: Environmental problems and sustainabilityJ. Habitat International31
p 354-365.
[29] Suripin 2004 Sustainable City Drainage Systems (Yogyakarta : AndyPress)
APPENDIX-1 : Table Sustainability citeria and incators for different infrastructure system from various studies (2000-2013)
Citeria and indicators Transportation Drinking Water
Storm water (Drainage) Waste water Solid waste Green open space
Environmental criteria: 1 2 3 4 5 6 7 8 9 10 11 12 13 14 15 16 17 18 19 20 21 1. Air pollution (ambient air quality)
2. Emission levels (motor vehicle), GHG 3. Noise pollution (noise level Traffic) 4. Area of green space and network 5. Conversion rate of land (land use) 6. Controlling land use 7. Landscape condition 8. Use of energy (fuel consumption) 9. Use of renewable energy 10. Land degradation
11. The efficiency of movement / mobility 12. Environmental management (3 R) /quality 13. The environmental impact of facilities 14. Protection of wildlife / habitat / biodiversity 15. Water polution/water quality 16. The efficiency of natural resources 17. Material and construction waste 18. Pollution of ground water (ground)/quality 19. Permanent puddle and flood 20. Environment Aesthetic
21. Ecological network (hubs-nodes-corridors) 22. Water resources (air baku)
X 1. The regional Economic Growth
2. Gross Regional Domestic Product 3. Budget implementation infrastructure (OM) 4. The Local Government Revenue 5. Trip fee/service fee 6. Growth centers 7. The growth of land value 8. Dimensions of city area 9. Infrastructure rate/user fee 10. Revenue per capita
11. Supporting industrial/ investment develop. 12. Creation of jobs
13. Absorption of labor 14. Revenue population 15. Local Economic Development (LED) 16. Saving of roads maintenance
- 1. Population growth
2. Levels traffic(infrastructure) accidents 3. The Safety level
4. The Security level
5. Behaviour of community as an infras. user 6. The healthy level
7. Growth of private vehicles 8. Education and skills rate 9. Welfare society level 10. Population density 11. Facilities for the disabled 12. Access to public services 13. Satisfaction of road (infrastructure) users 14. Levels Traffic violations 15. Equity / fairness 16. Survival rate
17. Making infiltration wells by community 18. Protection of culture resources/traditional 19. The social interaction and social access 20. Willing to pay 1. Capacity of infrastructure (supply)
2. Levels of service (performance) 3. Integration of infrastructure 4. Development of road network 5. Diversification of transportation mode 6. Bike and pedestrian path 7. Facilities for pedestrian (crossing bridge) 8. Facilities non-motorcycle vehicle 9. Infrastructure technology (design of infra.) 10. The public transport quality 11. Easily obtained/operated of technology 12. Diversification of green open space 13. Leakage 1. Law enforcement and sanctions/control
2. Quality of human resources 3. Community participation 4. Planning
5. Budget development and R & D 6. Regulation / Law 7. Institutional 8. Call Center
9. Cooperation (between regions, private-goverm) 10. Integrated infrastructure institution 11. Conformity with the Spatial planning
Appendix-2: Causal diagram of sustainable infrastructure development model
Population
-+
-life expectancy
birth and in-migration
rate
population density mortality and
out-migration rate
+
-+
quality of environment
-+
-+
-+
MSMEs number of
employee
infrastructure development
-+
+
environment quality
local economy
growth +
-land use
green open space supply
index +
-+
flood
index
environment quality +
drinking water supply raw water
supply green open
space
+
+
+
+ rainfall
+
run off
drainage supply system
-land use
-+ +
mobilty level
bus +
population
road capacity
private car +
vechicle number truck
traffic jam index motor cycle
+ +
"angkot" +
+
the lenght of road
+ +
+
+
-+
+
+
traffic volume
+
-quality of environment
+
solid waste supply system liquid supply
system
+
quality of environment waste
system index
the needs of water +
+
-road
development +
+
-+
the needs of land
+ + +
-LOCAL ECONOMY POPULATION
WASTE
WATER RESOURCES
GREEN OPEN SPACE TRANSPORTATION
SUSTAINABLE INFRASTRUCTURE INDEX GREEN OPEN SPACE
INDEX push factor
difference
eviction fraction
raw w ater fraction raw w ater WATER DEMAND INDEX
total w ater demand
total w ater demand
city area city area
the minimum requirement of green open space
the road development green open space
needs
the rate of w ater runoff
surface w ater fraction POPULATION INDEX
communal WWTP total w aste
WASTE INDEX w astew ater-ratio
capability of communal WWTP
w ater runoff total w aste-w ater
density
garbage reduction w aste w
ater-reduction
runoff fraction rain-w ater
adding w ater runoff population
population
garbage payload capability
capability of hausehold WWTP birth rate
w aste w ater population increase
hausehold-WWTP
green open space life expectancy
emigration
green open space eviction the grow th of green
open space w astew ater adding
garbage percapita
garbage transported garbage garbage adding
depopulation
total reduction ideal density
mortality rates mortality fraction
number of days
population immigration
w ater demand
micro enterprises
medium enterprises small enterprises
number of the small enterprises
the number of medium enterprises the number of MSMEs
enterprises the number of MSMEs
ideal
the number of MSMEs
the grow th of micro enterprises
the grow th of medium enterprises the grow th of small
enterprises
the number of micro enterprises ECONOMY INDEX population
green open space grow th fraction
the average of vehicles per km CONGESTION INDEX
the number of vehicles for trips
resistance factor road capability
the lenght of road the road development truck
the grow th of small bus
small bus
the attractiveness of the motorcycle
reduction rate the grow th of
private cars
the grow th of motorcycle
bus
bus reduction the reduction
fraction
bus adding small bus adding reduction smal bus
the fraction of bus reduction the grow th fraction
of truck
truck adding truck reduction
the grow th of truck
motorcycle adding reduction of
motorcycle reduction of private
cars private cars adding
the grow th of bus
private cars age
private cars motorcycle
road w idth requirement
the initial lenght of road age of motorcycle
adding fraction
capacity of artificial drainage system FLOODING INDEX
drainage the average trip per
person per day
population total trips
traffic volume
the average mileage
the grow th fraction of bus
the reduction grow th of small bus
capacity of natural drainage system
w ater leakage dringking w ater
SUSTAINABLE INFRASTRUCTURE
INDEX
WASTE INDEX POPULATION INDEX
WATER DEMAND INDEX
GREEN OPEN SPACE ECONOMY INDEX