Determining Critical Temperature
T
cin a Molecular Dynamics-Simulated
Glass Forming Ni
0.8Zr
0.2-System
A. B. Mutiara1
1
Faculty of Computer Science and Information Technology, Gunadarma University, Jl. Margonda Raya No.100, Depok 16424, Indonesia (e-mail: [email protected])
Abstract.In this paper molecular dynamics computer simulations is used to investigate a critical temperature Tc for a dynamical glass transition as proposed by the mode-coupling theory (MCT) of dense liquids in a glass
forming Ni0.8Zr0.2-system. The critical temperature Tc are analyzed from different quantities and checked the
consistency of the estimated values, i.e. from (i) the non-vanishing nonergodicity parameters as asymptotic solutions of the MCT equations in the arrested state, (ii) the gm-parameters describing the approach of the melt
towards the arrested state on the ergodic side, (iii) the diffusion coefficients in the melt. The resulting Tc values
are found to agree within about 10-15 %.
1 Introduction
The glass problem has a reputation of being controversial [1, 2]. It has even been said that “There are more theories of the glass transition than there are theorists who propose them” [3]. Part of this controversy is fully justified. The problem is indeed extremely challenging, and it has long been difficult for theory to provide precise predictions that could be experimentally tested, in order to obtain conclusive answers [4]. A lot of progress has nonetheless been achieved thanks to the impressive numerical and experimental developments of the last couple of decades, and theory is rapidly evolving in the aim to match this effort.
At the experimental level, the so-called glass transition is generally associated with a sharp increase in the characteristic relaxation times of the system, and a concomitant departure of laboratory measurements from equilibrium. At the theoretical level, it has been proposed that the transition from a liquid to a glassy state is triggered by an underlying thermodynamic (equilibrium) transition [5]; in that view, an “ideal” glass transition is believed to occur at the so-called Kauzmann temperature,
TK. At TK, it is proposed that only one minimum-energy
basin of attraction is accessible to the system. One of the first arguments of this type is due to Gibbs and diMarzio [6], but more recent studies using replica methods have yielded evidence in support of such a transition in Lennard-Jones glass formers [5,7,8]. These observations have been called into question by experimental data and recent results of simulations of polydisperse hard-core disks, which have failed to detect any evidence of a thermodynamic transition up to extremely high packing
fractions [9]. One of the questions that arises is therefore whether the discrepancies between the reported simulated behavior of hard-disk and soft-sphere systems is due to fundamental differences in the models, or whether they are a consequence of inappropriate sampling at low temperatures and high densities.
Different, alternative theoretical considerations have attempted to establish a connection between glass transition phenomena and the rapid increase in relaxation times that arises in the vicinity of a theoretical critical temperature (the so-called “mode-coupling” critical temperature, Tc), thereby giving rise to a “kinetic” or
“dynamic” transition [10]. In recent years, both viewpoints have received some support from molecular simulations. Many of these simulations have been conducted in the context of models introduced by Stillinger and Weber and by Kob and Andersen [11]; such models have been employed in a number of studies that have helped shape our current views about the glass transition [7, 12, 13, 14, 15, 16].
As in our previous paper [17] (it is referred as paper I), in this paper we investigate a critical temperature Tc
for a dynamical glass transition as proposed by the mode-coupling theory (MCT) of dense liquids in a glass forming Ni0.8Zr0.2-system, while in paper I the system is a
glass forming Ni0.2Zr0.8-system. The critical temperature
Tc are analyzed from different quantities and checked the
consistency of the estimated values, i.e. from (i) the non-vanishing nonergodicity parameters as asymptotic solutions of the MCT equations in the arrested state, (ii) the gm-parameters describing the approach of the melt
towards the arrested state on the ergodic side, (iii) the diffusion coefficients in the melt.
Owned by the authors, published by EDP Sciences, 2014
Thereforee it is tempting to consider how well the estimates of Tc from different approaches fit together and
whether the Tc estimate from the nonergodicity
parameters of the idealized MCT compares to the values from the full MCT. Regarding this, we here investigate a molecular dynamics (MD) simulation model adapted to the glass-forming Ni0.8Zr0.2 transition metal system. The
NixZr1-x-system is well studied by experiments [24, 25]
and by MD-simulations [26, 27, 28, 29, 30, 31, 32, 33], as it is a rather interesting system whose components are important constituents of a number of multi-component ’massive’ metallic glasses. In the present contribution we consider, in particular, the x=0.8 composition and concentrate on the determination of Tc from evaluating
and analyzing the nonergodicity parameter, the gm(T)
-parameter in the ergodic regime, and the diffusion coefficients.
Our paper is organized as follows: In section II, we present the model and give some details of the computations. Section III. gives a brief discussion of some aspects of the mode coupling theory as used here. Results of our MD-simulations and their analysis are then presented and discussed in Section IV.
2 Simulations
The present simulations are carried out as state-of-the-art isothermal-isobaric (N,T,p) calculations. The Newtonian equations of N= 648 atoms (518 Ni and 130 Zr) are numerically integrated by a fifth order predictor-corrector algorithm with time step t = 2.5x10⁻¹⁵s in a cubic volume with periodic boundary conditions and variable box length L.
With regard to the electron theoretical description of the interatomic potentials in transition metal alloys by Hausleitner and Hafner [34], we model the interatomic couplings as in [27] by a volume dependent electron-gas term Evol(V) and pair potentials (r) adapted to the
equilibrium distance, depth, width, and zero of the Hausleitner-Hafner potentials [34] for Ni0.8Zr0.2 [28]. For
this model, simulations were started through heating a starting configuration up to 2000 K which leads to a homogeneous liquid state. The system then is cooled continuously to various annealing temperatures with cooling rate -tT = 1.5 x 10¹² K/s. Afterwards the
obtained configurations at various annealing temperatures (here 1500-600 K) are relaxed by carrying out additional isothermal annealing runs. Finally the time evolution of these relaxed configurations is modelled and analyzed. More details of the simulations are given in [28].
In this section we provide some basic formulae that permit calculation of Tc and the nonergodicity parameters
fij(q) for our system. A more detailed presentation may be
found in Refs. [21, 22, 23, 35, 36]. The central object of
the MCT are the partial intermediate scattering functions which are defined for a binary system by [37]
,0) ( ) , ( 1 = ) ,
( q t q
N N t q
F i j
j i
ij U U
¦
¦
j N i i N j iNN =1 =
1 = E D , (0)]) ) ( [ (
expiq rDi t rEj
u
(1)
where
1,2 = , = ) ( 1 = i eq i iqr i
N
i D
D
U
¦
(2)
is a Fourier component of the microscopic density of species
i
.The diagonal terms D =E are denoted as the
incoherent intermediate scattering function
. (0)]) ) ( [ ( exp 1 = ) , ( 1 = i i i N i s
i iq r t r
N t q
F D D
D
¦
(3)The normalized partial- and incoherent intermediate scattering functions are given by
, ) ( )/ , ( = ) ,
(q t Fij qt Sij q
ij
) (4)
, ) , ( = ) ,
(qt Fis qt
s i
) (5) where the Sij(q) = Fij(q, t = 0) are the partial static
structure factors.
The basic equations of the MCT are the set of nonlinear matrix integrodifferential equations
, 0 = ) , ( ) , ( ) , ( ) ( ) , ( 0
2 W W W
q F t q M d t q F q t q
F :
³
t (6)where F is the 2x2 matrix consisting of the partial intermediate scattering functions Fij(q, t), and the
frequency matrix 2 is given by
>
2( )@
= 2 ( / ) ik>
1( )@
kj .k i i B
ij q k T x m S q
q
¦
: G (7)
S(q) denotes the 2x2 matrix of the partial structure factors
Sij(q), xi = Ni/N and mi means the atomic mass of the
species i. The MCT for the idealized glass transition predicts [41] that the memory kern M can be expressed at long times by
¦
¦
³
c cl k kl j i B ij dk x m T k t q M 3 ) (2 2 = ) , ( S U ) , ( ) ,(q kV q q k
Vikl jkl
u cc uFkkc(k,t)Fllc(qk,t) , (8)
where ȡ = N/Vol is the particle density and the vertex
ViĮȕ(q,k) is given by
) ( ) ( ) ( = ) ,
( c q k
q k q q k c q k q k q
Vikl Gil ik Gik il (9)
and the matrix of the direct correlation function is defined by
>
( )@
. =)
( 1 ij
i ij
ij S q
x q
c G
(10)
The equation of motion for Fis(q,t) has a similar form as Eq.(6), but the memory function for the incoherent intermediate scattering function is given by
3 Theory
) , ( ) ( 1 ) (2 = ) ,
( 3 cF kt
q k q dk t q
Mis ¸¸ i
¹ · ¨¨ © §
³
S U), , (q k t
Fis
u (11)
) , ( ) ( ) ( 2 ) , ( )) ( ( = ) , ( )
(cF i k t cii q 2Fii qt cii qcij q Fij qt
. ) , ( )) (
(cij q 2Fjj qt jzi
(12)
In order to characterize the long time behaviour of the intermediate scattering function, the nonergodicity parameters f(q) are introduced as
. ) , ( = )
(q lim qt
fij tof)ij
(13) These parameters are the solution of eqs. (6)-(10) at long times. The meaning of these parameters is the following: if fij(q) = 0, then the system is in a liquid state
with density fluctuation correlations decaying at long times. If fij(q) > 0, the system is in an arrested,
nonergodic state, where density fluctuation correlations are stable for all times. In order to compute fij(q), one can
use the following iterative procedure [23]:
Z q S q f f N q S q f l l
l 1)( )= ( ) [ (), ()]( ) ( )
( , ) ( | ) ]( , [ || ) ( | () () 2 Z q S q f f N q S
q l l
(14)
)) ]( , [ ) ( (
=q2 Tr S q N f() f() q
Z l l
, | ) ]( , [ || ) ( | () ()
2 S q N f f q
q l l
where the matrix N(q) is given by
. ) ( =
)
( M q
T k x m q N ij B i i
ij (15)
This iterative procedure, indeed, has two type of solutions, nontrivial ones with f(q) > 0 and trivial solutions f(q) = 0 .
The incoherent nonergodicity parameter fis(q) can
be evaluated by the following iterative procedure:
. ) ]( , [ = ) ( 1 ) ( , 1 , 1 , 2 q f f M q f q f
q sl is isl
i l s i (16)
As indicated by Eq.(16), computation of the incoherent nonergodicity parameter fis(q) demands that the coherent nonergodicity parameters are determined in advance.
m
g
–parameterBeyond the details of the MCT, equations of motion like (6) can be derived for the correlation functions under rather general assumptions within the Lanczos recursion scheme [38] resp. the Mori-Zwanzig formalism [39]. The approach demands that the time dependence of fluctuations A, B, ... is governed by a time evolution operator like the Liouvillian and that for two fluctuating quantitites a scalar products (B, A) with the meaning of a
correlation function can be defined. In case of a tagged particle, this leads for )is(q,t) to the exact equation
0 = ) , ( ) , ( ) , ( )/ , ( 0 0 2
0 qt dWM q t W qW
t
q si t i si
s
i : ) )
)
³
(17)
with memory kernel Mi0(q,t) in terms of a continued fraction.
Within Mi0(q,t) are hidden all the details of the time evolution of )is(q,t). As proposed and applied in [19,
20], instead of calculating Mi0(q,t) from the time evolution operator as a continued fraction, it can be evaluated in closed forms once )is(q,t) is known, e.g., from experiments or MD-simulations. This can be demonstrated by introduction of
^ `
( ) , lim := ) ( ) ( 0 Z H Z Z H i i sc r ) ) #
)
o
L (18)
with
^ `
( )= ()0dte t
z zt)
) f
³
L
(19)
the Laplace transform of )(t), and
^ `
( ) . lim := ) ( ) ( 0 0 00 Z Z H Z
H M i
iM
Mi c i s L i #
o
r
(20)
Eq.(17) then leads to
>
1 ( )@ >
( )@
.) ( =
)
( 2 2
0 Z Z Z Z Z Z c s c c i M ) ) )
(21)
On the time axis, Mi0(t) is given by
. ) ( cos ) ( 2 = ) ( 0 0 0 t M d t
Mi Z i Z c Z
S
³
f
(22)
Adopting some arguments from the schematic MCT, Eq.(17) allows asymptotically finite correlations
0 > ) , ( of
)is qt , that means an arrested state, if
) , (
0 of
t q
Mi remains finite where the relationship
holds . 1 = 1) ) , ( )( , ( 1
0 q tof ) q tof
Mi si
(23)
In order to characterize the undercooled melt and its transition into the glassy state, we introduced in [19] the function . 1) ) ( )(1/ ( := ) ,
() M0 M0 t ) t
G
(24)
According to (23), G(),M0) has the property that
1 = | ) ,
() M0 tof
G (25) in the arrested, nonergodic state. On the other hand, if
^
( , )|0< <`
<1 , :=MaxG ) M0 t fgm (26)
there is no arrested solution and the correlations )is(q,t)
decay to zero for t ĺ , that means, the system is in the liquid state. From that we proposed [19] to use the value of gm as a relative measure how much the system has
approached the arrested state and to use the temperature dependence of gm (T ) in the liquid state as an indication
First we show the results of our simulations concerning the static properties of the system in terms of the partial structure factors Sij(q) and partial correlation functions
gij(r).
To compute the partial structure factors Sij(q) for a
binary system we use the following definition [40]
, 1)
) ( ( =
)
(q x xx g r e dr
Sij iGijU i j
³
ij iqr (27)where
) ) ( ) ( ( =
) (
1, = 1 =
t r t r r N
N V r g
j N i N
j i
ij D E
D E E D
G
¦
¦
z
(28)
are the partial pair correlation functions.
The MD simulations yield a periodic repetition of the atomic distributions with periodicity length L. Truncation of the Fourier integral in Eq.(27) leads to an oscillatory behavior of the partial structure factors at small q. In order to reduce the effects of this truncation, we compute from Eq.(28) the partial pair correlation functions for distance
r
up to Rc=3/2L. For numerical evaluation of Eq.(27), a Gaussian type damping term is includedqr qr r
g r x x x
q
S ij
c R
j i ij
i ij
) ( sin 1) ) ( ( 4
= )
( 2
0
SU
³
G
dr R r/ ) ) ( ( exp 2
u
(29)
with
R=Rc/3.
Fig.1- fig.3 shows the partial structure factors Sij(q)
versus q for all temperatures investigated. The figure indicates that the shape of Sij(q) depends weakly on
temperature only and that, in particular, the positions of the first maximum and the first minimum in Sij(q) are
more or less temperature independent.
Fig. 1. Partial structure factors Ni-Ni-part at T = 1500 K, 1400 K, 1300 K, 1200 K, 1100 K, 1000 K, 1080 K, 1060 K,1040 K, 1020 K, 1010 K, 1005 K and 900 K (from top to bottom),the curves are vertically shifted by 0.05 relative to each other.
Fig. 2. Partial structure factors Ni-Zr-part at T = 1500 K, 1400 K, 1300 K, 1200 K, 1100 K, 1000 K, 1080 K, 1060 K, 1040 K, 1020 K, 1010 K, 1005 K and 900 K (from top to bottom),the curves are vertically shifted by 0.05 relative to each other.
Fig. 3. Partial structure factors Zr-Zr-part at T = 1500 K, 1400 K, 1300 K, 1200 K, 1100 K, 1000 K, 1080 K, 1060 K, 1040 K, 1020 K, 1010 K, 1005 K and 900 K (from top to bottom),the curves are vertically shifted by 0.05 relative to each other.
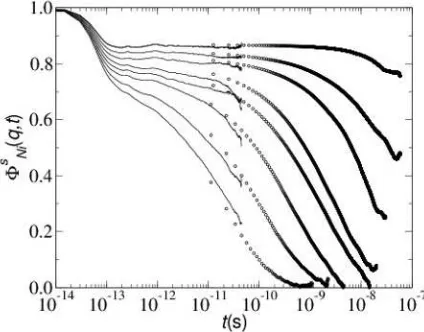
To investigate the dynamical properties of the system, we have calculated the incoherent intermediare scattering function (ISF) Fis(q,t) and the coherent intermediare scattering function (ISF) Fij(q,t) as defined
in equations (1) and (3).
Fig. 4. Incoherent intermediate scattering function )is(q,t)
Ni-part for q=24.4 nm-1 at T = 1500 K, 1400 K, 1300 K, 1200 K, 1100 K, 1000 K, 900 K, and 800 K (from left to right).
4 Results and Discussions
Fig. 5. The same as fig.4 but for Zr-part.
Fig.4 and Fig.5 presents the normalized incoherent intermediate scattering functions )is(q,t) of both species evaluated from our MD data for wave vector qn=2Sn/L
with n = 9, that means q9 =24.4 nm-1. From the figure we see that )si(q,t) of both species shows at
intermediate temperatures a structural relaxation in three succesive steps as predicted by the idealized schematic MCT [42]. The first step is a fast initial decay on the time scale of the vibrations of atoms (t<0.2 ps). This step is characterized by the MCT only globaly. The second step is the E-relaxation regime. In the early E-regime the correlator should decrease according to
a csi
s
i(q,t)= f (q)A/t
) and in the late E -relaxation
regime, which appears only in the melt, according the von Schweidler law fcsi(q)Btb. Between them a wide plateau is found near the critical temperature Tc. In the
melt, the D -relaxation takes place as the last decay step after the von Schweidler-law. It can be described by the Kohlrausch-Williams-Watts (KWW) law
) ) / ( ( exp = ) ,
(q t A0 tWD E
s
i
) where the relaxation time
D
W near the glass transition shifts drastically to longer times.
The inverse power-law decay for the early E -regime
a c At
f /
): is not seen in our data. This seems to be
due to the fact that in our system the power-law decay is dressed by the atomic vibrations ([19, 20] and references therein).
According to our MD-results, )si(q,t) decays to zero for longer times at all temperatures investigated. This is in agreement with the full MCT. Including transversal currents as additional hydrodynamic variables, the full MCT [41] comes to the conclusion that all structural correlations decay in the final D-process, independent of temperature. Similar effects are expected from inclusion of thermally activated matter transport, that means diffusion in the arrested state.
At T = 900 K - 800 K, the )si(q,t) drop rather
sharply at large t. This reflects aging effects which take
place, if a system is in a transient, non-steady state [43]. Such a behaviour indicates relaxations of the system on the time scale of the ’measuring time’ of the correlations.
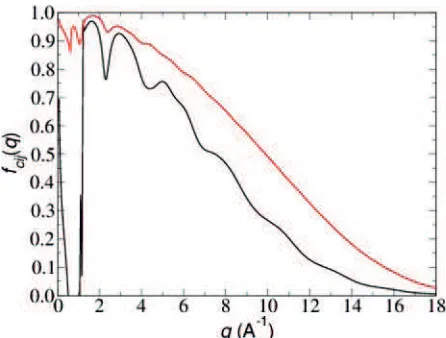
The nonergodicity parameters are defined by Eq.(13) as a non-vanishing asymptotic solution of the MCT Eq.(6). Fig. 6 presents the estimated q-dependent nonergodicity parameters from the coherent scattering functions of Ni and Zr at T = 1005 K.
Fig. 6. Non-ergodicity parameter fij for coherent intermediate
scattering functions as solutions of eqs. (13)(red-line for Zr and black-line for Ni)
In order to compute the nonergodicity parameters
fij(q) analytically, we followed for our binary system the
self-consistent method as formulated by Nauroth and Kob [23] and as sketched in Section III.A. Input data for our iterative determination of fij(q) = Fij(q,) are the
temperature dependent partial structure factors Sij(q) from
the previous subsection. The iteration is started by arbitrarily setting FNiNi(q,f)(0) =0.5SNiNi(q),
) ( 0.5 = ) ,
(q (0) S q
FZrZr f ZrZr , FNiZr(q,f)(0) =0.
For T > 1100 K we always obtain the trivial solution
fij(q) = 0 while at T = 1000 K and below we get stable
non-vanishing fij(q) > 0. The stability of the
non-vanishing solutions was tested for more than 3000 iteration steps. From this results we expect that Tc for our
system lies between 1000 and 1100 K. To estimate Tc
more precisely, we interpolated Sij(q) from our MD data
for temperatures between 1000 and 1100 K by use of the algorithm of Press et.al. [44]. We observe that at
1005 =
T K a non-trivial solution of fij(q) can be found,
but not at T =1010 K and above. It means that the critical temperature Tc for our system is around 1005 K.
The non-trivial solutions fij(q) for this temperature shall
be denoted the critical nonergodicty parameters fcij(q).
They are included in Fig. 6.
By using the critical nonergodicity parameters fcij(q),
the computational procedure was run to determine the critical nonergodicity parameters fcis(q) for the incoherent scattering functions at T =1005 K .
) , ( si Mi0
g ) -Function and gm-Parameters
Here we present our results about the g()si,Mi0) -function [19, 20] described in section III.B. The memory functions Mi0(q,t) are evaluated from the MD data for
) , (q t
s i
) by Fourier transformation along the positive
time axis. For completeness, also 800 K data is included where the corresponding )si(q,t) are extrapolated to longer times by use of an KWW approximation.
Fig. 7. Ni-Part: Time dependence of the dimensionless memory
function Ms0(q,t)/:s2i from MD simulations for q9 =24.4
nm-1 and =
T 800 K, 900 K, 1000 K, 1100 K, 1200 K, 1300 K, 1400 K, and 1500 K (from top to bottom)
Fig. 8. The same as fig.7 but for Zr-part.
Fig. 7 and Fig. 8 show the thus deduced Mi0(q,t) for
24.4 =
q nm-1. Regarding their qualitative features, the
obtained Mi0(q,t) are in full agreement with the results in [20] for the Ni0.5Zr0.5 system. A particular interesting
detail is the fact that there exists a minimum in Mi0(q,t)
for both species, Ni and Zr, at all investigated temperatures around a time of 0.1 ps. Below this time,
) , (q t
s i
) reflects the vibrational dynamics of the atoms. Above this value, the escape from the local cages takes place in the melt and the E -regime dynamics are developed. Apparently, the minimum is related to this crossover.
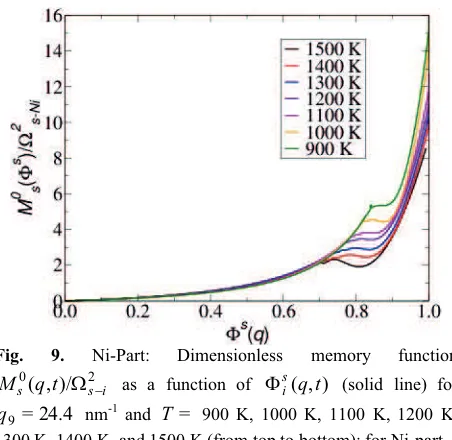
Fig. 9. Ni-Part: Dimensionless memory function
2 0
)/ , ( s i s qt
M : as a function of )si(q,t) (solid line) for
24.4 =
9
q nm-1 and T = 900 K, 1000 K, 1100 K, 1200 K, 1300 K, 1400 K, and 1500 K (from top to bottom); for Ni-part.
Fig. 10. The same as fig.9 but for Zr-part.
In Fig. 9 and Fig. 10 we display Mi0(q,)is(q,t)), that means Mi0(q,t) versus )is(q,t). In this figure we again find the features already described for Ni0.5Zr0.5 in [19,
20]. According to the plot, there exist (q-dependent) limiting values )is0(q,t) so that Mi0(q,t) for
) , ( < ) ,
(q t is0 q t
s
i )
) is close to an universal behavior,
while for )si(q,t)>)si0(q,t) marked deviations are seen. )si0(q,t) significantly decreases with increasing temperature. It is tempting to identify Mi0(q,t) below
) , (
0 q t
s i
) with the polynomial form for Mi0(q,t)
assumed in the schematic version of the MCT [41]. By use of the calculated memory functions, we can evaluate the g()is,Mi0), Eq.(24). In Fig.11 and Fig. 12 this quantity is presented versus the corresponding value of )is(q,t) and denoted as g()si). For all the
investigated temperatures, g()si) has a maximum
gm(q,T) at an intermediate value of ). In the high
decreasing temperature towards the limiting value 1. This is, in particular, visible in Fig. 13 where we present
gm(q,T) as function of temperature for both species, Ni
and Zr, and wave-vectors q9= 24.4 nm-1. At temperatures
above 1000 K, the gm-values increase approximately
linear towards 1 with decreasing temperatures. Below 1000 K, they remain close below the limiting value of 1, a behavior denoted in [19, 20] as a balancing on the borderline between the arrested and the non-arrested state due to thermally induced matter transport by diffusion in the arrested state at the present high temperatures.
Fig. 11. Ni-part: MD simulation results for the characteristic
function g(s) as a function of )si for q = 24.4 nm-1
Fig. 12. The same as fig.11 but for Zr-part.
Linear fit of the gm-values for Ni above 950 K and for
Zr above 1000 K predicts a crossover temperature Tc*
from liquid ( gm < 1) to the quasi-arrested ( gm = 1)
behavior around 970 K from the Ni data and around 1020 K from the Zr data. We here identify this crossover temperature with the value of Tc as visible in the ergodic,
liquid regime and estimate it by the mean value from the Ni- and Zr-subsystems, that means by Tc = 1000 K.
While in [19, 20] for the Ni0.5Zr0.5 melt a Tc -value of
1120 K was estimated from gm(T), the value for the
present composition is lower by about 120 K. A significant composition dependence of Tc is expected
according to the results of MD simulation for the closely related CoxZr1-x system [18]. Over the whole x-range, Tc
was found to vary between 1170 and 650 K in CoxZr1-x,
with Tc ( x=0.2 )
;
800 K. Regarding this, the presentdata for the NixZr1-x system reflect a rather weak Tc
variation.
Fig. 13. MD simulation results of the temperature dependence of gm(q,T) for q9 = 24.4 nm-1 (symbols). Linear fits to the
gm(q,T) are included by full and dash lines ( for q9 = 24.4 nm-1);
a) Zr-part with Tc = 1020 K and b) Ni-part with Tc = 970 K.
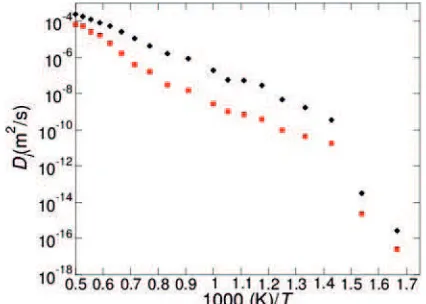
From the simulated atomic motions in the computer experiments, the diffusion coefficients of the Ni and Zr species can be determined as the slope of the atomic mean square displacements in the asymptotic long-time limit
. 6
(0) ) ( ) (1/
lim = ) (
2 1
=
t t N
T D
i N
i
t i
D D D
r
r
¦
f
o (30)
Fig. 14 shows the thus calculated diffusion coefficients of our Ni0.8Zr0.2 model for the temperature
range between 600 and 2000 K. At temperatures above approximately 1000 K, the diffusion coefficients for both species run parallel to each other in the Arrhenius plot, indicating a fixed ratio DNi/DZr 2.5 in this temperature
regime. At lower temperatures, the Ni atoms have a lower mobility than the Zr atoms, yielding around 800 K a value of about 10 for DNi/DZr. That means, here the Zr
atoms carry out a rather rapid motion within a relative immobile Ni matrix.
According to the MCT, above Tc the diffusion
coefficients follow a critical power law
c c
i T T T T T
D( ):( )J,for >
(31) with non-universal exponent [45].
In order to estimate Tc from this relationship, we have
adapted the critical power law by a least mean squares fit to the simulated diffusion data for 1000 K and above. According to this fit, the system has a critical temperature of about 850-900 K.
Similar results for the temperature dependence of the diffusion coefficients have been found in MD simulations for other metallic glass forming systems, e.g., for Ni0.5Zr0.5 [28], for NixZr1-x [18], Cu0.33Zr0.67 [46], or
Ni0.81B0.19 [47]. In all cases, like here, a break is observed
in the Arrhenius slope. In the mentioned Zr-systems, this break is related to a change of the atomic dynamics around Tc whereas for Ni0.81B0.19 system it is ascribed to
TG As in [47] Tc and TG apparently fall together, there is
no serious conflict between the obervations.
Fig. 14. Diffusion coefficients Di as a function of 1000/T.
Symbols are MD results for Zr (squares) and Ni (diamonds)
The present contribution reports results from MD simulations of a Ni0.8Zr0.2 computer model. The model is
based on the electron theoretical description of the interatomic potentials for transition metal alloys by Hausleitner and Hafner [34]. There are no parameters in the model adapted to the experiments.
There is close agreement between the Tc values
estimated from the dynamics in the undercooled melt when approaching Tc from the high temperature side. The
values are Tc 950 - 1020 K from the gm-parameters,
and Tc 950 K from the diffusion coefficients. As
discussed in [18], the Tc -estimates from the diffusion
coefficients seem to depend on the upper limit of the temperature region taken into account in the fit procedure, where an increase in the upper limit increases the estimated Tc. Accordingly, there is evidence that the
present value of 950 K may underestimate the true Tc by
about 10 to 50 K, as it based on an upper limit of 2000 K only. Taking this into account, the present estimates from the melt seem to lead to a Tc value around 1000 K.
The Tc from the nonergodicity parameters describe the
approach of the system towards Tc from the low
temperature side. They predict a Tc value of 1005 K. This
value is clearly outside the range of our Tc estimates from
the high temperature, ergodic melt. We consider this as a significant deviation which, however, is much smaller than the factor of two found in the modelling of a Lennard-Jones system [23]. The here observed deviation between the Tc estimates from the ergodic and the
so-called nonergodic side reconfirm the finding from the soft spheres model [22] of an agreement within some 10 % between the different Tc -estimates.
In the future to overcome these discrepancies, it will be included in computation the static triplet correlations, as suggested by D.Coslovich [48]. From the theoretical side, prediction of three-point dynamic correlation
functions has been possible within the so-called inhomogeneous mode-coupling theory (IMCT) [49], an extension of the standard mode-coupling theory (MCT) [2] of the glass transition, which accounts for the dynamic response of a fluid to an external field. The predictions of IMCT suffers from the same shortcomings of MCT, i.e., the dynamic correlation volume diverges at a finite temperature; furthermore, the predicted scaling behavior in the vicinity of the avoided, putative singularity is inconsistent with the available simulation data for four-point dynamic susceptibilities [50, 51].
References
1. H. Teichler, Phys.Rev. Lett. 107(6), 067801 (2011) 2. W. Götze, Complex dynamics of glass-forming
liquids: a mode-coupling theory, Oxford University
Press, New York, (2009)
3. K. Chang,The New York Times, July 29, 2008. 4. G. Tarjus, In: Heterogeneities and Glasses,
Dynamical, edited by L. Berthier, G. Biroli, J-P
Bouchaud, L. Cipelletti, and W. van Saarloos, Oxford University Press, (2011)
5. M. Mezard and G. Parisi, Phys.Rev.Lett. 82(4), 747 (1999)
6. J.H. Gibbs and E. A. DiMarzio, J.Chem.Phys. 28(3), 373 (1958)
7. B.Colluzi, G.Parisi, and P.Verrochio, Phys.Rev.Lett.
84(2), 306 (2000)
8. T. S. Grigera and G. Parisi, Phys. Rev. E 63, 045102(R) (2001)
9. L. Santen and W. Krauth, Nature 405(6786), 550 (2000)
10. W. Götze and L. Sjögren, Rep. Prog. Phys. 55(3), 241 (1992)
11. W. Kob und H.C. Andersen, Phys. Rev. E 51(5), 4626 (1995)
12. S. Sastry, P. G. Debendetti and F. H. Stillinger, Nature 393(6685), 554 (1998)
13. F. Sciortino, W. Kob, and P. Tartaglia, Phys. Rev. Lett. 83(16), 3214 (1999)
14. C. Donati, S. C. Glotzer, P. H. Poole, W. Kob, and S. J. Plimpton, Phys.Rev. E 60(3), 3107 (1999)
15. B. Colluzi, G. Parisi, and P. Verrochio, Phys. Rev. Lett. 112(6), 2933 (2000)
16. R. Yamamoto and W. Kob, Phys.Rev. E 61(5), 5473 (2000)
17. A.B. Mutiara and H. Teichler, Phys. Rev. E 64(4), 46133 (2001)
18. U. Rössler and H. Teichler, Phys. Rev. B 61, 394 (2000)
19. H. Teichler, Phys. Rev. Lett. 76, 62(1996). 20. H. Teichler, Phys. Rev. E 53, 4287 (1996).
21. J.L. Barrat and A. Latz, J. Phys. Cond. Matt. 2, 4289 (1990)
22. M. Fuchs, Thesis, TU-Muenchen (1993); M. Fuchs and A. Latz, Physica A 201, 1 (1993)
23. M. Nauroth and W. Kob, Phys. Rev. E 55, 657 (1997)
24. M. Kuschke, Thesis, Universität Stuttgart (1991).
5
25. Yan Yu, W.B. Muir and Z. Altounian, Phys. Rev. B
50, 9098 (1994)
26. Böddeker and H. Teichler, Phys. Rev. E 59, 1948 (1999)
27. H. Teichler, phys. stat. sol. (b) 172, 325 (1992) 28. H. Teichler, in: Defect and Diffusion Forum
143-147, 717 (1997)
29. H. Teichler, in: Simulationstechniken in der
Materialwissenschaft, edited by P. Klimanek and M.
Seefeldt, TU Bergakadamie, Freiberg, (1999) 30. H. Teichler, Phys. Rev. B 59, 8473 (1999).
31. X.J. Han and H. Teichler, Phys. Rev. E 75(6), 61501 (2007)
32. M. Guerdane and H. Teichler, Phys. Rev. Lett
101(6), 065506(2008)
33. I. Ladadwa and H. Teichler, Phys. Rev. E 78(4), 41503 (2008)
34. Ch. Hausleitner and Hafner, Phys. Rev. B 45, 128 (1992)
35. W. Götze, Z. Phys. B 60, 195 (1985)
36. J. Bosse and J.S. Thakur, Phys. Rev. Lett. 59, 998 (1987)
37. B. Bernu, J.-P. Hansen, G. Pastore, and Y. Hiwatari, Phys. Rev A 36, 4891 (1987); ibid. 38, 454 (1988). 38. C. Lanczos. J. Res. Natl. Bur. Stand. 45, 255 (1950). 39. R. Zwanzig, J. Chem. Phys. 33, 1338 (1960); H.
Mori, Prog. Theor. Phys. 33, 423 (1965)
40. J.P. Hansen and I.R. McDonald, Theory of Simple
Liquids, 2nd Ed., Academic Press, London, (1986).
41. W. Götze and L. Sjögren, Rep. Prog. Phys. 55, 241 (1992)
42. J.-P. Hansen and S. Yip, Transp. Theory Stat. Phys.
24, 1149 (1995)
43. W. Kob and J.L. Barrat, Physica A 263, 1 (1999); Phys. Rev. Lett. 78, 4581 (1997)
44. W.H. Press, B.P. Flannery, S.A. Teukolsky and W.T.
Vetterling, Numerical Recipes, 2nd.Edition,
University Press, Cambrigde, New York, (1992) 45. W. Kob and H.C. Andersen, Phys. Rev. E 51, 4626
(1995)
46. C. Gaukel, Thesis, TU-Aachen (1998) 47. L. D. van Ee, Thesis, TU-Delft (1998)
48. D. Coslovich, J. Chem. Phys. 138, 12A539 (2013) 49. G. Biroli, J.-P. Bouchaud, K. Miyazaki, and D. R.
Reichman, Phys. Rev. Lett. 97, 195701 (2006) 50. L. Berthier, G. Biroli, J.-P. Bouchaud, W. Kob, K.
Miyazaki, and D. R. Reichman, J. Chem. Phys. 126, 184504 (2007)