FIRE STATIONS LOCATION ANALYSIS AND FIRE BRIGADE
ROUTE FINDING IN SURABAYA
Arya Tandy Hermawan *, Yong Saputra **, Gunawan †, Marini Handayani *** * Information Technology Graduate Program, Sekolah Tinggi Teknik Surabaya
** Industrial Engineering Department, Sekolah Tinggi Teknik Surabaya *** Computer Science Department, Sekolah Tinggi Teknik Surabaya
Ngagel Jaya Tengah 73-77, Surabaya 60284, Indonesia
† Electrical Engineering Department, Faculty of Industrial Technology, Institut Teknologi Sepuluh Nopember Kampus ITS Keputih, Sukolilo, Surabaya 60111, Indonesia
email: [email protected] *, [email protected] **, [email protected] †, [email protected] ***
ABSTRACT
This research is consists of two related task. Task I is determining which fire station will be called, if there are fire problems in a particular location. Task II is searching the routes which can be accessed by the fireman and has the smallest time estimation.
This research also provides facilities to determine whether the fire stations have already been optimal or not. For accomplishing that, heuristic method is used.
Heuristic method, which is used in this research creates the demand cost table and fixed cost table. If there is only one station, we choose the station which has the minimum total cost to handle all streets. If not, minimum savings table is created. From the minimum savings table, the station which has the biggest net savings is chosen to handle all streets. From the savings table, it chooses the station which has the biggest savings table, and moves the streets which support saving in the station which has the biggest savings table. Savings table created until all stations have been chosen, or there are not any savings values. The last check has been done by changing the position of the stations with the other positions to get the minimum cost.
Keywords – Location Analysis, Heuristic, Fire Station, Optimum A*
1
INTRODUCTION
In a complex industrial world, there is a field that specifically deals with factory layout planning. One of the things studied in this field is that if we want to establish a certain unit station, where this unit station should be located needs several important considerations. The unit station mentioned can be in the form of a business unit station or a fire department station. Besides that, this field is also useful for optimizing the number of similar unit stations that must be located in a specific area. Optimizing here means to decide the most sufficient and efficient number of stations. If there have been stations located in
that area, the next question is whether the number of the existing stations is already sufficient or not.
The objective of this research is to decide the most sufficient number of a certain unit stations (in this case fire department stations) in Surabaya by considering which fire stations that will be called if there is fire in a certain area. This research will also help industrial people in Surabaya to make a planning for the location of a certain unit station (in this research, the location of fire department is used as the case study) using the Heuristic Method.
2
TASK I: LOCATION ANALYSIS
As shown in the flowchart in figure 1, the Heuristic Method to analysis location of the fire stations has the following steps:
The first step is to make a demand cost table. Cost here means the distance. If the number of facilities (fire stations) allowed to exist is two or more, then step 2 is done. If not, sum each column to produce the total cost variable, which is needed by all streets leading to a certain fire station. Then, add the total cost variable with the fixed cost in each column. Choose a fire station with a minimum overall cost and the station is given the duty to protect all the streets. This is an sufficient solution if there is only one station available, and the search process can be stopped.
The second step is good preliminary steps if there is more than one fire station that can be described using the ‘minimum saving’ table explained as follows: For each street, the difference between the first and the second minimum costs is calculated. This difference is called ‘minimum increment’. Minimum increment displays the minimum number that will be kept if the street is covered by the fire station with the minimum cost. All other fire stations will only widen the cost values. To make the minimum saving table, move the minimum increment of each street in fire stations that have the minimum costs.
variable. Because there should be at least one fire station to fulfill the demand, the first fire station is then placed on the fire station that has the lowest cost (which means that it has the biggest net savings). This fire station will serve all the existing streets.
The fourth step is to determine the savings value in moving each street from fire stations that are assigned to serve to fire stations that are not assigned. If there are no savings value for the not-assigned fire stations, mark it with “-”.
In the fifth step, the number of columns of each not-assigned fire station is totaled. The result displays savings that can be gotten if the street is served by the column. The sum is deducted by the fixed cost of each column, and then another assignment is made to a fire station that has the maximum net savings. This is done because an additional fire station will only be used if the particular fire station can reduce its total costs. This fire station is then chosen to be part of ‘fire stations on duty’. The streets that support the savings are moved to this fire station. If all fire stations have been assigned to serve, or if there are no columns with savings values can be found, step six is then done. If not, it goes back to step 4.
Step six. This step is for the final check. For every fire station assigned to serve, the cost that might come up is determined if each street served by this fire station is moved to another assigned fire station that has a bigger cost. Please note that this will probably cause a change so as that a particular street will also be served by another fire station. These costs are summed. If the sum is less than the fixed cost for the particular fire station, additional savings can be gotten by not choosing this fire station to be the fire station on duty, instead this station is not assigned to serve. Checking is done to all fire stations that are assigned to serve, and a fire station with the maximum savings is chosen. Step six is repeated until there are no savings that can be gotten. This is the sufficient result.
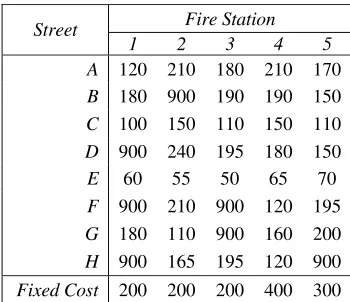
Table 1. Demand Cost and Fixed Cost
Fire Station Street
1 2 3 4 5 A 120 210 180 210 170 B 180 900 190 190 150 C 100 150 110 150 110 D 900 240 195 180 150
E 60 55 50 65 70
F 900 210 900 120 195 G 180 110 900 160 200 H 900 165 195 120 900 Fixed Cost 200 200 200 400 300
Next, a case example and the calculation are given to get a sufficient solution, which in this case, the demand cost and fixed cost are given directly.
Figure 1. Flowchart Location Search
Y
N
Y Y
N
N
More than 1 facility?
Make demand and fixed cost table
Start
Make minimum savings table
Place first facility
Put customers on the next
No facilities can be placed
Do final check on the appointed
Make location that is not appointed Make savings
table
Final Solution Choose a location
the minimum cost,
Do the savings still exist? Have all facilities
been appointed?
Is there saving for the location not
i d?
N
Y
There are 8 streets that are expected to be able to be served by fire stations in five locations. The demand cost data (past data about the incidences of fire multiplied by each transportation cost) and the fixed cost data are displayed in table 1. The value of the minimum savings are then calculated by taking the margin between the lowest minimum transportation cost and the second lowest minimum transportation cost for each street and the result is put in a fire station that the lowest minimum cost for the particular street (example: station 1 is deducted by station 5 for street A; the result is put in station 1). The total for each column is deducted by the fixed cost and the result is put in the net savings variable. Because station 1 has the smallest net savings (mark ‘-’ is ignored), the first station is then put there and all the streets will be served by it. To determine the second station, the process continues by calculating the value for the first savings table. The transportation cost in station 1 is deducted by the transportation cost in other stations for each street.
The result is put in those stations (for example, station 1 deducted by station 2 for street A, the result is put in station 2). If the result is negative (<0) the value is then changed with mark ‘-’. Because station 2 has the maximum savings, the second station is then put there, and streets D, E, F, G, and H will be served by station 2.
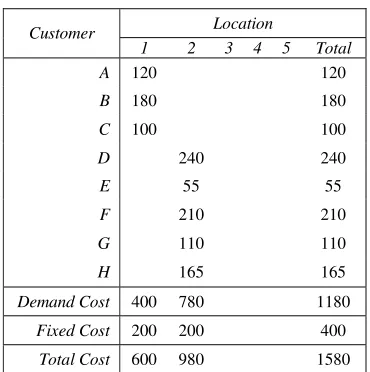
To check the possibility for placing the third station, calculate the second savings table by subtracting the transportation cost in other stations with the transportation cost in station 2 for streets D, E, F, G, and H. The result is put in other stations (for example, station 3 subtracted by station 2 for street A, the result is put in station 3). If the result is negative (<0) the value is then changed with mark ‘-’. Because there are no net savings in any unassigned stations, the last request is the best solution as shown in the total cost table in table 2.
Table 2. Total Cost for Final Solution
Location Customer
1 2 3 4 5 Total
A 120 120
B 180 180
C 100 100
D 240 240
E 55 55
F 210 210
G 110 110
H 165 165
Demand Cost 400 780 1180
Fixed Cost 200 200 400
Total Cost 600 980 1580
The next step is to do the final check. If the streets served by station 1: A, B, and C are moved to station 2, the transportation cost will rise like this: 90 + 720 + 50 = 860 (see table 1). Because the savings are less than the fixed cost (fixed cost for station 1 = 200), transfer can not be done. In the same way, if the streets served by station 2 are moved to station 1, the transportation cost will increase like this: 660 + 5 + 690 + 70 + 735 = 2160.
The fixed cost stored in station 2 is 200. Once again, transfer is denied. The solution in table 2 is the sufficient one.
3
TASK II: ROUTE FINDING
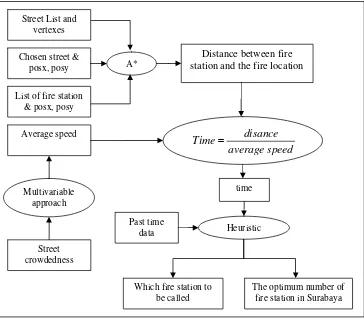
This part will explain how to determine a route for fire brigade in order to find the shortest path to the location of the fire. In a whole, the procedure is explained in a diagram, containing all data about the participating factors and the processes involved. This can be seen in figure 2.
In the diagram, it can be seen how the system works. First, there is a list of all the big streets in Surabaya. This list also contains vertexes that represent each street. After that, there is also a list of the fire stations along with their locations. The input needed is on which street a fire happens (this street is then chosen).
The location of the fire and the location of the fire station are used as the input to search for the distance using algorithm A* [1] to get the shortest route between the fire station and the fire location. The distance data also contains the average speed to estimate the time search. Beforehand, the average speed value needs to be modified using a multivariable approach due to influences from other factors. These other factors become the variables.
Street length is not included as the other factors that influence the speed, instead it is considered as the main factor. To simplify the modification of speed using the multivariable approach, below is the basic explanation:
• Suppose there are 2 other factors that influence the value of the average speed, namely street crowdedness and street width.
• For each factor, it is determined how much this factor affects the average speed in percentage. For example, the crowdedness affects the speed by 70% and the street width affects by 30%. Or perhaps, the ratio is 6:4, that is the crowdedness has a 60% effect and the street width has 30%. These values can be arranged by the programmer himself. It should be noticed that the total percentage of the effects of these other factors should be 100%.
• To make it clearer, here is the illustration: Street crowdedness affects by 70%. Street width affects by 30%. 1. Example: speed Æ crowdedness 0 Æ speed = initial speed
2. Example: speed Æ street crowdedness and width Width
1m Æ speed = initial speed
10m Æ speed = initial speed – 10% (initial speed) Crowdedness
0 Æ speed = initial speed
1 Æ speed = initial speed + 100% (initial speed) Speed = 30% speed (width) + 70 speed (crowdedness)
After the average speed value is received, the modification process uses the multivariable approach, and then the value is used together with the distance value using the A* calculation to gain the amount of time spent from the fire station to the fire location using this formula:
, where:
time: time spent from the fire station to the fire location distance: the distance value gained with A* calculation
average speed: the average speed value after modification After the time has been calculated, it is used altogether with data about the number of past fire occurrences, using the heuristic method to get data about which fire station will be called out if there is fire in location x. Besides that, it will also be known if the number of fire stations in Surabaya is already sufficient or not.
There are several important notes that should be noticed if Heuristic Method is to be used.
• Heuristic Method to be used is the heuristic method that has been explained in sub-chapter 2.1 starting from point 1 until point 6.
• In this program of the fire station location analysis, the fixed cost should be nullified (= 0). This happens because the ‘cost’ here is not in the form of a certain money currency, but the distance from the fire station to the fire location. Because there is no relationship between money currency and distance, the fixed cost should be nullified.
• Aside from that, the nullification of the fixed cost is also due to the inability to gain data about the fire fighters’ salaries (which can be made as the fixed cost).
Figure 2. Main Architecture Street List and
vertexes
Chosen street & posx, posy
List of fire station & posx, posy
A*
Distance between fire station and the fire location
speed
average
disance
Time
=
time
Past time
data Heuristic
Which fire station to be called
The optimum number of fire station in Surabaya Street
In this research, it is assumed that each street can be served by all fire stations, therefore, there is no “*” in the data. “*” is a sign that indicates if a certain fire station cannot serve due to certain reasons.
4
TESTING
Tests are conducted to determine which fire station will be called if there is a fire occurrence in a certain location and to find routes with the shortest time estimate from the fire station to the fire location. These tests will determine whether the results will be quite appropriate with the real situation. The tests are conducted on some streets.
It should be noticed that the time estimates gotten from this program are not the time estimates for the fire fighters to reach the location, but for the fire engines to arrive to the location. Other factors that can influence the speed of the fire engines to reach a location are also ignored.
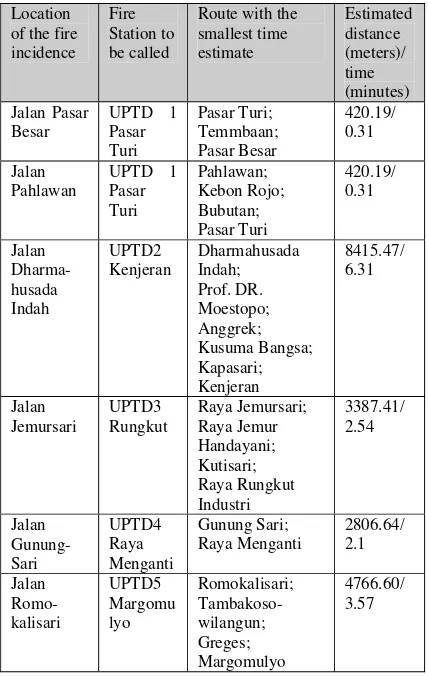
Table 3. Route Finding Testing Results
Location
Route with the smallest time
Table 3 contains the results of this program in the event of a fire occurrence on Jalan Pahlawan, disregarding the influences of other factors towards the speed of the fire engines (average speed = 80 km/hour).
From table 3, it is also known that if there is fire on Jalan Pahlawan, the fire station that can be called is the Pasar Turi central fire department (UPTD 1). The street route with the smallest time estimate can be seen in column 2, and the distance estimate between the fire station and the fire location is 420.19 meters with the time estimate of 0.31 min for the fire engine to reach the location).
Figure 3. Application screen shot
Screen shot of the application can be seen in figure 3. The application was built to demonstrate the results of our research. Here are some descriptions about the application:
1: The name of the streets 2: Button to show the fire station 3: Called fire station
4: Estimation time from the fire station to the location 5: Estimation distance from the fire station to the location 6: Show the route from the fire station to the location 7: Printing the route
8: Button to close the application
5
CONCLUSION
In this part, the conclusions that can be drawn from the research are the following:
• Algorithm A* can be used to determine the shortest route from the fire station to the fire location. It is because this algorithm is a search algorithm that can be used to solve almost all search problems.
• Heuristic Method can be used to determine which fire station should be called in case there is fire on
location X by using the smallest time estimate. This method uses distance data produced by Algorithm A*, which then the travel time is counted using the distance formula.
• Heuristic Method can also be used to determine whether the number of fire stations in Surabaya is already sufficient or not.
A short explanation regarding the Heuristic Method used is described in these two next points:
• First, make a table of demand cost and fixed cost. If there is only one station, choose the station with the minimum cost to handle all the streets. The process finishes here and this is the optimum solution. • If there are two or more stations, make a minimum
savings table. From the minimum savings table, choose a station with the biggest net savings to handle all the streets. Then, make a savings table. From this savings table, choose a station with the biggest net savings, and move the streets that support savings in the savings table to the newly chosen station. Do table savings calculation over and over again until all stations have been chosen or there are no more columns with the savings values found. Final check is carried out by switching the stations’ positions to get the minimum cost. The process finishes and this is the optimum solution.
• In reality, if there is a big fire occurrence, all fire stations in Surabaya will be called to handle it, including fire stations owned by private institutions. .
REFERENCE
[1] Pearl, Judea. Heuristics: Intelligent Search Strategies for Computer Problem Solving. Addison-Wesley. 1984.
[2] Russel, Stuart, Peter Norvig. Artificial Intelligence: A Modern Approach. Prentice Hall. 2002.
[3] Sule, Dileep R. Manufacturing Facilities: Location, Planning and Design. PWS Publishing Company. 1994.