TIME SERIES ANALYSIS OF INSAR DATA TO STUDY LAND SUBSIDENCE INDUCED
BY GROUNDWATER LEVEL DECLINE IN SIRJAN PLAIN
A. Choopani a, M. Dehghanib, M. R. Nikoob , S. Zeinalic
a Dept. of Civil and Environmental Engineering, School of Engineering, Shiraz University, Iran - [email protected] b Dept. of Civil and Environmental Engineering, School of Engineering, Shiraz University, Iran - [email protected]
b Dept. of Civil and Environmental Engineering, School of Engineering, Shiraz University, Iran - [email protected] c Dept. of Civil and Environmental Engineering, School of Engineering, Shiraz University, Iran - [email protected]
KEY WORDS: Subsidence, InSAR, Sirjan Plain, Satellite imagery, ENVISAT ASAR, Piezometric wells.
ABSTRACT:
Sirjan located in Southwest of Kerman City, Iran, is a city with average annual rainfall of 132mm. Over-exploitation of groundwater used for irrigation of pistachios gardens has caused serious land subsidence in Sirjan Plain. In this research we have used the Interferometric Synthetic Aperture Radar technique to estimate the subsidence rate in Sirjan plain. 18 Interferograms extracted from 12 ENVISAT ASAR images spanning between April 2004 and September 2010, have been studied. The SBAS algorithm was then applied in order to estimate the mean subsidence velocity map. Maximum subsidence rate is estimated as 28cm/yr. Furthermore, groundwater level fluctuations in the study area has been investigated in the piezometer wells located in the study area. Comparing between the results obtained from the interferometry and groundwater level fluctuation maps, shows a strong correlation between head decline in groundwater and land subsidence.
1.INTRODUCTION
Aquifers are one of the most important water sources for agriculture, industry and drinking. Excessive extraction of groundwater is followed by population growth and industrial activities’ development, which will result in subsidence in ground surface (Gumilar, 2015). In fact, subsidence is downward movement of ground surface either gradually or suddenly, both can be result of natural causes or human activities. Groundwater level decline, degradation of subsurface structure strength and karst destruction, are the most general reasons for subsidence occurrence in Iran. Subsidence can disturb the stability of human made structures including historical buildings. The important point is to study and analyse accurately the subsidence, especially in potential places, to inhibit the consequences such as change in groundwater quality, increase in energy consumed for water extraction from aquifer, vulnerability of plain against drought, land subsidence, ecosystem extinction, and gardens drying out.
Subsidence phenomena can be studied by hydrogeology methods such as groundwater level, extensometer, and piezometer observation and also by geodetic methods like mapping points using GPS and radar interferometry technique (Abidin, 2008). Radar interferometry technique is an effective and accurate method with high spatial resolution which is used for ground surface phenomena aimed to measure any kind of movement or deformation on ground surface (Kumar, 2011). Considering studies accomplished so far, it is concluded that radar interferometry technique is a reliable method with desired accuracy for estimating subsidence.
On the other hand, interferometry failure due to temporal decorrelation can be reduced by Small Baseline Subset (SBAS) InSAR time series analysis method during a long time period (Zhou, 2013). Many researches have been carried out in the
estimated the subsidence rate up to 19 cm per year for Neyshabour city employing radar interferometry technique using ENVISAT ASAR images (Dehghani, 2009). Khakim et al. used interferograms calculated from 21 images in ascending mode for the time period of Jan 1st 2007 to Mar 3rd 2011, and estimated subsidence rate about 45 cm for Bandung Basin, Indonesia (Khakim, 2014). Abidin et al. found the rate of subsidence by radar interferometry technique of ALOS PALSAR images, comparable to the rate obtained from GPS measurements from 2000 to 2010 (Aidin, 2011). Amighpey and Arabi estimated Yazd the maximum subsidence rate of 12 cm between years 2003-2006 using radar interferometry technique, and mentioned that this rate of subsidence is probably due to 19 meters decline in groundwater level since 1974 (Amighpey and Arabi, 2016). Samsonov et al. using ALOS data, estimated land deformation of Taupo volcanic zone from 2006 to 2010. In this study, the results of DInSAR method were improved by SBAS algorithm.
In this paper, interferometry technique is used to study the subsidence of Sirjan Plain. 12 images of ENVISAT ASAR as well as 53 piezometric wells spanning between Apr 2004 and Sep 2010 were applied to interpret the subsidence signal. In the next section, InSAR method to obtain the interferograms and SBAS time series algorithm used in this study will be introduced. In section 3, the results and discussion will be presented. Concluding remarks are presented in the last section.
2.METHODOLOGY
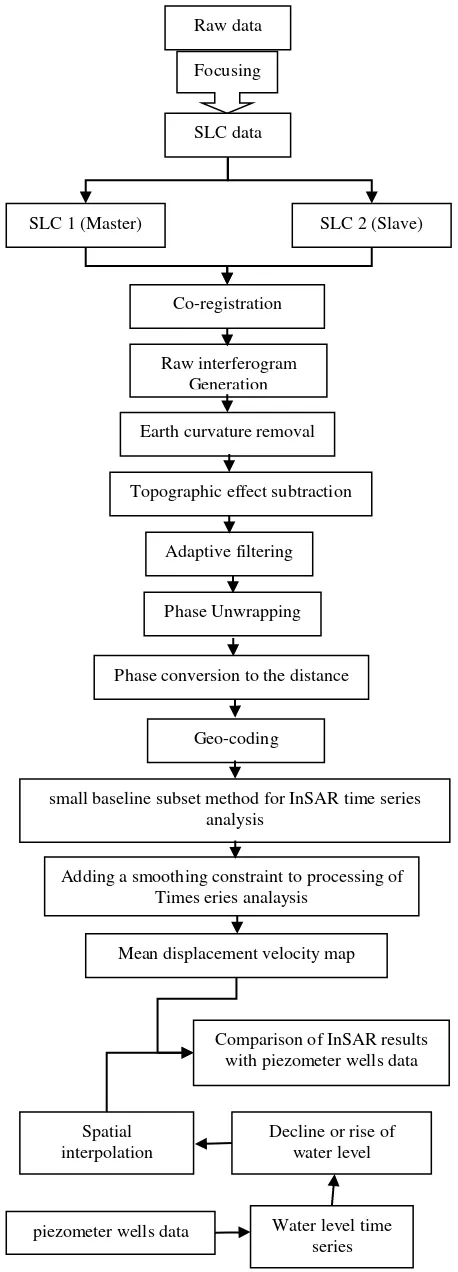
from InSAR. Basic structure of the methodology containing the main processing steps is depicted in Figure 1.
2.1. Interferograms generation
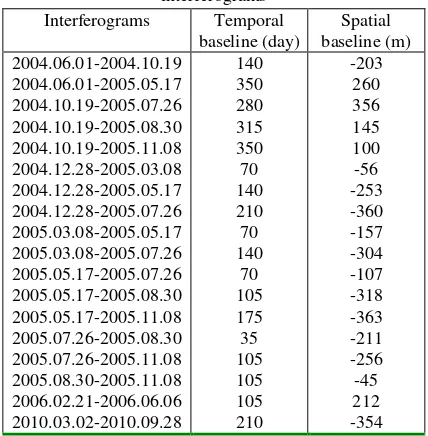
12 ENVISAT ASAR radar images of track 260 of ENVISAT acquired from Apr 1st 2004 to Sep 28th 2010 are used to generate 18 differential interferograms. The acquisition dates are demonstrated in table 1. In order to mitigate the sptial and temporal decorrelation effect, the interferograms are characterized by small spatial and temporal baselines. The interferograms information are presented in table 2.
The interferometric phase which is the phase difference between master and slave images is calculated as:
Interferogram
Topo Noise Atm Curv
Def
(1)
Where Interferogram
is the interferometric phase,
Def isthe phase component due to deformation,Atmis the atmospheric phase resulting from the different atmospheric
delay at the two acquisition times,Curv is the phase component due to Earth curvature, Topo is associated with
area topography and Noise is a noise term primarily due to decorrelation (Zhou, 2013). In order to estimate the deformation signal, all other components have to be estimated and subtracted from the interferometric phase.
On the other hand, the phase are modulated between and
, called wrapped phase. Phase unwrapping describes the subsequent step in which the integer phase cycles associated with each relative wrapped phase measurement are estimated.
Geocoding step is done for mapping each point from interferogram coordinate system to world global system (Zhou, 2013).
Table 1. Acquisition date of the images available Acquisition date
20040601 20041019 20041228 20050308 20050517
20050830 20051108 20060221 20060606 20100302 20050726 20100928
Figure 1. Basic structure of InSAR methodology. Raw data
Focusing
SLC data
SLC 1 (Master) SLC 2 (Slave)
Co-registration
Raw interferogram Generation
Earth curvature removal
Topographic effect subtraction
Adaptive filtering
Phase conversion to the distance Phase Unwrapping
Geo-coding
small baseline subset method for InSAR time series analysis
Adding a smoothing constraint to processing of Times eries analaysis
piezometer wells data Water level time series Mean displacement velocity map
Decline or rise of water level Spatial
interpolation
Table 2. Temporal and spatial baselines of the processed
Temporal decorrelation, i.e. changes in backscattering behaviour in time, is the most important limiting factor in InSAR technology. Interferograms with large temporal baselines are mainly subject to decorrelation [11]. Therefore, it is preferred to generate interferograms characterised by small temporal baselines. Time series analysis using a significant number of interferograms allows for studying the temporal behaviour of the subsidence over large period of time.
In order to generate the subsidence time series, the deformation at each acquisition date is estimated. Least squares solution will be applied for interferograms inversion. Suppose that:
' interferogram is considered to be the phase difference between master and slave images as follows:
1 1 2 squares approach are written as:
1
The first image is set to be a known parameter as the time
reference (10). By considering matrix andL is the interferometric observations in least-square problem (Dehghani et al., 2009).
To decrease residual orbital errors and atmospheric effects and also make the connection between separate subsets in the interfrogram network, a smoothing constraint is added to the least-square problem (Lundgren, 2001). Minimize root mean square (RMS) of the residual in least-square solution corresponding to smoothing factor as the objective function, determines Smoothing factor optimally. Time series analysis is finally carried out using the optimum smoothing factor (Dehghani, 2009).
2.3. Groundwater level monitoring at piezometric wells
Piezometric wells are being used to monitor the groundwater level’s fluctuations and generate the water level decline map which can be used for subsidence interpretation (Calderhead, 2011).
There are 53 piezometric wells in the study area which have been monthly monitored from Oct 2004 to Mar 2005. The results obtained from the InSAR time series are compared to the map demonstrating groundwater level decline.
3.RESULTS
As mentioned above, 18 differential interferograms were processing. Some of the interferograms, i.e. 2005/03/08-2005/05/17, 2005/07/17-2005/08/30 and 2006/02/21-2006/06/06 are illustrated in Figure 4. Before least squares inversion, the remaining orbital error of interferograms must be eliminated by subtracting a plate fitted to the points away from the subsidence area. Moreover, a point is considered as a spatial reference.
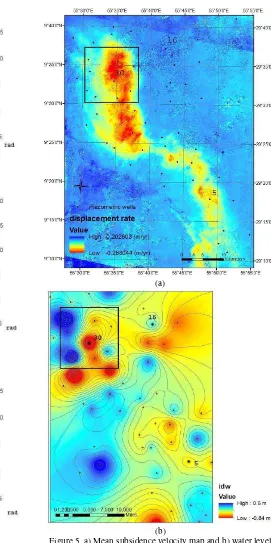
The mean displacement velocity map obtained from InSAR time series analysis are presented in Figure 5.a. The map highlights the major features of the subsidence. The maximum subsidence rate was estimated as 28 cm/yr.
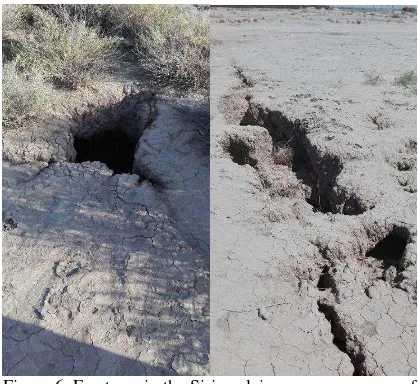
Various sinkholes and fractures were obvious in field observation in Sirjan plain. Figure 6 shows some of these evidences.
(a)
(b)
(c)
Figure 4. Processed interferograms with different temporal baselines a) 2005/03/08-2005/05/17, b) 2005/07/17-2005/08/30
and c) 2006/02/21-2006/06/06.
The correlation between the water level decline and aquifer compaction is clearly observed from Figure 5. For example, the area with the highest deformation rate corresponds to the area with the maximum groundwater level decline. This area is shown in a black square in Figure 5.
(a)
(b)
Figure 5. a) Mean subsidence velocity map and b) water level changes in the aquifer system. Piezometric wells 5, 30 and 16 in
Figure 6. Fractures in the Sirjan plain as consequences of subsidence.
Water level fluctuations at a selection of piezometric wells whose locations are shown in Figure 5 are presented in Figure 7.Accordingly, a water level decline is observed in Wells 5 and 30 located in the middle of the subsidence area. On the other hand, well 16 which is located outside the subsidence area shows increase in water level.
It should be noticed that other important factors are at work in subsidence occurrence. Aquifer compaction is highly affected from the soil type. If an aquifer is composed of fine-grained sediments, a little water level decline causes a significant subsidence. Aquifer compaction modelling considering other hydrogeological information is considered as future work.
Figure 7. Water level changes of aquifer at piezometric wells located in different parts of the subsidence area.
Figure 8. Sample graphs for calculating the skeletal storage coefficient at piezometric wells located in different parts of the
subsidence area.
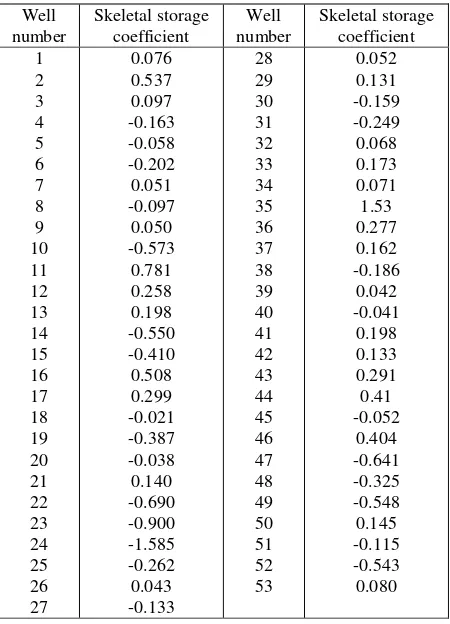
The values of skeletal storage coefficients for all piezometric wells located in difference part of the subsidence area are calculated and shown in Table 3.
Table 3. Values calculated for skeletal storage coefficient at wells location in over the subsidence area. Well groundwater for agricultural purposes. SBAS time series analysis was applied to generate the mean subsidence velocity map to highlight the major features of the deformation. Time
series analysis results were compared with groundwater levels’ information at piezometric wells. The comparison shows the high correlation between water level decline and aquifer compaction. For more accurate discussion, multi-sensor SAR data and modelling aquifer system considering geology and hydrogeology parameters are suggested.
5.References
Abidin, H. Z., Andreas, H., Gamal, M., Wirakusumah, A. D., Darmawan, D., Deguchi, T., & Maruyama, Y. (2008). Land subsidence characteristics of the Bandung Basin, Indonesia, as estimated from GPS and InSAR. Journal of Applied Geodesy, 2(3), 167-177.
Abidin, H., Gumilar, I., Andreas, H., Sidiq, P. T., & Fukuda, Y. (2011). Study on causes and impacts of land subsidence in Bandung Basin, Indonesia. FIG Working Week 2011 Bridging the Gap between Cultures Marrakech, Morocco, 18–22 May 2011.
Amighpey, M., & Arabi, S. (2016). Studying land subsidence in Yazd province, Iran, by integration of InSAR and levelling measurements. Remote Sensing Applications: Society and Environment, 4, 1-8.
Calderhead, A. I., Therrien, R., Rivera, A., Martel, R., & Garfias, J. (2011). Simulating pumping-induced regional land subsidence with the use of InSAR and field data in the Toluca Valley, Mexico. Advances in Water Resources, 34(1), 83-97. Dehghani, M., Zoej, M. J. V., Entezam, I., Mansourian, A., & Saatchi, S. (2009). InSAR monitoring of progressive land subsidence in Neyshabour, northeast Iran. Geophysical Journal International, 178(1), 47-56.
Gumilar, I., Abidin, H. Z., Hutasoit, L. M., Hakim, D. M., Sidiq, T. P., & Andreas, H. (2015). Land subsidence in Bandung Basin and its possible caused factors. Procedia Earth and Planetary Science, 12, 47-62.
Hoffmann, J., Galloway, D.L., Zebker, H.A. & Amelung, F. (2001). Seasonal subsidence and rebound in Las Vegas Valley, Nevada, observed by synthetic aperture radar interferometry, Water Resource. Res., 37(6), 1551-1566.
Khakim, M. Y. N., Tsuji, T., & Matsuoka, T. (2014). Lithology-controlled subsidence and seasonal aquifer response in the Bandung basin, Indonesia, observed by synthetic aperture radar interferometry. International Journal of Applied Earth Observation and Geoinformation, 32, 199-207.
Kumar, V., Venkataramana, G., & Høgda, K. A. (2011). Glacier surface velocity estimation using SAR interferometry technique applying ascending and descending passes in Himalayas. International Journal of Applied Earth Observation and Geoinformation, 13(4), 545-551.
Lundgren, P., Usai, S., Sansosti, E., Lanari, R., Tesauro, M., Fornaro, G., & Berardino, P. (2001). Modeling surface deformation observed with synthetic aperture radar interferometry at Campi Flegrei caldera. Journal of Geophysical Research: Solid Earth, 106(B9), 19355-19366.
Zhou, Z. (2013). The applications of InSAR time series analysis for monitoring long-term surface change in peatlands (Doctoral dissertation, University of Glasgow).
ACKNOWLEDGEMENTS