BRAND AWARENESS OF INDONESIA LOW COST GREEN CAR (LCGC) IN PADANG
Dian Rani Yolanda, SE, M.Bus Andalas University
dr_yolanda@yahoo.com, diana.yolanda@uq.edu.au
ABSTRACT
The title of this research is brand awareness analysis of Indonesia Low Cost Green Car in Padang. This research is aimed to know the brand awareness of each Low Cost Green Car in Padang. This Survey has been done to the respondents who stay in Padang city about their awareness of Low Cost Green Car in Indonesia, whereas the scope is limited to the fourth level of brand awareness: top of mind, brand recall, brand recognition and brand unaware . An accidental sampling procedure is used to select 100 respondents in Padang. The data were gathered through questionnaires which consist of single and multiple questions. Nominal and ordinal scale were used in this research. Measurement of brand awareness is based on the definitions of brand awareness which includes the level of brand awareness: top of mind, brand recall, brand recognition and brand unaware. The data were analyzed by using a descriptive statistical method.The finding shows that the top of mind of Low Cost Green Car in Padang is Agya (Toyota), the second rank is Ayla (Daihatsu), and the third rank is Bryo Satya (Honda). The findings for the lower levels of brand awareness’s pyramid: brand recall, brand recognition, and brand unaware definitely reinforce the finding of top of mind.
Keywords: Brand Awareness, Top of Mind, Brand Recall, Brand Recognition, Brand unaware
I. INTRODUCTION
1.1 Background
The world of automotive in indonesia has develop well at these recent years. Although the monetary crisis hit Indonesia extraordinary in 1998, seemed the interest and purchasing power of the automotive world of archipelago is not significantly reduced. In fact, more foreign automakers are interesting to invest their capital in Indonesia (Antaranews, 2013). From year to year, Indonesia has been the target market for foreign automakers from all around the world. Various brands and types of new cars already existed in Indonesia automotive market.
It is believe that Indonesia`s automotive industry will have a good prospect in the next following years given the positive macroeconomic trends. According to the spokesperson for the Association of the Indonesian Automotive Industries (Gaikindo), the Indonesian automotive industry has benefitted from the nation`s economic growth, rupiah exchange rate stability, political stability, interest rates and market liquidity.
Indonesian government has issued a new fiscal incentive to encourage domestic manufacturers to make inexpensive and environmentally friendly cars. The incentive, that is a reduction in the luxury-goods sales tax (PPnBM), has been agreed to by the Industry Ministry and the Finance Ministry on May 31, 2012. The government was previously considering replacing the luxury-goods tax with an excise duty, which was considered easier to implement. The size of the tax cut might be based on the amount of locally sourced materials used to make the vehicles, the environmentally friendly technology used in the manufacturing process and the vehicles’ fuel consumption.The tax break will also be given to manufacturers willing to transfer their technology within five years of starting local production (Website Kemenperin, 2013).
percent luxury-goods sales tax on cars with engines under 1,500 cubic centimeters.The luxury tax is one of several imposed by the government on automobiles. The taxes have made it difficult for local businesses to offer a car below Rp 100 million (US$10,600), which is the maximum price for a low-cost car.
Driven by a new government incentive to eliminate the luxury-goods sales tax, several automakers have started to venture into the low-cost car market. Toyota Astra Motor (TAM), Astra Daihatsu Motor (ADM) and Honda Prospect Motor (HPM) are offering the Agya, Ayla and Brio Satya, respectively. Nissan Motor Indonesia also recently announced that it would deliver its multi-purpose vehicle (MPV) Datsun GO+ and hatchback Datsun GO next year to join the market. Automakers with products ready are very upbeat and believe that their new vehicles will sell (The jakarta Post, 2013).
On July 5, Minister of Industry issued Regulation No. 33/M-IND/PER/7/2013 of 2013, which provides the technical specifications low cost green cars must meet in order to qualify for the relevant luxury sales tax relief. The regulation applies to car companies and car component producing companies. To qualify as green, a car must have a cylinder capacity of between 980 cc and 1,200 cc for spark ignition (SI) engines; the capacity of compression ignition (CI or diesel) engines must not exceed 1,500 cc.Both gasoline and diesel types must have a fuel consumption rate of at least 20 kilometers per liter of petrol.
An LCGC must also affix approved Indonesian branding and logos and must satisfy additional technical specifications, which include turning radius, ground clearance and other specifications to be outlined in forthcoming technical guidelines.The sale price of LCGCs also must not exceed IDR 95 million. The engine must use RON92 gasoline (for SI engines) or CN51 diesel (for CI engines), which are both high-octane fuels (Chen, 2013).
The policy and support of Indonesian government in LCGC will encourage other car brand agency (Agen Pemegang Merek/APM) to invest in the same segment, which in turn will increase the competition among the companies (Hill, 2011). Competition phenomena will lead economic system to market mechanism that posits companies to expand the market share. One way to attain that position is a brand (Durianto, Sugiarto, Sitinjak, 2001; John 1992)
Aaker (1996) and Vadera (2011) mentioned that brand role as a means to distinguish the goods of one producer from those of another. A brand has to able to bridge the expectation of consumers when a company promises the benefits of a product to consumers. Thus, it will arise emotional relationship between company and consumers. Through brand, other companies may offer similar benefits of their product, but it does not guarantee rising the same emotional relationship (Keller, 1993). With brand image and reputation enhancing differentiation and thus potentially having a positive influence on buying behaviour (Gordon, Calantone and Benedetto, 1993; McEnally and de Chernatony, 1999).
Fundamentally, branding is all about endowing products and services with the power of brand equity. Brand equity consists of the marketing effects uniquely attributable to a brand (Hakala et,al 2012; Kapferer, 2008). That is, brand equity explains why different outcomes result from the marketing of a branded product or service than if it were not branded. The concept of brand equity proposed by Aaker (1991, 1996) and Keller (1993, 2008) consists of five dimensions: brand awareness, brand association, perceived quality, brand loyalty and other propriatery brand assets, can be created through delivery of benefits of marketing mix activities.
gives serious attention when making a purchase (Mc.Donald & Sharp, 2003; Howard & Shet 1969; Narayana & Markin 1975). A brand that has some level of brand awareness is more likely to be considered, and therefore chosen, than the brands which the consumer is unaware of (Woodside & Wilson, 1985; Nedungadi, 1990).
The current research aims to explore: How strong the brand awareness of each Low Cost Green Car (LCGC) in Padang. This Survey will be done to the respondents who stay in Padang City about their awareness of Low Cost Green Car (LCGC) in Indonesia, whereas the research will be limited to the fourth level of brand awareness: top of mind, brand recall, brand recognition and brand unaware.
II. LITERATURE REVIEW
2.1 Branding Concept
Branding plays an important role in the marketing of a product. It is integral part in the process of communicating the meaning of a specific product to consumer (Kotler, 2009). According to the American Marketing Association (AMA), Aaker (1996), Keller (2003), Arnold (1996), Interbrand (1992), a brand is a distinguishing name or symbol such as logo, trademark or package design intended to identify the goods or services of one or a group of sellers and to differentiate those goods or services from those of competitors. A product with no brand like a product with no personality and no association with the environment. To be successful, products need their own proposition that the consumers can relate to. Today, consumers are swamped with many choices of brands in the market and more brand conscious. Brands are everything these days and firms that have built what is termed as 'brand equity' are able to dominate the market and reap huge profits (Yasin, Mohamad and Noor , 1997).
Brand needs to provide customers with a consistent, compelling experience in order not to confuse them, as confusion leads to doubt. Every one associated with the brand must understand its key dimension in order to deliver this consistent experience and it helps if customers can be given a short slogan that encapsulates the essence of the brand (Mud, 2002)
Kotler & Keller (2009) mentioned that a brand can provide six levels of meaning. Firstly: atrribute, brand reminds to certain attributes. Secondly: benefit, attributes are interpreted into functional and emotional benefits. Third: value, the brand shows the values of the company. Fourth: culture, the brand represents a particular culture. Fifth: personality, brand shows certain personality. Sixth: user, brand indicates the type of consumer that use them.
2.2 The Role and Function of Brand
The brand becomes very important due to several factors (Walker, 1995; Aaker, 1991, Arnold, 1996; Kotler & Keller, 2009): the brand is able to make consistent and stable promises of emotion, able to penetrate any culture and market. It can be seen that a strong brand is acceptable throughout the world and culture. Furthermore, the brand is also able to create a communication interaction with consumers. The stronger the brand, the stronger the interaction with customers and the more associations linked to the brand. Moreover, the brand is very influential in shaping consumer behavior. Strong brands will be able to change consumer behavior. In addition, the brand also facilitates the process of making purchasing decisions by consumers. With the brand, consumers can easily distinguish the products that will be bought with other products with respect to quality, satisfaction, pride, or other attributes attached to the brand. The last but not least is the brand evolved into the source for the company's greatest asset.
2.3 Brand Equity
The equity of a brand is in the value that is added by the name and rewarded in the market with better profit margins or market shares (Baldinger, 1990). Those, it is important for brand owners to build the equity of their brands in order for firms to stay profitable. Therefore, in marketing, the term brand equity refers to the tremendous value of the brand name to the producer of the brand, the retailer selling the brand as well as to the customer using that brand. Brand equity appears when consumers willingly pay more for the same level of quality due to the attractiveness of the name attached to the product (Bello & Holbrook, 1995).
Keller (1993) defines brand equity from the perspective of the individual consumer. He consideres brand knowledge as an essential concept in his definition of customer-based brand equity is defined as "the differential effect that brand knowledge has on consumer response to marketing activity with respect to that brand" (Kotler & Keller, 2009).
According to Aaker (1991), Kotler & Keller (2009), brand equity is a multidimensional concept. It consists of five dimensions of the brand assets, they are:
1. Brand Awareness
To show the ability of buyer to recognize or re memorize that a brand is apart of certain product categories.
2. Brand Association
Describe the brand image of certain product in term of behaviour, life style, benefit, attributes, geographic, price, competitors, celebrities and etcetera.
3. Perceived Quality
Describe the perception of customer to the whole expected quality/advantages of a product or service. 4. Brand Loyalty
To show the loyalty rate of consumer to a certain product or service. 5. Other proprietary brand assets
Aaker (1991) divides five levels of customer's attitude to a brand, from the lowest to the highest:
1. Customer will move to other brands, especially for the reason of price. There is no loyalty to the brand 2. Customer is satisfy. No reason to move to others
3. Customer is satisfy and feel loss if changes to others 4. Customer appreciate the brand and regards it as a friend 5. Customer is tied to the brand
Brand equity related to the amount of customers of a brand in level 3, 4 and 5. Brand equity also related to the level of brand admission, brand quality, strong emotional and mental association, paten, merchandising brand and distribution channel (Aaker, 1991).
Kotler (2002) says, strong brand equity will contributes competitive advantage for company: 1. Lower marketing cost because of high awareness and loyalty of consumers
2. Strong bargaining position for negotiating with distributors and retailers because consumers expect them to sell the product
3. Company is able to set higher price than other competitors because the brand is admitted has a better quality
4. To help company to extent the brand because the brand has high credibility 5. The brand protects the company from price fighting
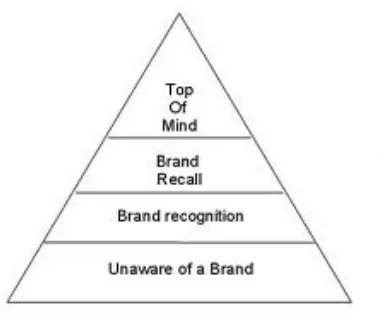
2.4 Brand Awareness
Figure 2.1
Pyramid of Brand Awareness
The role of brand awareness in brand equity depend on the attainness of consumer awareness. The lowest level of brand awareness is brand recognition or can be said as Aided Recall. The next level is brand recall, in another word said as unaided recallbecause consumers do not need aid to remember the brand. To measure unaided recall is harder than aided recall. The next level is the brand that is remembered by consumer without any aids, which is said as Top of Mind. Top of Mind is the highest level of brand awareness which shows the first brand that comes to consumer's mind (Durianto, Sugiarto and Sitinjak, 2001).
2.6 How Brand Awareness Contributes To Brand Equity
The role of brand awareness to brand equity can be understood by discussing how brand awareness creates a value.
According to Mitchell et al. (2001), the value can be created at least by these four ways: 1. Anchor to which other association can be attached.
Means a brand can be supposed as an anchor completed with some chains. Chains draw the association of that brand.
2. Familiarity–Liking
3. Means by knowing the brand will arise the familiarity, especially for the low involvement products, such as : tooth paste, tissue. A familiarity will expand to a liking which sometimes supports to make decision in buying a product or service.
4. Substance/Commitment
The awareness of a brand indicates the existing, commitment and substance for a company. Logically, a brand known for several reasons, probably because the extensive of advertising, wide distribution channel and the long existing in industry. If the quality of two brand are same, the brand awareness will influence consumers in making decision for buying.
5. Brand to Consider
The first step in buying process is selecting a brand to buy. A brand with a high top of Mind will have a high value. Usually consumers memorize a brand they like and dislike
2.7 How To Attain The Awareness
Keller (1993) describes, there are some ways to attain and make up the Brand Awareness:
1. The message delivered is easy to remember and different than other competitors. There should be a relation between the brand and product.
2. Using attractive slogan or jingle
3. If the product has a symbol, the symbol can be related to the brand., such as KFC with Colonel Sander 4. Develop brand extension, so consumers will always remember the brand.
III. RESEARCH METHOD 3.1 Sample
The samples are part of the population to be observed. The sample is part of the number and characteristics possessed by the population. Samples were used to estimate population characteristics, so that researchers can generalize the properties or characteristics to the population elements (Sekaran, 2006).
Respondents in this research will be selected based on non-probability sampling method, the sampling technique does not provide equal opportunity or chance for any element or selected members of the population to be sampled, with incidental sampling technique, which is based on accidental sampling technique that anyone who accidental meet with investigators can be used as a sample, if they they think that person is suitable as a source of data (Sekaran, 2006). Total samples of this research are 100 respondents.
3.2 Data Collecting Method
This research uses primary data. Primary data is original data or raw data obtained directly from the author of the source data during a survey of research’ object (Churchill, Brown, Suter, 2010).
Data collected by field research to people who live in Padang city by using a questionnaire containing a set of written questions to be answered by respondents. Data from the questionnaire is the answers given by the respondents.
3.3 Research Variables and Measurement
Ordinal scale is used in this research. Sekaran (2000) defines, ordinal scale is the scale use to denote differences among various categories, it also rank-orders the categories in some meaningful way. Measurement of brand awareness is based on the definitions of brand awareness which includes the level of brand awareness: top of mind, brand recall, brand recognition and brand unaware (Aaker, 1991).The information is obtained by using questionnaire, which consists of single question and multiple questions.
1.
Top of mindTop of mind shows a brand that comes first to respondent's mind when she/he is asked about a product category. Top of mind using single response question, means that a respondent only allowed to give one answer for question given.
Example:
“What is Low Cost Green Car (LCGC) brand comes first to your mind?”
2.
Brand RecallBrand recall shows the next brands remembered by respondent after the first one. Brand recall is multiple response questions, which produces unaided question. Example:
“Mention other Low Cost Green Car (LCGC) brand except the brand you have answered for question no.1”
3.
Brand RecognitionBrand recognition or recognition of Brand Awareness is measurement of consumer awareness where the awareness is measured by giving an aid. The question given is aided by mention the product characteristics of a brand(aided question). The question is aimed to know numbers of consumers who need to be reminded about the existing of a product by showing the brochure/picture, which describes the characteristic of that product
(a) Asking question Example:
"Do you know Daihatsu Ayla, Toyota Agya, Suzuki Wagon R, Datsun Go Low Cost Green Car (LCGC)?"
Each of these brand will be asked separately. Alternative of answers:
3. I don't know
If the respondents circle no. 1 as their answer, it can be classified as Top of Mind and Brand Recall. The answer No.2 can indicates the Brand Recognition. The question can be continued by asking how the respondents know the brand.
(b) Showing a brochure/picture, which draws attributes/product characteristics without showing its brand.
Question can be asked as follow: "Do you know the brand of this product"
4.
Brand UnawareTo measure Brand Unaware can be done by observe the answer of respondents in the previous question. If the respondents circle no.a.3, or do not know although a photo/picture is shown. 3.4 Data Analysis
The data collected are analyzed by usingdescriptive statistic method. Sekaran (2006) explaines descriptive statistics involve transformation of raw data into a form that would provide information to describe a set of factors in a situation. This is done through ordering and manipulation of the raw data collected. Descriptive statistics are provided by frequencies, measures of central tendency and dispersion. The data is categorized into tabulation to measure the level position of each brand of Low Cost Green Car (LCGC) in brand awareness: top of mind, brand recall, brand recognition and brand unaware..
IV. RESULTS AND DISCUSSION 4.1 Profile of Respondents
Private Employee
Based on sex, total number of male are 50 persons (50%), and female are 50 persons (50%), thus total number between male and female respondents are balance. The researcher deliberately afford similar number for male and female respondents in order to get the better result of data. Besides, LCGCis targeting for both male and female. Based on the latest research of CNW Market Researh in US, women are behind the decision (39%) to spend money on a new car purchase during December 2013 (Solo Post, 2014).
Compare from age distribution, most of respondent are in range of age 17-25 (34%), 26-35 (30%), followed by 36-45 (19%) and 46-55 (15%), only 2% of respondent age more than 55 years old. Therefore, most of respondents of this research are in productivity stage. As mentioned by Schiffman and Kanuk (2008), needs and interest in the product varies according to the age of the consumer. Consumers have a different assessment of a product or service depends on the age of the consumer itself. This is in accordance with the target market of LCGC, the motorists and young executives who are productive (Solo Pos, 2014).
Seen from education, most of respondent already accomplished Bachelor Degree/S1 (36%), Master/S2 (28%), Diploma/D3 (25% ), and only 11% of respondent graduatedfrom Senior High School/SMA. Thus it can be concluded that the respondents of this research are well educated.According to Kotler and Armstrong (2007), one's social class can affect a person's preferences over the car, one of the social classes is the level of education.
Based on occupation, 38% of respondent work as a public employee (PNS), 28% role as a student (University student), and 16% as a private employee. This is appropriate with the target market of LCGC, employees that are well established and ride motorcycles who want to have a car (Solo Pos, 2014).
Kottler and Armstrong (2007) said that a person's social class can affect a person's preferences over the car, one of the person's social class is income.From the table of income, it can be deduced that 45% of respondent are in range of income between 2-6 Million Rupiah (2-4 Million 23% and 4-6 Million 22%). Thus, it can be assumed that most of respondent are in middle range of income. This is just fit the target market of LCGC, that is the consumers in middle-class economy. It is seen that the price offered ranging from 70 million to 120 million dollars (Website Mobil Otomotif, 2014).
4.2. Level of Awareness 4.2.1 Top of Mind
LCGC Brand Frequency Percentage (%)
From 100 respondent, 34% answered Agya as the first LCGC brand they remember, 29% Ayla, and 17% Bryo Satya. Based on that result, Top of Mind of LCGC in Padang is Agya, the second rank is Ayla, whereas Bryo Satya is in the third rank.
Agya and Ayla can be in the first and second rank at Top of Mind of LCGC in Padang, probably because the automakers of these brands have the highest market share in Indonesia. As written by Kurniawan (2014) in website Star Brain Indonesia, Toyota Astra Motor (TAM), the automakers of Agya, leads 35% of market share in 2013, from total sales 1,2 million units of car. Whereas Daihatsu, the automakers of Ayla is in the second rank, with total market share 15,1%. The difference of market share between these two automakers are quite big (20,2%).
Domination of Toyota is hard to be competed by competitiors, because it has a strong market penetration, especially for its Multipurpose Vehicle (MPV), through Avanza and Kijang Innova. Toyota wins more when Astra Toyota Agya is successful in the market. This LCGC able to posit the second rank in the list of best-selling cars in Indonesia. From January to February 2014, Toyota has already reached 37% of total market share, and predicted to grasp more until the end of this year.
Keller (1993) mentioned that the awareness of a brand indicates the existing, commitment and substance for a company. Logically, a brand is known for several reasons, probably because the extensive of advertising, wide distribution channel and the long existing in industry. If the quality of two brands are the same, the brand awareness will influence consumers in making decision for buying.
4.2.2 Brand Recall
The finding shows that the top rank of brand recall is Bryo (38%), the second rank is Ayla (33%), and the third rank is Agya (30%). This result is consistent with the rank of brand awareness, since for brand recall, the ideal rank is the lowest one. The lowest rank for brand recall means, that the brand has already answered as the first brand remembered by respondents for brand awareness’s question (as top of mind).
Brand recall is consumers ability to retrieve the brand fom memory when given the product category, or a purchase or usage situation as a cue. Keller (2008) explained that, if consumer decision are mostly made in settings away from the point of purchase, then brand recall will be more important. Consumers must actively seek the brand and therefore be able to retrieve it from memory when appropriate.
4.2.3 Brand Recognition
From total respondents, there are 29 (29%) respondents that need to be reminded about the existence of Agya and so do Ayla, and 38 (38%) about Bryo Satya. This is strenghten the findings that, consumer memory about the existence of Agya and Ayla are better than Bryo Satya, since there are fewer respondents need to be reminded compared to Bryo Satya.
Even though brand recall may be less important at the point of purchase, consumers’ brand evaluations and choices will still depend on what else they recall about the brand given that they are able to recognize it there. As is the case with most information in memory, we are generally more adept at recognizing a brand than recalling it (Keller, 2008).
4.2.4 Brand Unaware
It can be seen from the table above that from 100 respondent, total resondents that are unaware about the exixtence of Agya, Ayla and Bryo Satya are 8, 9 and 10 respondents respectively. Thus, it can be concluded that, Bryo Satya has the highest number of unaware respondents, although it was not significantly different to Agya and Ayla.
4.3 Promotional Mix
Promotional Mix Agya Ayla Bryo
Advertising 58 69 53
Personal Selling 28 31 28
Public Relations 33 28 21
Direct Marketing & Interactive Marketing
10 10 8
Others 10 5 12
Most of respondents knew Agya, Ayla and Bryo Satya from the advertising. Public relations and personal selling activities also play important role for introducing those three brands. McDonald & Sharp (2003); Mud (2002); Hoyer & Brown (1990) said that the advertiser is primarilily creating brand awareness by interacting with its target customers. This includes rich media advertising and attractive messages. Increasing advertising exposure can also be ruled out as a factor to enhance brand awareness. Similarly, Kotler (2007), Durianto et al. (2001) also mentioned that compare to other promotional mix, advertising is more effective to increase brand awareness by introducing the products/services, build understanding about characteristics and benefits of products/services, efficient reminder for consumers about a product/service compare to sales promotion and personal selling, and as the first step for sales people before visiting their target consumers and reensure consumers to buy. Advertising also used to buld image of a product for long term which is able to reach consumers scattered geographically with lower cost.
Creating the brand awareness means increasing the familiarity of the brand through repeated exposure, although this is generally more effective for brand recognition than for brand recall. That is the more consumer ‘experiences’ the brand by seeing it, hearing it, or thinking about it, the more likely he or she is to strongly register the brand in memory.
Thus, anything that causes consumers to experience a brand name, symbol, logo, character, marketing, publicity and public relations, outdoor advertising can increase familiarity and awareness of that brand element. And the more elemements marketers can reinforce, usually the better (Keller, 2008).
4. Implications
There are several things that should be taken by the company to attain the awareness. Based on the result, Alya (Daihatsu) and Bryo Satya (Honda) posit only the second and the third rank of awareness, thus these companies need more efforts to increase their awareness. Those efforts can be done by increasing the frequency of promotion using proper promotional mix, especially through advertising by using attractive slogan/jingle, choosing a clear, simple, easy to be remembered and unique advertising’s messages and then regularly evaluate the effectiveness of each promotional mix after the excecution (Kotler, 2009; Majalah Kapital, 2002).
References
Aaker, D. A., 1991, Managing Brand Equity: Capitalizing On the Value of a Brand Name, Free Press, New York, NY.
Aaker, D. A., 1996, Building Strong Brands, Free Press, New York, NY.
Baldinger, Allan. L., 1990, Defining and Applying The Brand Equity Concept: Why The Researcher Should Care. Journal of Advertising Research, June/July, pp RC-2-RC5.
Bello, David C. & Morris B. Holbrook, 1995, Does An Absence of Brand Equity Generalize Across Product Classes?. Journal of Business Research, 34, 125-131.
Churchill, Brown, Suter, 2010, Basic Marketing Research, 7th Edition, South-Western Cengage Learning.
Chen, Y., 2013, Indonesia’s Low Cost Green Car Program Finally on the Road,
http://www.amcham.or.id (accessed 15th February, 2014).
Durianto, Sugiarto, Sitinjak, 2001, Menaklukkan Strategi Pasar Melalui Riset Ekuitas dan Perilaku Merek, PT Gramedia Pustaka Utama, Jakarta
Gordon, G.L., Calantone, R.J., and di Benedetto, C.A., 1993, Brand Equity in the Business-to-Business Sector: An Exploratory Study. Journal of Product and Brand Management. 2(3), 4-16.
Hakala, U., Svensson, J., and Vincze, Z., 2012, Consumer-based brand equity and top-of-mind brand awareness: a cross-country analysis. Journal of Product and Brand Management, Vol. 21 No. 6, pp. 439-451.
Hill, C. W. L., 2011, International Business, Competing in the Global Market Place, 8th edition, McGrawHill.
Howard J. A. & Shet, J.N., 1969, The Theory of Buyer Behaviour. New York: Wiley.
Hoyer W.D. & Brown, S.P., 1990, Effects of brand awareness on choice for a com mon, repeat-purchase product. Journal of Consumer Research, 17, 141-148.
Interbrand Group, 1992, World’s Greates Brands: An International Review, John Wiley, New York. Jacoby J; Szybillo G. &Busato-Schach J., 1977, Information acquisition behavior in brand
choice situations. Journal of Consumer Research, 3, 209-216. John, A. Czepiel, 1992, Competitive Marketing Strategy, Prentice Hall Inc.
Kapferer, J.N., 2008, The New Strategic Brand Management. Great Britain: Kogan Page Limited. Keller, K.L, 1993, Conceptualizing, measuring, and managing customer-based brand
equity. Journal of Marketing, Vol. 57(January), pp. 1-22.
Keller, K.L, 2008, Strategic Brand Management, Prentice Hall, Upper Saddle River, NJ.
Kementrian Perindustrian, 2013, Insentif Green Car Tuntas, http://www.kemeperin.go.id (accessed 1st Maret, 2014).
Kotler & Keller, 2009, Marketing Management, Prentice Hall, Upper Saddle River, NJ. Kotler Philip, 2002, Marketing Management, Prentice Hall, Upper Saddle River, NJ.
McDonal & Sharp, 2003, Management Perceptions of The Importance of Brand Awareness as an Indicator of advertising efectiveness. Marketing Bulletin.
McEnally, M.R., and de Chernatony, L., 1999. The Evolving Nature of Branding: Consumer and Managerial Considerations. Academy of Marketing Science Review. 1999, 1.
Mobil Otomotif. 2014. Bingung Pilih Mobil Murah (LCGC), Ini Panduannya.
http://www.mobil.otomotif.net otomotif (accessed 29th April 2014).
Narayana L. L. & Markin R.T., 1975, Consumer behaviour and product performance: an alternative conceptualisation. Journal of Marketing, 39, 1-6.
Nedungadi, P., 1990. Recall and consumer consideration sets: influencing choice without altering brand evaluations. Journal of Consumer Research, 17, 263-276.
Roselius T., 1971, Consumer rankings of risk reduction methods. Journal of Marketing, 35, 56-61.
Rossiter JR&Percy L (1987). Advertising and Promotion Management. Singapore: McGraw-Hill.
RossiterJR; Percy L &Donovan RJ (1991). A better advertising planning grid. Journal of Advertising Research, 11-21.
Schiffman, L. G., Kanuk L. L., 2007, Customer Behaviour 9 edition, New Jersey: Pretice Hall
Sulistiawati, 2013. Mobil Murah, Ingin Mobil LCGC, Ini Dia Pilihannya. http://www.solopos.com
(accessed, 29th April 2014).
The Jakarta Post, 2013, Cheap Cars to Form a New Segment. http://www.thejakartapost.com
(accessed 20th February, 2014).
Vadera, Shaili. 2011. Brand Building SMEs. http://smeworld.org (accessed in February 18th, 2014)
Woodside AG&Wilson EJ (1985).Effects of consumer awareness of advertising on preference. Journal of Advertising Research, 25, 41-48.