In
SEE PAGE 113 FOR IMPORTANT DISCLOSURES AND ANALYST CERTIFICATIONS
St ock Ticker Rat ing Mkt Cap
Arriving at the landing of the stairs
Init iat e at Underweight . Forecast aggregat e pre-sales in 2014 t o plat eau due t o t ight er mort gage regulat ions and macroeconomic uncert aint y. Will t urn more posit ive when pre-sales dat a st art t o pick up, which we expect in 2H14.
Remain positive on t he sect or’s struct ural long-t erm growt h, support ed by Indonesia’s large young populat ion and low mortgage-t o-loan rat io.
In t his challenging time, we prefer developers wit h strong balance sheet s and conservat ive proj ect s in low-middle segment as demand for premium properties weaken. Top BUYs: BSDE, CTRA and LPCK. Top SELL: ASRI.Short -t erm hiccup before resuming growt h
We expect more negat ive news in 1H14 f rom weak pr e-sal es t ake-up rat es and macroeconomi c uncert aint y bef or e t he president ial elect ion. We also expect t he gover nment t o impl ement t ight er regulat ions should propert y prices cont inue t o rise sharply.
St ay wit h t he conservat ive developers
During periods when ear nings visibilit y is not high, we pref er companies wit h st rong bal ance sheet s t hat have t he capabilit y t o f und t heir proj ect s. We also pr ef er compani es wit h high revenue cont ribut ion f rom invest ment propert ies f or earni ngs st abilit y.
Top picks: BSDE, CTRA and LPCK
Bumi Serpong Damai (TP IDR2, 000), Ciput ra Development (TP1, 330) and Lippo Cikarang (TP IDR8, 000) are our t op picks in t he propert y sect or f or t heir st rong balance sheet s and conservat ive proj ect s.
We calculat e RNAV by using DCF valuat ion of companies’ f ive-year operat ing cash f lows and we assigned residual value f or t heir land bank. We also use one-year f orward P/ E and P/ B mul t iples as sanit y
wil iant o. ie@maybank-ke. co. id
February 19, 2014 2
Indonesia Propert y
Arriving at t he landing of t he st airs
Af t er t he ext raordinary gr owt h of t he Indonesian propert y market over t he past f ive years, we expect bot h prices and vol umes t o plat eau t his year as t he cent ral bank t ight ens and economic growt h slows down.
We init iat e coverage of t he Indonesian propert y sect or at Underweight , alt hough we expect perf or mances t o diverge bet ween companies t hat have higher low -rise or high-rise propert y mix and also bet ween companies t hat have st rong balance sheet s and leveraged balance sheet s.
Expect more bad news in 1H14
We expect mor e negat ive news t o exert pressur e on t he sect or f rom weak pre-sales in 1H14. Tight mort gage lending f rom maj or banks due t o high loan-t o-debt rat ios will r educe demand f rom homebuyers who requir e f undi ng. We ant ici pat e pr e-sal es wil l pick up in 2H14 when we expect macroeconomic condit ions t o improve.
Short -t erm hiccup before resuming growt h
We t hink t he sect or ’ s short -t er m f undament als f ace chall enges on bot h t he supply and demand side. We not e t he supply of prime land is diminishing due t o st rong propert y sales since 2009. Developer s are now f or ced t o replenish t heir land banks at signif icant ly higher cost s. This separat es companies t hat st ill have ampl e prime land bank t o creat e more val ue. On t he ot her hand, we also not e demand f or high-end propert i es has sof t ened as af f ordabilit y diminishes wit h inf lat ion out pacing real income growt h.
We r emain posit ive on t he sect or’ s st r uct ural long-t er m growt h on t he back of Indonesia’ s large young populat ion and low mort gage t o t ot al loan rat io. We also expect a sust ainable increase of income and moderni zed lif est yle wher eby t he number of peopl e per household declines, t heref ore driving demand f or mor e housing.
St ick t o t hose wit h strong balance sheet s
In t imes when earni ngs visibilit y is not high, we pr ef er companies wit h st rong balance sheet s and conservat ive proj ect s. We also like companies wit h high r evenue cont ribut ion f rom invest ment propert ies. We t hink when demand is uncert ain, exposure t o high-risk proj ect s such as high-rise condominiums may hurt developers’ f inancial st abi lit y.
3 Numbers t hat Mat t er
Slow pre-sales in 2013 (11%)
Caut ious pre-sales t arget
Weakening IDR against USD (-25%)On aggregat e, pre-sal es of propert y companies i n our universe grew 11% YoY boost ed by bul k sales of Bumi Serpong Damai. St ripping t he bulk sales, organic pre-sal es only gr ew 5% YoY.
On aggregat e, propert y companies in our universe gui ded f or pr e-sal es t arget growt h of 12% YoY in 2014F wit h f ew companies st i ll guided f or f lat growt h in 2014F. We t arget f or 5% growt h YoY in 2014F, on aggregat e.
February 19, 2014 3
Has all t he negat ive news been priced in?
We expect mor e negat i ve news i n 1H14 f r om weak pr e-sal es number s and macr oeconomi c uncer t ai nt y (pr e-el ect i on) t o exer t f ur t her pr essur e on t he sect or . Al t hough t he 40% st eep f al l f r om i t s peak i n May 2013 has cr eat ed val ue i n some compani es, we wi l l t ur n mor e posi t i ve when pr e-sal es r ecover , whi ch we expect i n 2H14.
Indonesia propert y index down by 40% from it s peak in 2013
The Indonesian propert y sect or has dropped 40% f rom it s peak i n May 2013 f ut ur e. On average, Indonesian propert y compani es under our coverage ar e t rading at 51% discount t o 2014 RNAV.
Figure 1: Indonesia propert y index (JAKPROP)
Sour ce: Bl oomber g
Expect weak pre-sales in 1H14
February 19, 2014 4
Indonesia Propert y
Wit h weak pre-sales expect ed in 1H14 and conservat i ve ASP incr eases, we assume f lat pr e-sal es growt h in 2014F on aggregat e, in line wit h guidance f rom companies. We sense many developers are becoming more caut ious (f irst t ime since 2009) in t erms of launching proj ect s and many of t hem have set f lat pr e-sal es t arget s f or t his year .
Alt hough we believe Indonesia’ s economy wil l resume growt h in 2015, we f orecast conservat ive pre-sales growt h f or 2015. We only incl uded proj ect s t hat t he developers have announced in t heir pipelines in our assumpt ions. We have not assumed any new proj ect s or bulk sales t o increase sales volume. We f orecast Bumi Serpong Damai (BSDE IJ), Ciput ra Development (CTRA IJ), Sent ul Cit y (BKSL IJ) and Summar econ Agung (SMRA IJ) t o have double-digit pre-sales growt h in 2015.
We f orecast f lat pr e-sal es growt h indust rial est at e land segment as we expect invest ors t o wait and see f or t he upcoming parliament ary and president ial el ect ion t o compl et e in July14. This applies f or Bekasi Faj ar while Lippo Cikarang’ s sales growt h will be f rom non-i ndust rial segment .
Figure 3: Pre-sales overview
Sour ce: Company, Maybank KE Not e: G=Company Gui dance
Figure 4: Pre-sales forecast s
Sour ce: Company, Maybank KE Not e: F= Maybank KE For ecast
2 0 1 2 A 2 0 1 3 A Township Developer
Alam Sut era Realt y 3, 648 4, 810 32% 5, 600 86% Jul'13
Bumi Serpong Damai 4, 280 7, 348 72% 7, 000 105% Jan'13
Ci put ra Development 7, 298 8, 941 23% 9, 070 99% Oct '13
Li ppo Karawaci 6, 760 4, 104 -39% 4, 708 87% Sep'13
Sent ul Ci t y 1, 196 2, 085 74% 2, 000 104% Aug'13
Summarecon Agung 3, 873 3, 725 -4% 3, 700 101% Oct '13
Industr ial Estates
Bekasi Faj ar 1, 123 1, 090 -3% 1, 204 91% Oct '13
Li ppo Ci karang 2, 052 1, 698 -17% 2, 320 73% Sep'13
Aggr egate 3 0 , 2 3 0 3 3 , 8 0 1 1 2 % 3 5 , 6 0 2 9 5 % Last Tar get
Company Name % to
tar get Gr owth
(y-y) Mar keting Sales
2 0 1 3 G
2 0 1 2 A 2 0 1 3 A 2 0 1 4 F 2 0 1 5 F Township Developer
Alam Sut era Realt y 3, 648 4, 810 5, 112 5, 149 6% 1%
Bumi Serpong Damai 4, 280 7, 348 5, 568 6, 879 -24% 24%
Ci put ra Development 7, 298 8, 941 9, 840 11, 970 10% 22%
Li ppo Karawaci 6, 760 4, 104 5, 057 5, 447 23% 8%
Sent ul Ci t y 1, 196 2, 100 2, 043 2, 374 -3% 16%
Summarecon Agung 3, 873 3, 725 3, 891 4, 891 4% 26%
Industr ial Estates
Bekasi Faj ar 1, 123 1, 090 1, 266 1, 498 16% 18%
Li ppo Ci karang 2, 052 1, 698 2, 407 2, 791 42% 16%
Aggregat e 30, 230 33, 816 35, 184 41, 000 4% 17%
2 0 1 5 / 2 0 1 4 Mar keting Sales
Company Name 2 0 1 4 /
February 19, 2014 5
Fundament als of t he propert y market
Diminishing land bank, rising replacement cost s
From t he six t ownship developers t hat we cover , we est imat e propert y sales net area of c. 981 ha f or landed resident ial f rom 2009 t o 2013. Alt hough developers’ land banks i ncr eased f rom 2009 t o 2013, we believe t heir prime land banks are being deplet ed.
Figure 5: Land bank of t ownship developers (as of 9M2013)
Company Name Ticker Landbank (ha)
Al am Sut era Realt y ASRI IJ 2, 002
Bumi Serpong Damai BSDE IJ 4, 068
Ciput ra Devel opment CTRA IJ 1, 387
Lippo Karawaci LPKR IJ 1, 333
Sent ul Cit y BKSL IJ 13, 400
Summarecon Agung SMRA IJ 1, 502
Sour ce: Company, Maybank KE
This is apparent f or Alam Sut era wher e it s land bank in t he Serpong ar ea (14km f rom Jakart a) is running t hin wit h only 206 ha (t ot al development area is 800 ha) in 2013 and t he company is curr ent ly l ooking t o accumulat e land in t he Nort h Ser pong area. The developer pur chased addit ional land nort h of it s sit e in Serpong f rom Modernland Realt y at IDR2mn/ sqm. This is eight t imes higher t han Alam Sut era's hist oric land bank average book value of only IDR250k/ sqm back in 2008.
Wit h rising replacement cost s and short age of available land, we expect developers t hat have higher land bank cost s t o develop proj ect s i n t he middl e-high t ier segment wher e t hey can command higher prices t o cover t he rising replacement cost s. Alt ernat ively, t hey will bui ld high-rise buil dings t o increase t he ef f ect iveness of t heir land banks.
Diminishing affordabilit y
On t he demand side, rapidly rising propert y prices, especially in t he Great er Jakart a area, has reduced t he af f ordabili t y of middl e-income consumers as propert y prices have risen f ast er t han income growt h. For exampl e, propert y prices in t he Serpong area (subur ban ar ea in t he West of Jakart a) have seen a st rong 33% CAGR f rom 2009-2013, according t o Alam Sut era. For t he same period, minimum wages in Jakart a grew at onl y 16% CAGR.
Propert y prices in 14 Indonesian cit ies have cont inued t o rise st rongly t o close t he gap wit h t he nat i onal minimum wage growt h (f igure 6), accordi ng t o Bank Indonesia. We see t he af f ordabilit y of consumers will remain low when t he gap bet ween pr opert y price growt h and nat ional minimum wage growt h is narrow .
February 19, 2014 6
Indonesia Propert y
Figure 6: Propert y price index growt h vs. nat ional minimum wage growt h
Sour ce: Bank Indonesi a, St at i st i cs Indonesi a, Maybank KE Not e: Pr oper t y pr i ce i ndex of 14 maj or ci t i es i n Indonesi a
Figure 7: House price t o income rat io
Sour ce: Gl obal Pr oper t y Gui de 2012
The lack of inf rast ruct ur e, especially public t ransport , has also f orced many Indonesians t o commut e by privat e cars or mot orcycl es, f orci ng t hem t o allocat e an i ncr easing port ion of t heir budget f or t ransport at ion cost s. It ’ s wort h not ing t hat subsidized f uel prices and parking cost s increased by 44% and 100% YoY in 2013. This is one of t he many rising living expenses in
As t he purchasing power of Indonesia's middle-income populat ion decli nes, we believe t hey will be f orced t o relocat e t o suburban areas wit h smaller
2006 2007 2008 2009 2010 2011 2012 2013
Propert y price index growt h Nat ional minimum wage growt h
February 19, 2014 7
Figure 8: Inflat ion in Indonesia
Sour ce: Bank Indonesi a, Maybank KE
St ruct ural underlying demand remains strong
Indonesia’ s young and propert yive populat ion provi des st rong underl ying demand t o t he propert y sect or. Near ly 55% of t he Indonesian populat ion is
Figure 9: Indonesia’ s populat ion
As per census 2010
Sour ce: St at i st i cs Indonesi a, Maybank KE
Figure 10: Indonesia’ s GDP growt h
Sour ce: St at i st i cs Indonesi a, Maybank KE
Accordi ng t o St at ist ics Indonesia, t he number of people per household decreased t o an average of f our per househol d i n t he Jakart a area as of 2010. We beli eve t his is due t o a shif t in lif est yle of t he young Indonesian populat ion where peopl e want t o live in moder n cl ust ered houses and ar e no longer keen t o live wit h an enlarged f ami ly.
February 19, 2014 8
Indonesia Propert y
Influence from the banking sect or
Liquidity t ight ening
Monet ary measures impl ement ed by t he cent ral bank wer e aimed at slowing down l ending as t he loan-t o-deposit rat io (LDR) of t he banking syst em r eached 90% as of end-2013. The LDR limi t permissible by t he cent ral bank is 92% based on t he new r egulat ions on 1 Sep 2013 (down f rom 100%).
Moreover , as most banks reached t heir f ul l -year l oan growt h t arget i n 1H13, new mort gage disbursement s slowed down in 2H13. We not e several banks put a complet e halt t o new mort gage disbursement s by Sep 2013 and raised t heir mort gage rat es by 2%-3% in 2H13. Mor t gage loan growt h f or Jan-Nov 2013 was 18%.
Accordi ng t o our banks analyst , Rahmi Mari na, large mort gage lenders such as Bank Cent ral Asia (BCA), Bank Negara Indonesia (BNI) and Bank Tabungan Negara (BTN) ar e t arget ing slower mort gage loan growt h of 17% in 2014 (vs. 23% in 2013). Our economist at Maybank BII also t arget s a lower propert y cr edit growt h of 20% in 2014F; lower t han t he hist orical growt h of 24%-25% in 2011-2012.
Figure 11: Loan-t o-deposit rat io in Indonesian banking syst em
Sour ce: Bank Indonesi a, Maybank KE
Figure 12: Mort gages-t o-t ot al loans in Indonesia
Sour ce: Bank Indonesi a, Maybank KE The end of low interest rat es
The 175bps i ncr ease in t he ref erence rat e in six mont hs f rom 5. 75% t o 7. 5% in Nov 2013 has led t o a 2-3% mort gage int er est rat e hike. Accor ding t o Bumi Serpong Damai and Ciput ra Development , t his has led t o t he post ponement of propert y pur chases, especial ly of pr opert ies acqui red f or invest ment purposes.
However , we also t hink t he f undament als of individuals who invest in t he propert y sect or might also be af f ect ed by t he slowing domest ic economy, low export s and volat ilit y of t he Indonesian Rupiah t owards ot her maj or cur rencies.
Finally, we t hink f irst homebuyers who need mort gages will also be af f ect ed and wil l be f orced t o pur chase cheaper propert ies.
35 45 55 65 75 85 95
05 06 07 08 09 10 11 12 13
(%)
7. 0% 7. 5% 8. 0% 8. 5% 9. 0% 9. 5%
Jan10 Oct 10 Jul 11 Apr12 Jan13 Oct 13
February 19, 2014 9 Rupiah depreciat ion raises const ruct ion cost
The weakeni ng of t he Indonesian Rupiah against t he US Dollar has had a negat ive impact on t he propert y sect or , especial ly high-rise development s. Approximat ely 40% of t he cost (such as st eel , mechanical and el ect rical) f or buil ding high-rise propert ies are US-dollar relat ed. However , developing landed resident ial propert ies are less sensit ive t o cur rency volat ilit y because only around 10% of cost s are US-dollar relat ed.
Figure 13: Bank Indonesia reference int erest rat e
Sour ce: Bank Indonesi a, Maybank KE
Figure 14: IDR/ USD rat e
Sour ce: Bank Indonesi a, Maybank KE
Hedging t he forex
The volat ilit y of t he Rupiah has also l ed t o higher hedging cost s f or some developers. Alam Sut era’s hedgi ng premium increased f rom 1. 00% t o 2. 25% f or t he lat est hedge agr eement it ent ered int o in Sep 2013. Alt hough we expect t he company t o incur l ess f orex losses t hrough hedging, we expect t he hedging pr emium expenses t o incr ease.
Besides monet ary hedging, cont ract ors ar e increasingly less wi lling t o ent er int o const ruct ion cont ract s t hat lock in t he prices of raw mat erials. Di rect cont ract ing has been increasingly used bet ween cont ract ors and t he developers. Dir ect cont r act ing ref ers t o only r enderi ng const r uct ion services by t he cont ract or s and t hat al l t he raw mat erials wil l be sourced direct ly by t he developers. Wit h direct cont ract ing, we see a higher risk of development cost s escalat ing.
4 6 8 10 12 14
06 07 08 09 10 11 12 13 14
(%)
BI Rat e
8, 000 9, 000 10, 000 11, 000 12, 000 13, 000
05 06 07 08 09 10 11 12 13 14
February 19, 2014 10
Indonesia Propert y
Regulat ory environment
Wi t h t i ght er r egul at i ons on t he pr oper t y sect or i mposed by t he cent r al bank i n l at e 2013, we bel i eve aut hor i t i es ai m t o cur b t he r api d gr owt h of pr oper t y pr i ces i n Indonesi a.
Revision to t he LTV regulat ion
On 24 Sep 2013, Bank Indonesia (BI) revised t he loan-t o-val ue (LTV) regulat ions f or mort gages and aut omobil e loans. Under t he new regulat ions, f irst -t ime home buyers are r equired t o make 30% down payment whil e second home buyers 40% down payment f or homes wit h an area of more t han 70sqm. Pr eviously, al l home owners needed t o pay 30% down payment only.
This move is aimed at reduci ng speculat ion and t o encourage more f irst home buyers t o use mor t gages. On t he ot her hand, we also f ear invest ors will hold of f in invest ing i n propert ies, which can sl ow pre-sales, as t hey swit ch t o ot her invest ment asset classes such as bonds, which of f er higher yields wit h lower risks.
We t hi nk if t he government beli eves propert y prices are st il l not under cont rol , it may impose ot her t ight ening measures such as increasing t he t ax f or t he change of ownership in propert y or t he annual t ax rat e on land and buil dings.
Rest rict ion on full payment of mort gages t o propert y developers
Generally, banks do not give loans t o Indonesian pr opert y developers f or t he const r uct ion of landed resident ial proj ect s. Theref or e, developers source working capit al f rom t he f ul l payment of pre-sales f rom mort gages or f rom cust omers who pay in f ull up f ront . A mort gage will be f ully disbursed by t he bank at t he signi ng of t he loan agr eement . But in Oct ’ 13, BI issued new r egulat ions f or banks t o only disburse cust omers’ mort gages upon complet ing cert ain milest ones of a proper t y development .
Mort gage-disbursement schemes f or each developer will dif f er wit h each of t he banks. Ciput ra Development announced st art ing Jan’ 14 it will deposit t he f ull mort gage loan int o t he company's escrow account which wil l ear n deposit int erest rat e and be disbursed by t he f ol lowing schedul e:
Figure 15: Ciput ra Development t imeline of mort gage-loan disbursement
St ages Old New
Signing of mort gage cont ract 100% 0%
Complet ion of f oundat ion 50%
Topping of f 30%
Hand-over 10%
Change of t it le 10%
Sour ce: Company dat a, Maybank KE
We do not expect t he new regulat ions t o have much impact on t he cashf low of t he big devel opers, which general ly have suf f icient working capit al. Out of t he eight developers we cover , f our have a net cash posit ion. We t hink t he new regulat ions will have a more subst ant ial ef f ect on t he smal ler developers as t hey general ly r el y on f ull cash received on pre-sales f or t heir working capit al.
February 19, 2014 11
Limited upside, prefer low-mid segments
Limit ed upside for premium properties
Indonesian propert y devel opers have been enj oying margin expansion as propert y prices cont inue t o increase whil e cost s r emain under cont rol . However , we believe t his t rend wi ll sei ze and we est imat e margins wil l normali ze over t he next t wo years (due t o lag in recognit ion).
As discussed ear lier , l ower af f ordabilit y wi ll drive middle-income Indonesians t owards propert ies of a smal ler size or l ess value. This impli es t he market f or low-middl e segment propert ies inst ead will be great er t han f or premi um propert ies.
Moreover , as regulat ors cont inue t o curb t he rise in propert y prices and as development and replacement cost s rise wit h inf lat ion and a weakening rupiah, we f orecast devel opers wil l be f orced t o f ocus on t he low-middl e segment and i ncr ease sales volume t o maint ain pre-sales growt h.
Finally, wit h rising development cost s, it is not f easible f or developers t o lower sel ling pri ces t o boost sales in prime ar eas. We believe most developers will be unwil ling t o launch pr emium development s at lower prices as it will hurt t heir brand equit y. The upside f or high-segment development s is capped as we expect slow demand i n t his segment means developers are unabl e t o incr ease prices excessively.
Figure 16: Gross margins of Indonesian developers
Sour ce: Company dat a, Maybank KE
Figure 17: EBIT margins of Indonesian developers
Sour ce: Company dat a, Maybank KE
Prefer companies offering low-mid segment development s
We pr ef er developers t hat of f er more af f ordabl e propert ies as af f ordabilit y declines i n Indonesia wit h rising cost of f unds and a higher cost of living.
We not e several developers under our coverage have shif t ed t hei r market ing and development st rat egy more t owards t he low -middle segment of landed and high-rise resident ial proper t ies.
Summar econ Agung plans t o launch high-rise r esident ial development s i n t he Serpong and Bekasi ar eas in 2014 t hat t arget t he low-mi ddle segment . Alam Sut era also impl ement ed a similar st rat egy by ramping up it s proj ect in t he Pasar Kemis ar ea (low-middle segment ).
Ciput ra Development plans t o launch a one-t ower apart ment in West Jakart a in 2014 at an indicat ive pri ce of IDR19mn/ sqm, down f rom it s init ial IDR30mn/ sqm due t o concerns over t he l ow t ake-up rat e f or premi um development s.
0. 2 0. 3 0. 4 0. 5 0. 6 0. 7
2008 2009 2010 2011 2012 2013F 2014F 2015F
ASRI IJ BSDE IJ CTRA IJ LPKR IJ
BKSL IJ SMRA IJ BEST IJ LPCK IJ
-0. 3 -0. 2 -0. 1 0 0. 1 0. 2 0. 3 0. 4 0. 5 0. 6
2008 2009 2010 2011 2012 2013F 2014F 2015F
ASRI IJ BSDE IJ CTRA IJ LPKR IJ
February 19, 2014 12
Indonesia Propert y
We are mor e caut ious on proj ect s in t he mi ddle-upper segment as we t hink t his market is more sensit ive t o an economic slowdown, which r educes invest ment appet it e i n t he propert y sect or . Our view is support ed by t he sof t ening t ake-up rat es in several middl e-upper propert y proj ect s in 4Q13, which we expect t o cont inue t o 1H14.
Second t ier cities prices t o cat ch up
We f orecast in 2014, propert y prices in 2nd-t i er cit i es in Gr eat er Jakart a will grow at a f ast er rat e, cat ching up wit h t he 1st-t i er cit ies. We cat egorize Jakart a and Serpong as 1st-t ier cit ies, and Bekasi, Tangerang and Bogor as 2nd-t ier cit ies in t he Gr eat er Jakart a area.
While Jakart a r emains t he cent re of Indonesia's economy, we expect urbanizat ion t o cont inue, which wil l boost propert y demand in t he Great er Jakart a area.
We believe t her e is great er upside f or 2nd-t ier cit ies compared t o 1st-t i er cit ies as prices in 2nd-t ier cit ies have been lagging t he 1st -t ier cit ies. We expect land prices i n 2nd-t i er cit ies t o close t he huge gap wit h land pri ces in 1st-t ier cit ies (Jakart a and Ser pong).
Figure 18: ASP of t ownships in Great er Jakart a
Sour ce: Company dat a, Maybank KE
Sent ul Cit y, Bumi Serpong Damai, Summar econ Agung and Ciput ra Development ar e well posit ioned t o t ap t he growing demand f or propert ies in t he 2nd-t ier cit ies. We believe t he 2nd-t ier cit ies will provide support t o t he 2014 pre-sales of t hese developers.
0. 0 2. 0 4. 0 6. 0 8. 0 10. 0 12. 0 14. 0
2008 2009 2010 2011 2012 2013
(IDRmn/ sqm)
Al am Sut era BSD Cit y
Summarecon Serpong Cit ra Raya Tangerang
Grand Wisat a Summarecon Bekasi
Kot a Wisat a Sent ul Cit y
February 19, 2014 13
St ick t o developers wit h st rong balance sheet s
We pr ef er t he devel oper s wi t h st r ong bal ance sheet s, conser vat i ve pr oj ect s and sol i d r ecur r i ng i ncome pr oper t i es i n t i mes of uncer t ai nt y.
St rong balance sheet is king and conservat ive proj ect s import ant
We have more conf idence in t he developers t hat are in a net cash posit ion t o f inance t heir working capit al. We also not e developers ar e slowing down t heir capex by choosing conservat ive proj ect s f or t his year.
Figure 19: Cash level of Indonesian developers (as of 9M13)
Sour ce: Company dat a, Maybank KE
Bot h Lippo Karawaci and Alam Sut era have USD bonds in t heir books amount ing t o USD380m and USD526m. At t he t ime of writ ing, Alam Sut era had hedged t he princi pal of t he bond it issued in 2012 and 2013 up t o IDR12500/ USD and t hat t hey have not hedged t heir 2014 USD225m bond. We have concer ns regar ding Alam Sut era's bond due t o a currency mismat ch as t hey earn all t heir sal es in Indonesian Rupiah. As of 9M13, Alam Sut era suf f ered f orex losses of IDR121b or 9% of it s EBIT.
Lippo Karawaci has nat ural hedgi ng t hrough it s income f rom management f ees in SGD f rom t he Singapore-based REITS of around SGD11. 3m annual ly, which covers half of t he annual bond coupon payment s of about USD25m (assuming SGD1. 274/ USD). As of 9M13, Lippo Karawaci booked a f orex gain of IDR141b or 12% of it s EBIT.
We pref er developers wi t h conservat ive proj ect s such as low-middl e segment landed r esident ial propert ies rat her t han hi gh-rise proj ect s which carry more risk. A landed/ low-rise r esident ial proj ect can generally be post poned when t ake-up rat es are low.
However , it is more probl emat ic t o post pone high-r ise proj ect s due t o a low t ake-up rat e. This is because compani es normally appoint and sign a development cont ract wit h t he cont ract or prior t o propert y launching t o boost cust omers' conf idence in t he proj ect .
High-rise proj ect s in t he Jakart a area have been experiencing dif f icult y i n obt aining buil ding permit s f rom t he local government . This has hit high-rise proj ect s signif icant ly and delayed a number of proj ect launches in 2013.
We like Bumi Serpong Damai and Ciput ra Development f or t he high port ion of low-resident ial proj ect s sales. Li ppo Karawaci and Summarecon Agung have propert y mix which weighs more t owar ds high-ri se proj ect s.
Company Name Cash Tot al Debt Net c ash % of USD debt Net DER
Tow nship Developer
Alam Sut er a Realt y 840 4,838 -3,998
90%
75%
Bumi Ser pong Damai 3,817 3,129 688
0%
-5%
Ciput r a Development 3,828 2,165 1,663
0%
-18%
Lippo Kar awac i 3,276 7,435 -4,159
99%
30%
Sent ul Cit y 877 1,847 -970
31%
14%
Summar ec on Agung 2,618 1,848 770
1%
-18%
Indust rial Est at es
Bekasi Faj ar Indust r ial Est at e 420 559 -139
0%
6%
February 19, 2014 14
Indonesia Propert y
Invest ment propert ies add value
Most of t he developers under our coverage cont i nue t o ramp up t heir invest ment propert ies t o secure st able r ecurri ng income f rom ret ail space, of f ices, hot els, golf cour ses, t heme parks and even hospit als. These invest ment propert ies provide st abilit y in earni ngs and hel p t o maint ain high margins. Invest ment propert ies add val ue t o propert y compani es in light of a slowing propert y market in 2014.
Lippo Karawaci and Summarecon Agung have t he most r evenue cont ribut ion f rom invest ment propert ies in t erms of value. Bumi Ser pong Damai, Ciput ra Development and Sent ul Cit y also cont inue t o ramp up t heir recurring i ncome by adding i nvest ment propert ies such as hot els, hospit als, of f ice bui ldings and t heme parks. On average, Invest ment propert ies cont ribut ed 16% t o t ot al revenue 2013F of t he eight propert y companies we cover .
We t hi nk t he gover nment 's decision t o r emove t he elect ricit y subsidy on shopping mal ls, hot els and of f ices will have minimal impact on propert y companies. They have hist orically passed on any t ari f f adj ust ment s t o t he t enant s and we t hink it is less likely occupancy rat es will f all , especial ly in of f ices wher e t he t enant s are inelast ic.
Figure 20: Composit ion of recurring income of Indonesian developers (2013F)
Company Ticker Propert y
sales
Recurring income
Propert y Developer
Al am Sut era Realt y ASRI IJ 95% 5%
Bumi Serpong Damai BSDE IJ 87% 13%
Ciput ra Devel opment CTRA IJ 89% 11%
Lippo Karawaci LPKR IJ 56% 44%
Sent ul Cit y BKSL IJ 80% 20%
Summarecon Agung SMRA IJ 81% 19%
Indust rial Est at es
Bekasi Faj ar Indust rial Est at e BEST IJ 97% 3%
Lippo Cikarang LPCK IJ 93% 7%
February 19, 2014 15
Prefer indust rial est at es wit h ample land bank and st rategic locat ions
We have a conservat ive out look f or 2014 and pref er i ndust rial est at es wit h ample land bank and st rat egic locat ions as t hese will be t he f irst choice f or companies looking t o set up propert yion f acilit ies in Indonesia when t he economy r ecovers. For t he longer t erm, we believe FDI inf low t o Indonesia will be sust ainabl e as t he count ry is bl essed wit h rich nat ural r esources and a rising middl e class t hat f uels domest ic consumpt ion.
Figure 21: Foreign Direct Invest ment (FDI)
Sour ce: BKPM, Maybank KE
Figure 22: Invest ment t o GDP
Sour ce: St at i st i cs Indonesi a, Maybank KE
Hist orically, indust rial est at e land prices have seen st rong appreciat ion due t o t he limit ed supply of ready-t o-use land, driven by st rong demand since 2010 when annual land sal es reached 560ha, up 216% f rom 2009. We t hink indust rial land sal es wil l remain sof t in 2014 due t o t he upcomi ng parliament ary and president ial el ect ions as companies would like t o gain assurance on t he next government , which t hey hope will promot e economic growt h.
Figure 23: Annual sales of indust rial est at es
Sour ce: Col l i er s Int er nat i onal , Maybank KE
Figure 24: ASP of indust rial est at es
Sour ce: Bank Indonesi a, Maybank KE
February 19, 2014 16
Indonesia Propert y
The Jakart a-Cikampek t ol l road belt is t he indust rial hub in Indonesia wit h over 8, 300ha of developed land. It is dominat ed by t he aut omot ive sect or , according t o companies’ r eport s. It s proximit y t o t he int ernat ional seaport and airport has made it t he prime indust rial est at e area in Indonesia.
Curr ent ly t her e are seven maj or indust rial est at es along t he Jakart a-Cikampek t oll road. As we can see i n t he f igur e below, t he anchor t enant s of each i ndust rial est at e are mainly f rom t he aut omot ive sect or. We beli eve t he aut omot ive sect or wil l cont inue t o invest in t his area despit e t he big incr ease in mi nimum wage, as t he sect or is not labour-int ensive.
Figure 25: Industrial estates in the Jakarta – Cikampek toll road Company name Indust rial est at e Concession
area (ha)
Developed area (ha)
Land bank
(ha) Maj or t enant s
Puradelt a Lest ari
Greenl and Int ernat ional Indust rial Cent er (Greenl and Indust rial)
2, 989 1, 059 1, 930 Suzuki, Ast ra Ot opart s, Takat a
Lippo Cikarang Delt a Sil icon 3, 000 2, 169 596 Hankook Tire
Jababeka Kot a Jababeka 5, 600 1, 820 1, 168 Samsung El ect ronics, KAO, Unil ever
Mit ra Karawang Raya Kawasan Indust ri Mit ra
Karawang 500 500 - Honda Prospect Mot or
Bekasi Faj ar Indust rial Est at e MM 2100 1, 350 825 681 Ast ra Honda Mot or, LG Surya Semest a Int ernusa Surya Cipt a Indust rial Est at e 1, 400 893 272 Ast ra Int ernat ional , Nest le
Sinarmas Land &It ochu Group Karawang Int ernat ional
February 19, 2014 17
Risks t o our view
Int erest -rat e hikes
An incr ease in int er est r at es in Indonesia may negat ively impact t he demand f or propert y development s. High int erest rat es can l ead t o reduced consumer spendi ng, which can negat ively af f ect t he cust omers’ abilit y t o make payment s and coul d r educe demand f or t he proposed development s.
Also, high i nt er est rat es may make it more dif f icul t f or cust omers t o be qualif ied t o secure f inancing, which coul d negat ively af f ect demand f or resident ial development s. Our economist expect s t he i nt er est rat e t o remain unchanged at 7. 50% in 2014F and anot her 25bps hike t o 7. 75% in 2015F.
Liquidit y crunch
As of YE 2013, t he loan-t o-deposit (LDR) rat io in Indonesia’ s banking syst em is 90%. This is close t o t he limit of 92% set by t he cent ral bank. If t his sit uat ion persist s, we might see less mort gage loan disbursement , which wi ll decrease t he demand f or propert ies f rom cust omers t hat requi re f undi ng.
Economic downt urn
We believe Indonesia is current ly f acing a f ew macroeconomic chall enges. Prices of it s main commodit ies (coal, CPO, r ubber , met als) r emain weak whilst oil prices cont i nue t o st and at around USD100/ barrel . Indonesia's t rade balance r elies on commodit ies and cur rent ly cont ribut es 32% t o t he count r y's t ot al export .
We f ear t hat if demand f or Indonesia's commodit ies remains light , it could pose a risk t o t he count ry's GDP growt h. Moreover, alt hough government expendit ure is not slowi ng down in t his el ect ion year, we expect t his expendit ure alone will not be enough t o sust ain GDP growt h.
The 8. 38% inf lat ion i n 2013 is above BI’ s 3. 5-5. 5% i nf lat ion t arget on t he back of rising f ood and subsidized f uel prices. Indonesia’ s economy grew 5. 72% in 2013. Pr eviously, it grew by more t han 6. 0% since 2010. For t his year, our economist f orecast s an inf lat ion of 5. 12%.
Currency volatilit y
Curr ency volat ilit y will i ncrease t he risk of high-rise proj ect s, as 40% of t heir bui ldi ng cost s are relat ed t o t he USD/ IDR rat e. If t he currency st abilizes, we t hink propert y companies wil l priorit ize high-rise proj ect s because t hey general ly have higher margins t han low-rise proj ect s.
Land acquisit ion
February 19, 2014 18
Indonesia Propert y
Valuat ion and t op picks
Our val uat i on met hod f or t he pr oper t y sect or uses a combi nat i on of di scount t o RNAV and one-year f or war d P/ E val uat i on. We assi gned di scount t o RNAV accor di ng t o ear ni ngs vi si bi l i t y and bal ance sheet heal t h. Our t op pi cks f or t he t ownshi p devel oper s ar e Bumi Ser pong Damai (BSDE IJ) and Ci put r a Devel opment (CTRA IJ), and Li ppo Ci kar ang (LPCK IJ) f or i ndust r i al est at es.
We like Bumi Ser pong Damai (BSDE) f or it s st rong balance sheet , ample prime land bank and conservat ive proj ect s. It s balance sheet also support s st rat egic acquisit ions of land and invest ment proper t ies f or an addit ional source of growt h.
We also like Ciput ra Development f or it s diversif ied propert y mix and st rong balance sheet . It s Joint Operat ion business model al lows f or savings in capex, which can be all ocat ed t o i nvest ment propert ies t o secure st abl e earnings in t he f ut ure.
Lippo Cikarang (LPCK) is our t op pick f or i ndust rial est at es f or it s st rong balance sheet and versat ilit y in sel ling eit her i ndust rial or r esident ial propert ies. Al t hough it s land bank is not huge, we t hink t he company can t ap t he growing demand f or resident ial propert ies in t he Cikarang area. Lippo Cikarang has t he highest ROE i n our universe wi t h t he lowest P/ E.
Asset play vs. earnings play
We val ue t he propert y companies using a combi nat ion of earnings and asset s as we would like t o see ear nings support ed wit h suf f icient land bank (asset ) t o ensure it can be sust ained.
Discount t o RNAV
We est imat e t he 2014 RNAV by cal culat ing t he f ive-year net present val ue of t he sal e proceeds. We do t his by using a WACC assigned t o each company, based on t he land bank’ s excess market value in t he past f ive years. We val ue t he invest ment propert i es using t he net cash f lows l ess direct cost s using t he WACC as t he assumed cap rat e.
Figure 26: 2014 RNAV
Sour ce: Company, Bl oomber g, Maybank KE. Shar e pr i ces ar e as of 17 Febr uar y 2014.
P/ E and P/ B mult iples
We use a year f orward P/ E valuat ion t o value companies. We use one-year f orward earnings as most revenue and t heref or e earni ngs of propert y sales are recorded in 12-18 mont hs due t o a lag in recognit ion. We also use a one-year f orward P/ B valuat ion t o mai nt ain t he valuat ion consist ency wher e earnings visibilit y is not high.
Company Name Tic k e r Rating RNAV / shar e
Shar e pr ic e
Discount implied
Pr ope r ty De ve lope r
Alam Sut er a Realt y ASRI I J Sell 1, 352 590 56%
Bumi Ser pong Damai BSDE I J Buy 2, 857 1, 575 45%
Ciput r a Development CTRA I J Buy 2, 627 1, 025 61%
Lippo Kar awaci LPKR I J Hold 1, 436 955 34%
Sent ul Cit y BKSL I J Buy 1, 022 178 83%
Summar econ Agung SMRA I J Hold 2, 809 1, 025 64%
Industr ial Estate s
Bekasi Faj ar BEST I J Hold 1, 058 615 42%
February 19, 2014 19
Figure 27: Valuat ion mat rix
Sour ce: Company, Bl oomber g, Maybank KE. Shar e pr i ces ar e as of 17 Febr uar y 2014.
As seen i n t he f igur es bel ow, Lippo Cikarang has t he highest ROE at 32%, f ollowed by Ciput ra Development , Bumi Ser pong Damai , Summar econ Agung and Alam Sut era. However , we t hink t hat Summar econ Agung is already f airly priced at almost 3. 0x P/ B 2014F, l imit ing t he pot ent ial upside. We also t hi nk t hat Alam Sut era carries higher risk of cur rency volat ilit y which might hurt it s f inancial st abilit y.
Figure 28: P/ B and ROE (2014F) at current price
Sour ce: Company dat a, Bl oomber g, Maybank KE
Figure 29: P/ B and ROE (2014F) at our t arget price
Sour ce: Company dat a, Bl oomber g, Maybank KE
Mkt Cap RNAV/share Price TP U/D Side
Disc. to
RNAV PER PER P/B (x) ROE Div yield
(USD mn) (local) (local) (local) (%) (%) CY14F CY15F CY14F CY14F CY14F
Alam Sutera Realty ASRI IJ Sell 983 1,352 590 500 -15% 56% 8.2 7.2 1.7 23% 3.6%
Bumi Serpong Damai BSDE IJ Buy 2,337 2,857 1,575 2,000 27% 45% 10.8 9.6 2.3 23% 1.7%
Ciputra Development CTRA IJ Buy 1,338 2,627 1,025 1,330 30% 61% 11.2 10.4 2.1 20% 2.4%
Lippo Karawaci LPKR IJ Hold 1,869 1,436 955 900 -6% 34% 13.0 11.4 1.7 12% 1.5%
Sentul City BKSL IJ Buy 474 1,022 178 200 13% 83% 12.4 7.2 0.9 8% 0.0%
Summarecon Agung SMRA IJ Hold 1,254 2,809 1,025 1,050 2% 64% 12.1 11.0 2.8 25% 3.0%
Bekasi Fajar BEST IJ Hold 502 1,058 615 590 -4% 42% 8.5 7.4 2.0 25% 2.7%
Lippo Cikarang LPCK IJ Buy 411 12,865 6,975 8,000 15% 46% 6.5 6.0 1.8 32% 0.0%
Stock Ticker Rating
0. 5 1. 0 1. 5 2. 0 2. 5 3. 0
0% 5% 10% 15% 20% 25% 30% 35%
(ROE) (P/ B)
ASRI IJ BSDE IJ CTRA IJ LPKR IJ
BKSL IJ SMRA IJ BEST IJ LPCK IJ
0. 5 1. 0 1. 5 2. 0 2. 5 3. 0 3. 5
0% 5% 10% 15% 20% 25% 30% 35%(ROE)
February 19, 2014 20
Figure 30: ASRI hist orical forward P/ E
Sour ce: Company dat a, Maybank KE
Figure 32: ASRI hist orical forward P/ B
Sour ce: Company dat a, Maybank KE
2009 2010 2011 2012 2013 2014
0
2009 2010 2011 2012 2013 2014
Mean
2009 2010 2011 2012 2013 2014
0
2009 2010 2011 2012 2013 2014
Mean
February 19, 2014 21 det erminat ion t o add more invest ment propert ies will also provide earnings st abilit y i n t he f ut ure.
Figure 34: BSDE hist orical forward P/ E
Sour ce: Company dat a, Maybank KE
Figure 36: BSDE hist orical forward P/ B
Sour ce: Company dat a, Maybank KE
2009 2010 2011 2012 2013 2014 0
500 1, 000 1, 500 2, 000 2, 500
2009 2010 2011 2012 2013 2014
Mean
2009 2010 2011 2012 2013 2014 0
500 1, 000 1, 500 2, 000 2, 500
2009 2010 2011 2012 2013 2014
Mean
February 19, 2014 22
Indonesia Propert y
Ciput ra Development
Ciput ra Development is t he largest developer i n t erms of pre-sal es and geographical coverage. Toget her wit h it s t wo main subsidiaries, Ciput r a booked pre-sal es of IDR8. 7t in 2013. The company capit alizes on it s st rong brand equit y as t he leadi ng propert y developer in Indonesia. Through it s Joint Operat ion business model , t he company does not have t o acquire land bank t o expand it s pr opert y business.
Figure 38: CTRA hist orical forward P/ E
Sour ce: Company dat a, Maybank KE
Figure 40: CTRA hist orical forward P/ B
Sour ce: Company dat a, Maybank KE
2009 2010 2011 2012 2013 2014
0
2009 2010 2011 2012 2013 2014
Mean
2009 2010 2011 2012 2013 2014
0
2009 2010 2011 2012 2013 2014
Mean
February 19, 2014 23
Lippo Karawaci
Lippo Karawaci has t he most diversif ied business port f olio wit h holdings in t he propert y, hospit al and asset management segment s. Curr ent ly, it has t he largest recur ring income r evenue cont ribut ion. Our view is t hat t he recurri ng income business will be company’ s source of growt h in light of a slowdown in propert y demand, especially in t he high-rise proj ect s. We f orecast t he recur ring income t o cont ribut e 54% of it s t ot al revenue in 2014F.
We also not e t here is an increasing risk in execut ing superblock proj ect s i n Jakart a as it is becoming more dif f icult t o obt ain t he necessary license t o
Figure 42: LPKR hist orical forward P/ E
Sour ce: Company dat a, Maybank KE
Figure 44: LPKR hist orical forward P/ B
February 19, 2014 24 consumers are gaini ng conf idence in t he t ownship.
The company i nt ends t o acqui re t he r emaining 15% st ake of it s main
Figure 46: BKSL hist orical forward P/ E
Sour ce: Company dat a, Maybank KE
Figure 48: BKSL hist orical forward P/ B
Sour ce: Company dat a, Maybank KE
2009 2010 2011 2012 2013 2014
0
2009 2010 2011 2012 2013 2014
Mean
2009 2010 2011 2012 2013 2014
0
2009 2010 2011 2012 2013 2014
Mean
February 19, 2014 25
Summarecon Agung
Summar econ had delayed some proj ect s due t o t he land acquisit ion process, which made it f ail t o achieve it s FY13 pr e-sales t arget . We expect slower sales vol ume i n 2014F, which wil l lead t o a f l at pre-sales growt h in 2014F, in our view. We not e t he rising risk f rom it s high-rise proj ect s t his year may impede it s growt h.
We st ill like Summarecon f or it s st rong brand equit y as one of t he leading t ownship developers in Indonesia. It s st rong r ecurri ng income base also provides earni ngs st abilit y in t he f ace of t he cur rent headwinds. The
Figure 50: SMRA hist orical forward P/ E
Sour ce: Company dat a, Maybank KE
Figure 52: SMRA hist orical forward P/ B
Sour ce: Company dat a, Maybank KE
2009 2010 2011 2012 2013 2014
0
2009 2010 2011 2012 2013 2014
Mean
2009 2010 2011 2012 2013 2014
0
2009 2010 2011 2012 2013 2014
Mean
February 19, 2014 26
Indonesia Propert y
Bekasi Faj ar Indust rial Est at e
Bekasi Faj ar has t he most prime i ndust rial est at e land in t he Bekasi area. The est at e is close t o t he int ernat ional seaport and airport . It s ampl e 681ha of land bank in t he Bekasi area will become more valuable as neighboring indust rial est at es’ land banks st art t o deplet e.
Our view is t hat even if t he company does not book high sal es vol ume, t he prime land bank it self st ores great val ue and we believe t hat t he indust rializat ion in Indonesia will be sust ainable i n t he f ut ure wit h FDI inf lows.
Figure 54: BEST hist orical forward P/ E
Sour ce: Company dat a, Maybank KE
Figure 56: BEST hist orical forward P/ B
Sour ce: Company dat a, Maybank KE
Apr12 Jul12 Oct12 Jan13 Apr13 Jul13 Oct13 Jan14
0
Apr12 Jul 12 Oct 12 Jan13 Apr13 Jul 13 Oct 13 Jan14
Mean
Apr12 Jul 12 Oct 12 Jan13 Apr13 Jul 13 Oct 13 Jan14
0
Apr12 Jul12 Oct 12 Jan13 Apr13 Jul13 Oct 13 Jan14
Mean
February 19, 2014 27
Lippo Cikarang
Lippo Cikarang’ s indust rial est at e is locat ed in t he Bekasi area, t he prime indust rial est at e area in Indonesia. It is a mixed-use est at e where t he company sells indust rial , commercial and r esident ial propert ies, which makes it more r esilient in generat ing sales.
Lippo Cikarang has successf ull y developed it s resident ial propert y segment in t he est at e, which was dedicat ed f or t he i ndust rial segment . We beli eve
Figure 58: BEST hist orical forward P/ E
Sour ce: Company dat a, Maybank KE
Figure 60: BEST hist orical forward P/ B
Sour ce: Company dat a, Maybank KE
Jan12 Apr12 Jul12 Oct 12 Jan13 Apr13 Jul13 Oct 13 Jan14
0
Jan12 Apr12 Jul12 Oct 12 Jan13 Apr13 Jul13 Oct 13 Jan14 Mean
Jan2012 Apr2012 Jul 2012 Oct 2012 Jan2013 Apr2013 Jul 2013 Oct 2013 Jan2014 0 2, 000
Jan12 Apr12 Jul 12 Oct 12 Jan13 Apr13 Jul 13 Oct 13 Jan14
Mean
February 19, 2014
SEE PAGE 113 FOR IMPORTANT DISCLOSURES AND ANALYST CERTIFICATIONS
Bumi Serpong Damai
(BSDE IJ)Leading township developer
Init iat e wit h BUY and TP of IDR2, 000 f or t he l eading t ownship developer in Indonesia. BSDE is our t op pick in t he sect or.
One of t he largest propert y developers in Indonesia wit h 4, 800 ha of land bank locat ed i n prime ar eas which is suf f icient f or more t han 10 years of development wit h promising monet izat ion.
It s st rong balance sheet wit h net cash posit ion provides comf ort t owards t he current headwinds in t he sect or.Large prime land bank
We t hink Bumi Serpong Damai (BSDE) wil l be t he benef iciary of Indonesia’s long-t erm growing demand f or housing as it has 4, 800 ha of prime land bank. We est imat e it s land bank is suf f icient f or wit h addit ional support coming f rom it s ot her smaller t ownship proj ect s.
Valuat ion and risks
Our t arget price of IDR2, 000 is a 30% discount t o it s RNAV of IDR2, 857/ share. Our t arget price t ranslat es t o 13. 7x P/ E and 2. 9x P/ B f or 2014F, which is +1SD above it s hist oric average. The risks t o our views include: int er est rat e hikes, economic slowdown and t ight er regulat ions on t he propert y sect or. Market capit al izat ion Maj or sharehol ders:
-Sinarmas Land Lt d. 25%
-PT Ekacent ra Usahamaj u 25%
-PT Serasi Niaga Sakt i 3%
2, 200/ 1, 210
Feb-12 Jul -12 Dec-12 May-13 Oct -13
Bumi Serpong Damai (L) Jakart a Composi t e Index (R)
1 Mt h 3 Mt h 12 Mt h
Absol ut e(%) 6. 5 9. 2 8. 4
Rel at ive t o count ry (%) 3. 2 5. 3 9. 7
Posit ive Neut ral Negat ive
Market Recs 9 3 1
Maybank Consensus % +/
-Target Price (IDR) 2, 000 1, 680 19. 0 2013 PATMI(IDRbn) 2, 335 2, 436 (4. 1) 2014 PATMI(IDRbn) 2, 533 2, 025 25. 1 Sour ce: Fact Set ; Maybank
FYE Dec (IDR bn) FY11A FY12A FY13E FY14E FY15E
Revenue 2, 806. 3 3, 727. 8 5, 715. 5 6, 411. 6 6, 750. 5
Aurel l ia. Set iabudi@maybank-ke. co. id
Wil iant o Ie (62) 21 2557 1125
February 19, 2014 29
Company background
Leading t ownship developer in Indonesia
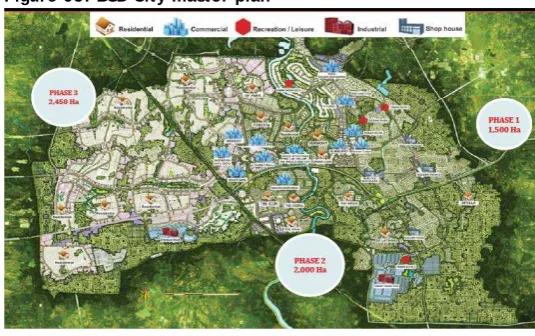
BSDE is one of t he largest t ownship developers in Indonesia f ocusing it s development i n t he Great er Jakart a area. BSDE’ s mai n development ar ea is at Serpong (West of Jakart a) wit h it s f lagship t ownship call ed BSD Cit y. Through it s subsidiary Dut a Per t iwi (DUTI), BSDE also develops ot her t ownships in Grand Wisat a at Bekasi (East of Jakart a) and Kot a Wisat a (f igure 1).
Besides t ownshi ps development , BSDE also owns and manages of f ice buil dings, shopping cent r es and hot els locat ed i n Jakart a, Surabaya, Medan, Balikpapan and Samarinda.
Figure 62: BSDE t ownships and invest ment propert ies
Township Locat ion Development area Land bank
BSD Cit y Serpong 5, 950 ha 2, 337 ha
Grand Wisat a Bekasi 1, 100 ha 528 ha
Kot a Wisat a Cibubur 543 ha 105 ha
Ot her smal ler t ownships
Invest ment propert y Type Locat ion St at us
Sinarmas Pl aza Thamrin Of f ice Buil ding Jakart a Lease
Wisma BII Surabaya Of f ice Buil ding Surabaya Lease
Wisma BII Medan Of f ice Buil ding Medan Lease
Le Grandeur Hot el Jakart a N/ A
Le Grandeur Hot el Bal iikpapan N/ A
ITC Superbl ock Commercial Jakart a St rat a t it le
ITC Superbl ock Commercial Surabaya St rat a t it le
The Breeze Ret ail Serpong Lease
Epicent rum Wal k Mal l Ret ail Jakart a Lease
Sour ce: Company dat a, Maybank KE
Figure 63: Revenue cont ribut ion (IDR bn)
Sour ce: Company dat a, Maybank KE
2, 139 3, 008
4, 962 5, 621
5, 921 667
720
754
791 830
1, 000 2, 000 3, 000 4, 000 5, 000 6, 000 7, 000 8, 000
2011 2012 2013F 2014F 2015F
February 19, 2014 30
Bumi Serpong Damai
St rong support from founding shareholders
BSDE is t he subsidiary of Sinarmas Group, a conglomerat e in Indonesia t hat cont rols 61% of BSDE as of 9M13. Aside f rom propert y development , Sinarmas Group’ s main business operat ions incl ude pul p and paper product s, agribusiness and f ood, f inancial services, t elecommuni cat ions, enery and inf rast r uct ur e.
Mr Mukt ar Widj aj a and Mr . Franky Oesman Widj aj a, t he second generat ion of t he f ounding sharehol ders, hol d t he posit ions of President Commissioner and Vice President Commi sioner. Mr. Michael Jackson Widj dj a, t he t hird generat ion, serves as t he Vice Pr esident Dir ect or .
Earnings drivers
Large land bank wit h promising monet izat ion
The scarcit y of prime land is becomi ng more acut e, put t ing BSDE ahead of compet it ors as it has a large reserve of prime land in BSD Cit y, Grand Wisat a and Kot a Wisat a. We est imat e BSDE’ s land bank wil l support it s growt h f or over 10 years, appl ying conservat ive sales growt h assumpt ions.
BSD Cit y is t he company's f lagship t ownship proj ect l ocat ed in Ser pong, 14 km Sout h West of Jakart a. It has a development ar ea of 5, 950 ha, more t han half of t he area of Paris. Due t o it s huge size, BSD Cit y is divided int o t hree phases and it ’ s curr ent ly developi ng t he second phase.
Resident ial land price i n t he Serpong area has risen considerabl y in t he past f ive years (25% CAGR 2009-2013) due t o t he st rong demand f or houses in t he suburban areas ar ound Jakart a. The ASP of resident ial land was IDR9. 3mn/ sqm as of 2013, accordi ng t o BSDE. BSD Cit y remains t he mai n driver of BSDE's sal es, account ing f or 86% of t ot al 2013 pre-sales.
Aside f rom BSD Cit y, t he company's ot her t ownships such as Grand Wisat a in Bekasi and Kot a Wisat a in Cibubur are st art ing t o close t he gap wit h t he land price i n BSD Cit y, providing more pot ent ial upsi de t o BSDE. The land price in Grand Wisat a is IDR4. 5mn/ sqm, whi le at Kot a Wisat a, Cibubur it is IDR3. 6mn/ sqm as of 2013.
Figure 64: BSD proj ect sit es in Great er Jakart a
Sour ce: Company dat a
Figure 65: BSD Cit y mast er plan
February 19, 2014 31
St rong balance sheet t o support strat egic land acquisit ions
BSDE's cash posit ion of IDR3. 8 t rn as of 9M13 provides st rong support f or st rat egic acquisit ion of land in prime locat ions. The l at est land acquisit ion is at t he Rasuna Said ar ea in Jakart a. BSDE acquir ed 5. 4 ha and a shoppi ng mall i n t he same area f rom anot her developer . BSDE plans t o develop a high-rise r esident ial compl ex here, which is set t o be launched t his year .
Local bank r egulat ions do not per mit loans f or devel opers t o acquir e land. As such, liquidit y is paramount f or developers. BSDE's high cash level gives it great er f lexible t o acqui re mor e land i n st rat egic locat ions in f ut ure.
Expanding out side of Java Island
BSDE is also expanding it s propert y development port f olio out side of t he Java Island in ar eas such as Sumat ra, Kalimant an and Sulawesi t o t ap t he growing demand f or homes in t hese areas. We t hink t he relat ively lower land prices and compet it ion out side of Java Island will deliver posit ive cont ribut ions t o BSDE in f ut ure.
Figure 66: BSDE’ s presence in five big cit ies in Indonesia
Sour ce: Company dat a
Adding more invest ment propert ies t o it s port folio
As of 9M13, t he company owns and manages f ive of f ice buildi ngs, 10 commercial superblocks and t wo hot els, which cont ribut ed 13% of FY13F revenue. The lat est addit ions t o BSDE’ s invest ment propert y port f olio are t he "The Br eeze" lif est yle mall in BSD Cit y, and t he acquisit ion of t he Epicent rum Walk Shopping Mall in Rasuna Said, Jakart a.
February 19, 2014 32
Bumi Serpong Damai
Financials
Expect flat pre-sales in 2014F and growt h in 2015F
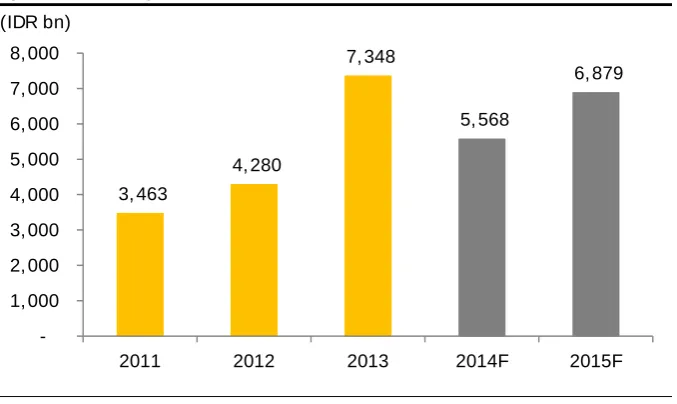
BSDE’ s pr e-sal es have grown rapidly over t he past f i ve years (by 41% CAGR 2009-2013). Due t o inorganic sales of 78 ha of land t o t wo JV companies, pre-sales f or 2013 j umped t o IDR7. 3 t rn, a 72% YoY growt h. Excl uding t he bulk sales, BSDE booked pr e-sal es of IDR5. 4 t rn (up 27% YoY). For t his year , management guided t hat t her e wil l be no bulk sal es hence we f or ecast BSDE’ s organic pre-sales t o be f lat at IDR5. 6 t rn and t o grow 23% YoY t o IDR6. 9 t r n in 2015F.
Figure 67: BSDE’ s pre-sales
Sour ce: Company dat a, Maybank KE
Not e: hi gh 2013 pr e-sal es due t o bul k sal es amount i ng IDR1. 9t n t o 2 JV compani es
BSD Cit y cont inues t o be t he main driver of BSDE’ s overall pre-sales wit h cont ribut ions of 86% in 2013, up f rom 73% in 2012, on t he back of t he bulk sales in 2013. For t his year , we are conf ident on BSD Cit y’ s sales t o remai n solid and t o cont ribut e 68% t o overall pr e-sal es. We also t ake int o account addit ional cont ribut ions f r om a t ower apart ment proj ect in Taman Permat a Buana, West Jakart a, which we expect wil l cont ribut e 14% of pr e-sal es, wit h t he remaining 18% coming f rom t he ot her smal l er t ownship proj ect s.
Figure 68: Pre-sales composit ion (2012)
Sour ce: Company dat a, Maybank KE
Figure 69: Pre-sales composit ion (2013)
Sour ce: Company dat a, Maybank KE
3, 463
4, 280
7, 348
5, 568
6, 879
1, 000 2, 000 3, 000 4, 000 5, 000 6, 000 7, 000 8, 000
2011 2012 2013 2014F 2015F
(IDR bn)
73% 7%
9%
5% 6%
BSD Cit y Gr and Wisat a
Kot a Wisat a Taman Permat a Buana
Ot her s
86% 4%
5%2% 3%
BSD Cit y Gr and Wisat a
Kot a Wisat a Taman Permat a Buana
February 19, 2014 33
St rong balance sheet leads t o increasing profit abilit y
The st rong pr e-sal es in 2013 will support BSDE’ s earnings in 2014F. We
(IDR bn) Revenue Operat ing Prof i t Net Prof it
64% 64% 66% 65% 66%
Gross margins Operat ing margins Net margins
February 19, 2014 34
Bumi Serpong Damai
Risks t o our views
Int erest rat e hikes
In general , developers wi ll suf f er when t he cent ral bank increases t he ref er ence rat e as t he cost of f unding t o purchase propert y wil l incr ease and we expect invest ors t o delay invest ing in propert i es as a result .
Economic downt urn
In t he event of a slowdown in t he economy, we expect propert y demand t o weaken, especial ly i n t he middl e-upper segment and f or high-rise proj ect s. The slowing economy coul d also incr ease t he risk of bad debt s f rom cust omers wit h cash-inst al ment plans.
Regulat ory environment
February 19, 2014 35
Valuat ion
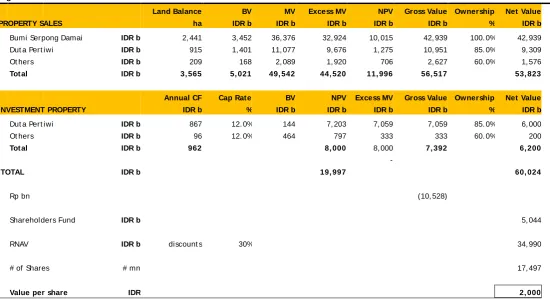
Init iat e BSDE at BUY and TP of IDR2, 000, which impli es 30% discount t o it s RNAV of IDR2, 857/ share. We calculat e it s RNAV by using DCF valuat ion of it s f ive-year operat i ng cashf lows and we assigned residual val ue of it s remaining land bank. To derive t he DCF valuat ion, we assigned WACC of 12. 0% based on 13. 2% cost of equit y, bet a of 1. 3 and 9. 3% cost of debt assuming 30% long-t erm debt -t o-equit y rat io.
We applied only a 30% discount t o BSDE due t o it s st rong balance sheet , conservat ive proj ect s and valuabl e land bank. We believe BSDE’ s combinat ion of prime asset s and st rong balance sheet wi ll cont inue t o uphold t he company’ s posi t ion as t he leading t ownshi p developer .
Our t arget price t ranslat es t o 13. 7x P/ E and 2. 9x P/ B f or 2014F. Our TP is +1SD above t he hist oric f ive-year mean of one-year f orward P/ E of 10. 8x and one-year f orwar d P/ B of 2. 1x.
Figure 74: RNAV calculat ion
Land Balance BV MV Excess MV NPV Gross Value Ownership Net Value PROPERTY SALES ha IDR b IDR b IDR b IDR b IDR b % IDR b
Bumi Serpong Damai IDR b 2, 441 3, 452 36, 376 32, 924 10, 015 42, 939 100. 0% 42, 939
Dut a Pert iwi IDR b 915 1, 401 11, 077 9, 676 1, 275 10, 951 85. 0% 9, 309
Ot hers IDR b 209 168 2, 089 1, 920 706 2, 627 60. 0% 1, 576
Tot al IDR b 3, 565 5, 021 49, 542 44, 520 11, 996 56, 517 53, 823
Annual CF Cap Rate BV NPV Excess MV Gross Value Ownership Net Value INVESTMENT PROPERTY IDR b % IDR b IDR b IDR b IDR b % IDR b Dut a Pert iwi IDR b 867 12. 0% 144 7, 203 7, 059 7, 059 85. 0% 6, 000
Ot hers IDR b 96 12. 0% 464 797 333 333 60. 0% 200
Tot al IDR b 962 8, 000 8, 000 7, 392 6, 200
-
TOTAL IDR b 19, 997 60, 024
Rp bn (10, 528)
Sharehol ders Fund IDR b 5, 044
RNAV IDR b discount s 30% 34, 990
# of Shares # mn 17, 497
Value per share IDR 2, 000
February 19, 2014 36
Bumi Serpong Damai
FYE 31 Dec (IDR bn) FY11A FY12A FY13E FY14E FY15E
Key Metrics
P/ E (r epor t ed) (x) 32. 3 21. 1 11. 6 10. 7 9. 5
Cor e P/ E (x) 32. 3 21. 1 11. 6 10. 7 9. 5
P/ BV (x) 3. 9 3. 4 2. 7 2. 3 1. 9
P/ NTA (x) 4. 0 3. 4 na na na
Net dividend yield (%) 0. 6 1. 0 0. 0 0. 0 0. 0
FCF yield (%) 2. 4 0. 3 4. 1 5. 7 3. 3
EV/ EBITDA (x) nm nm 0. 3 nm nm
EV/ EBIT (x) 18. 6 14. 3 0. 4 nm nm
Income Statement
Revenue 2, 806. 3 3, 727. 8 5, 715. 5 6, 411. 6 6, 750. 5
Gr oss pr of i t 1, 744. 1 2, 325. 6 3, 791. 6 4, 170. 9 4, 467. 1
EBITDA 0. 0 0. 0 2, 836. 4 3, 135. 6 3, 323. 3
Depreci at i on 0. 0 0. 0 (103. 9) (111. 8) (120. 7)
Amort i sat i on 0. 0 0. 0 0. 0 0. 0 0. 0
EBIT 807. 2 1, 337. 7 2, 732. 5 3, 023. 8 3, 202. 6
Net i nt er est i ncome / (exp) (153. 4) (90. 4) 134. 3 98. 9 278. 0
Associ at es & JV 53. 9 0. 0 45. 2 47. 4 49. 8
Except i onal s 0. 0 0. 0 0. 0 0. 0 0. 0
Ot her pret ax i ncome 0. 0 0. 0 (20. 0) (20. 0) (20. 0)
Pr et ax prof i t 1, 170. 2 1, 653. 5 2, 892. 0 3, 150. 2 3, 510. 4
Income t ax (158. 2) (217. 7) (323. 5) (360. 1) (379. 0)
Mi nor i t i es (171. 3) (192. 8) (233. 5) (256. 9) (282. 6)
Report ed net pr of i t 840. 8 1, 286. 0 2, 335. 0 2, 533. 2 2, 848. 8
Cor e net pr of i t 840. 8 1, 286. 0 2, 335. 0 2, 533. 2 2, 848. 8
Balance Sheet
Cash & Short Term Invest ment s 4, 165. 8 4, 052. 5 3, 363. 5 6, 124. 8 6, 613. 6
Pr oper t y, Pl ant & Equi p (net ) 4, 973. 5 7, 616. 4 440. 3 424. 8 415. 5
Int angi bl e asset s 11. 8 9. 3 0. 0 0. 0 0. 0
Invest ment i n Associ at es & JVs 0. 0 668. 9 714. 2 761. 6 811. 3
Ot her asset s 10, 902. 3 12, 497. 0 13, 931. 4 13, 759. 4 15, 952. 1
Tot al asset s 12, 787. 4 16, 756. 7 19, 164. 8 21, 869. 3 24, 677. 9
ST i nt erest bear i ng debt 0. 0 91. 0 91. 0 91. 0 91. 0
LT i nt er est bear i ng debt 663. 4 1, 034. 4 990. 0 990. 0 905. 0
Ot her l i abi l i t i es 3, 866. 8 5, 190. 6 4, 898. 5 5, 380. 8 5, 758. 7
Tot al Li abi l i t i es 4, 530. 2 6, 225. 0 5, 979. 5 6, 461. 8 6, 754. 7
Shar ehol der s Equi t y 6, 872. 5 7, 916. 5 9, 951. 7 11, 919. 2 14, 154. 6
Mi nor i t y Int er est 1, 384. 7 2, 615. 2 3, 233. 6 3, 488. 4 3, 768. 6
Tot al sharehol ders equi t y 8, 257. 2 10, 531. 7 13, 185. 3 15, 407. 6 17, 923. 2
Cash Flow
Pr et ax prof i t 1, 170. 2 1, 653. 5 2, 892. 0 3, 150. 2 3, 510. 4
Depr eci at i on & amor t i sat i on 0. 0 0. 0 103. 9 111. 8 120. 7
Adj net i nt erest (i ncome)/ exp (166. 5) (79. 5) na na na
Change i n wor ki ng capi t al 0. 0 0. 0 (1, 260. 8) (1, 015. 8) (1, 995. 8)
Cash t axes pai d 0. 0 222. 3 (323. 5) (360. 1) (379. 0)
Ot her operat i ng cash f l ow 0. 0 0. 0 (212. 3) (233. 5) (256. 9)
Cash f l ow f rom oper at i ons 1, 073. 2 361. 2 1, 199. 3 1, 652. 6 999. 4
Capex (329. 9) (106. 5) (83. 2) (96. 3) (111. 4)
Fr ee cash f l ow 640. 7 79. 7 1, 116. 1 1, 556. 3 887. 9
Di vi dends pai d (105. 0) (175. 0) (321. 5) (589. 1) (639. 1)
Equi t y r ai sed / (purchased) 0. 0 126. 9 0. 0 0. 0 0. 0
Change i n Debt (646. 5) 470. 8 0. 0 0. 0 (85. 0)
OTH i nvest i ng/ f i nanci ng cash f l ow 102. 8 (128. 6) (1, 392. 1) 1, 794. 1 325. 1
Ef f ect of exch r at e changes 3. 2 13. 0 0. 0 0. 0 0. 0
February 19, 2014 37
FYE 31 Dec (IDR bn) FY11A FY12A FY13E FY14E FY15E
Key Rat ios Growth ratios (%)
Revenue gr owt h 13. 3 32. 8 53. 3 12. 2 5. 3
EBITDA growt h na na nm 10. 5 6. 0
EBIT gr owt h nm 65. 7 104. 3 10. 7 5. 9
Pr et ax growt h 30. 9 41. 3 74. 9 8. 9 11. 4
Repor t ed net prof i t gr owt h 113. 2 53. 0 81. 6 8. 5 12. 5
Cor e net pr of i t growt h 113. 2 53. 0 81. 6 8. 5 12. 5
Profitability ratios (%)
EBITDA mar gin 0. 0 0. 0 49. 6 48. 9 49. 2
EBIT mar gin 28. 8 35. 9 47. 8 47. 2 47. 4
Pr et ax pr of it margin 41. 7 44. 4 50. 6 49. 1 52. 0
Payout rat io 20. 8 20. 4 0. 0 0. 0 0. 0
DuPont analysis
Net prof i t margi n (%) 30. 0 34. 5 40. 9 39. 5 42. 2
Revenue/ Asset s (x) 0. 2 0. 2 0. 3 0. 3 0. 3
Asset s/ Equi t y (x) 1. 9 2. 1 1. 9 1. 8 1. 7
ROAE (%) 10. 7 13. 7 19. 7 17. 7 17. 1
ROAA (%) 6. 9 8. 7 13. 0 12. 3 12. 2
Liquidity & Efficiency
Cash conver si on cycl e nm nm nm nm nm
Days r ecei vabl e out st andi ng 12. 2 8. 2 5. 2 4. 8 4. 8
Days i nvent or y out st andi ng nm nm nm nm nm
Days payabl es out st andi ng 2. 6 nm 23. 6 42. 3 44. 2
Di vi dend cover (x) 4. 8 4. 9 nm nm nm
Cur r ent r at i o (x) nm nm 6. 3 8. 9 nm
Leverage & Expense Analysis
Asset / Li abi l i t y (x) 2. 8 2. 7 3. 2 3. 4 3. 7
Net debt / equi t y (%) net cash net cash net cash net cash net cash
Net i nt er est cover (x) 5. 3 14. 8 na na na
Debt / EBITDA (x) nm nm 0. 4 0. 3 0. 3
Capex/ r evenue (%) 11. 8 2. 9 1. 5 1. 5 1. 7