1
SHEARWALL FRAME-BELT TRUSS (VIRTUAL OUTRIGGER)
BUILDING
Pamuda Pudjisuryadi1, Benjamin Lumantarna1, Helen Tandya2, Indryana Loka2
1
Lecturer, Department of Civil Engineering, Faculty of Civil Engineering and Planning Petra Christian University, Surabaya
2
Alumnus, Department of Civil Engineering, Faculty of Civil Engineering and Planning Petra Christian University, Surabaya
ABSTRACT
Researches have been conducted to study Shearwall-frame combined with belt truss as structural system (SFBT), in which the post-elastic behavior and ductility of this structural system are explored. A 60-story SFBT building, with a ductility set equal to 3.75 (value for fully ductile cantilever wall) is considered. The Elastic Response Spectrum used for design is taken from Zone 2 of Indonesian Seismic Map. Capacity design method according to Indonesian Concrete Code is employed. The seismic performance is analyzed using static linear push-over analysis and dynamic non-linear time-history analysis. Spectrum consistent ground motions of the May 18, 1940 El-Centro earthquake N-S components scaled to maximum accelerations of various return periods (50, 200, and 500 years) are used for analysis.The results of this study show that plastic hinges mainly developed in beams above the truss, columns below the truss, and bottom levels of the wall. The building shows no indication of structural instability.
Keywords: ductility, shear wall frame–belt truss, static non-linear push over analysis, dynamic non-linear time history analysis.
INTRODUCTION
Outrigger structural system has been used sucsessfully to reduce lateral displacement of tall building, unfortunately the installation of outriggers restrict the utilization of the floors occupied by the outriggers. Nair [1] proposed to use belt truss instead of outrigger and named the system virtual outrigger. Nair [1] showed that shear wall belt truss structure, although not as good as outrigger, could effectively reduced the lateral displacement in the elastic region. Adhi and Tengara [2], and Lumantarna et al [3,4] considered shearwall-frame belt truss (SFBT) and showed the same behavior.
Belt Truss as Virtual Outrigger
Braced Core
Figure 1. Tipical Belt Truss Location in a Highrise Building [1]
In order to keep the function as outrigger, this system requires the floor diaphragm to convert the core overturning moment due to lateral load into a couple of horizontal forces (Figure 2a). Further, this horizontal forces will be converted as axial forces in exterior columns (Figure 2b).
shearwall /
Figure 2. (a) Conversion of Core Overturning Moment into Coupled Horizontal Forces (b) Conversion of Coupled Horizontal Forces into Axial Forces in Exterior Columns
Post elastic behaviour of SFBT
Pudjisuryadi and Lumantarna [5,6] studied the post elastic behavior of a 30 story SFBT structure (Figure 3) assuming a structural ductility of 3.75 (reduction factor, R=6.0) [7]. Ductilily is defined as the ability of a structure to undergo repeated plastic deformations while keeping adequate strength and stiffness to maintain overall stability. Ductility ( ) of a structure is expressed as the ratio of near collapse displacement ( m) with respect to displacement at the first yield ( y), which in the current Indonesian Seismic Code [7], is expressed as Equation 1.
1.0 =
y
m
m (1)
In subsequent study, Prasetio and Sumendap [8] studied similar 30 story building with some structural modification to eliminate the short beams (Figure 4). Results showed that there is no elements failure (damage index < 1.0) in the building. This study intends to further explore the adequacy of value 3.75 as ductility in SFBT system by doubling the building height.
30th floor
20th floor
(a) Interior Frame (b) Exterior Frame (c) Building Plan
Shear Wall 0.3x6 m2
Figure 3. The 30-Story SFBT Building Considered by Pudjisuryadi and Lumantarna [5,6]
A B C D
1 2 3 4
Y
X
(c) Building Plan (b) Exterior Frame
(a) Interior Frame [email protected]
20th floor
0.3x0.6m Shear Wall2
30th floor
BUILDING AND LOADS CONSIDERED
In this study, a 60 story building with SFBT as lateral resisting system is evaluated. The building consists of five spans (ten meters each) in both direction, and a three story belt truss is installed at two third of building height (Figure 5). Dimensions of structural elements used can be seen in Table 1. The building is design according to the current Indonesian Seismic and Concrete Codes [7, 9]. Seismic zone 2 and soft soil condition are used for this study. Ductility value of 3.75 (R =6.0) is assumed in the design.
1 2 3 4 5 6
W
Figure 5. Plan and Belt Truss Location of the Building.
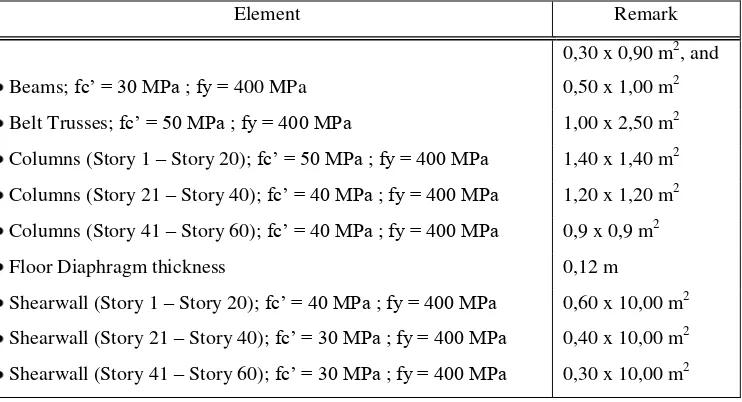
Table 1. Dimension of Structural Elements
Element Remark
Beams; fc’ = 30 MPa ; fy = 400 MPa
0,30 x 0,90 m2, and 0,50 x 1,00 m2 Belt Trusses; fc’ = 50 MPa ; fy = 400 MPa 1,00 x 2,50 m2 Columns (Story 1 – Story 20); fc’ = 50 MPa ; fy = 400 MPa 1,40 x 1,40 m2 Columns (Story 21 – Story 40); fc’ = 40 MPa ; fy = 400 MPa 1,20 x 1,20 m2 Columns (Story 41 – Story 60); fc’ = 40 MPa ; fy = 400 MPa 0,9 x 0,9 m2
Floor Diaphragm thickness 0,12 m
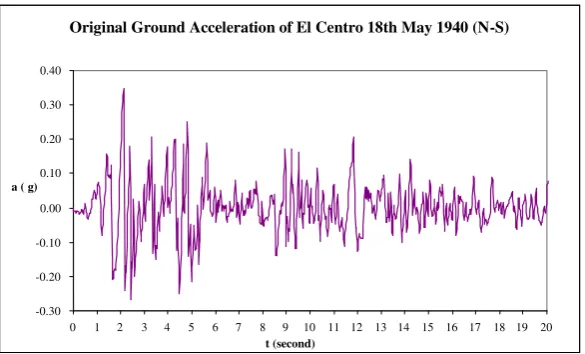
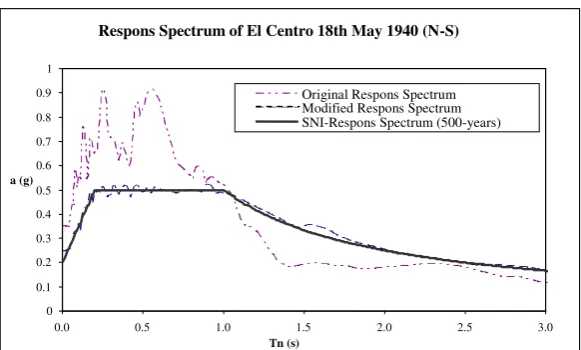
The post elastic behaviour of this building is evaluated using static non-linear push-over analysis (PO) and Dynamic non-linear Time History analysis (NLTH). The load pattern used for static non-linear push-over analysis is the building’s first mode. Spectrum consistent ground acceleration is used for dynamic non-linear time history analysis. The spectrum consistent ground acceleration is modified from the North-South Component of El Centro 18 May 1940 using RESMAT a program developed at Petra Christian University [10]. The original ground acceleration is shown in Figure 6, while the modified ground acceleration consistent with a 500 years return period spectrum of Zone 2, soft soil, in accordance to the Indonesian Earthquake Code SNI 03-1726-2002 [7] is shown in Figure 7. Figure 8 shows comparison of respons spectra given in the code, El-Centro N-S Component, and the Modified Ground Acceleration. The modified ground acceleration (Figure 7) is then scaled down to earthquake with 50 and 200 years return period levels by using PGA factor given in [11]. The behavior of the building subjected to three levels of ground acceleration (50, 200, and 500 years return period) is analysed. Both PO and NLTH analysis are performed using SAP2000 [12].
Original Ground Acceleration of El Centro 18th May 1940 (N-S)
-0.30
Figure 6. Original Ground Acceleration of El Centro 18th May 1940 North-South Component
Modified Ground Acceleration of El Centro 18th May 1940 (N-S)
-0.25
Respons Spectrum of El Centro 18th May 1940 (N-S)
Figure 8. Respons Spectrum of El Centro 18th May 1940 North-South Component
RESULTS
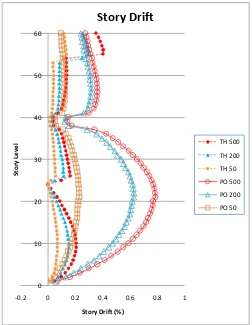
The behaviour of the structure in terms of lateral displacements, lateral drifts, and pattern of plastic hinges formation and their damage level are determined. The displacements and lateral story drifts are shown in Figures 9 and 10 respectively. In these Figures, PO and TH indicate static non-linear pushover analysis and dynamic non linear time history analysis respectively. The numbers following either PO or TH are the return period of the earthquake level. It can be seen clearly that results of displacements and lateral story drifts from PO are significantly larger than those from NLTH.
0
Figure 10. Lateral Story Drift of the structure
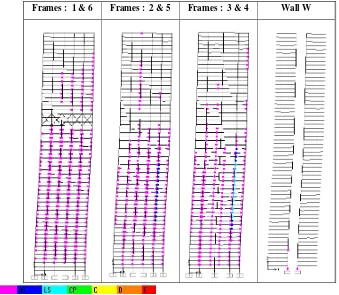
Frames : 1 & 6 Frames : 2 & 5 Frames : 3 & 4 Wall W
Figure 11. Plastic Hinges Formation Analysed by Static Non-Linear Push Over with 50 Years Return Period Earthquake.
Frames : 1 & 6 Frames : 2 & 5 Frames : 3 & 4 Wall W
Frames : 1 & 6 Frames : 2 & 5 Frames : 3 & 4 Wall W
Figure 13. Plastic Hinges Formation Analysed by Static Non-Linear Push Over with 500 Years Return Period Earthquake.
Frames : 1 & 6 Frames : 2 & 5 Frames : 3 & 4 Wall W
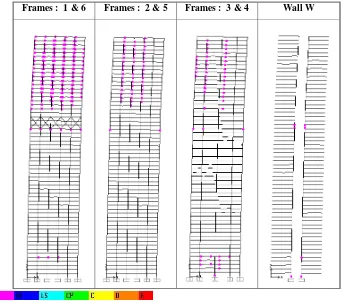
Frames : 1 & 6 Frames : 2 & 5 Frames : 3 & 4 Wall W
Figure 15. Plastic Hinges Formation Analysed by Dynamic Non-Linear Time History with 200 Years Return Period Earthquake.
Frames : 1 & 6 Frames : 2 & 5 Frames : 3 & 4 Wall W
DISCUSSION AND CONCLUSIONS
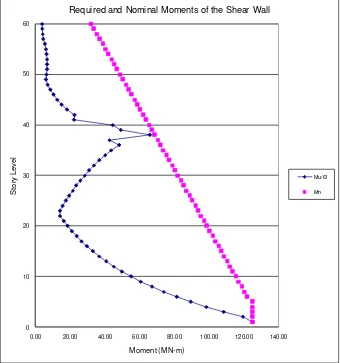
Static non-linear push over analysis is a simple alternative method in evaluating structure behaviour under dynamic loading. In this study, with the complexity of vertical stiffness distribution with the existance of belt truss, static non-linear push over analysis shows its limitation. Lateral story drifts from dynamic non-linear time history analysis show a more logical results. The lateral story drifts significantly decrease at the level of belt truss and at the story 23rd where overturning moment of shearwall drops (as shown in Figure 17). Dynamic non-linear time history analysis is able to show this behavior but not the static non-linear push over analysis.
0
0.00 20.00 40.00 60.00 80.00 100.00 120.00 140.00
S
Required and Nominal Moments of the Shear Wall
Mu/Ø
Mn
Figure 17. Required and Nominal Moments at Shearwall (Response Spectrum Analysis)
Table 2. Building Performance Level According to Drifts specified by ACMC
Return Period (years)
Performance Level
Serviceability Damage Control Safety Unacceptable
Limit State Limit State Limit State Limit State
50 PO - TH
200 TH PO
500 TH PO
Maximum Drift
(%) 0,5 1 2 > 2,00
Table 3. Building Performance Level According to Damage Index specified by ACMC
Return Period (years)
Performance Level
First Serviceability Damage Control Safety Unacceptable
Yield Limit State Limit State Limit State Limit State
A more detail observation indicates that maximum damage index at beams is only 0.334, while columns and structural walls show an even smaller ratio (lower than 0.1). It can be concluded that overall performance of the building shows satisfactory results, and no sign of instability. According to this study, the ductility value, μ=3.75 (equivalent to seismic reduction factor R=6) can be used for the considered shearwall frame–belt truss system.
REFERENCES
1. Nair, R. S., Belt Trusses and Basements as ‘Virtual’ Outriggers for Tall Buildings,
Engineering Journal, AISC, Fourth Quarter/1998, pp. 140-146.
2. Adhi, A. and Tenggara, W.A., Pemakaian Belt Truss sebagai Virtual Outrigger, Undergraduate Thesis. Faculty of Civil Engineering and Planning, Department of Civil Engineering. Petra Christian University, Surabaya, Indonesia, 2000.
4. Lumantarna, B., The Effectiveness of Belt Truss As Virtual Outrigger for Tall Building, Proc. ICCMC/IBST 2001 International Conference on Advanced Technologies in Design, Construction and Maintenance of Concrete Structures, March 2001 Hanoi, Vietnam, pp. 140-146.
5. Pudjisuryadi, P., Lumantarna, B., Daktilitas Struktur Shearwall – Frame dengan Belt Truss sebagai Virtual Outrigger, Civil Engineering Dimension, vol.8.no.1, March 2006, pp.41-46.
6. Pudjisuryadi, P., Lumantarna, B., A Preliminary Study on the Ductility of Shear Wall Frame – Belt Truss (Virtual Outrigger) System, Proc. The Tenth East Asia-Pacific Conference on Structural Engineering & Construction (EASEC-10), August 3-5 2006 Bangkok, Thailand, pp. 695-700.
7. Badan Standarisasi Nasional (BSN), Standar Nasional Indonesia (SNI) 03-1726-2002, Tata Cara Perencanaan Ketahanan Gempa untuk Bangunan Gedung.
8. Prasetio, A., Sumendap, H.S., Studi Lanjut tentang Daktilitas Struktur pada Sistem Shearwall Frame – Belt Truss sebagai Virtual Outrigger, Undergraduate Thesis. Faculty of Civil Engineering and Planning, Department of Civil Engineering. Petra Christian University, Surabaya, Indonesia, 2008.
9. Standar Nasional Indonesia (SNI) 03-2847-2002, Tata Cara Perencanaan Struktur Beton Untuk Bangunan Gedung.
10.Lumantarna, B., Lukito, M., RESMAT, Sebuah Program Interaktif untuk
Menghasilkan Riwayat Waktu Gempa dengan Sppektrum Tertentu, Proc. HAKI
Conference 1997, August 13-14 1997 Jakarta, Indonesia, pp. 128-135.
11.Susila, I.G.M., Seismic Microzonation and Site Spesific Respons Analysis for Denpasar, Thesis. Geotechnical Engineering of Graduate Program, Institute of Technology, Bandung, Indonesia, 2000.
12.Habibullah, A., SAP2000-Linear and Nonlinear Static and Dynamic Analysis and Design of Three-Dimensional Structure, Computer and Structures, Inc., Berkeley, California, USA, 2006.
![Figure 1. Tipical Belt Truss Location in a Highrise Building [1]](https://thumb-ap.123doks.com/thumbv2/123dok/1550695.2047436/2.595.80.512.385.471/figure-tipical-belt-truss-location-highrise-building.webp)
![Figure 3. The 30-Story SFBT Building Considered by Pudjisuryadi and Lumantarna [5,6]](https://thumb-ap.123doks.com/thumbv2/123dok/1550695.2047436/3.595.120.491.170.436/figure-story-sfbt-building-considered-pudjisuryadi-lumantarna.webp)