W.a.w (we are watching) smart app: accommodating social perception
towards public officers’ performance
To cite this article: S A Widhoyoko et al 2018 J. Phys.: Conf. Ser.978 012023
View the article online for updates and enhancements.
1
Content from this work may be used under the terms of theCreative Commons Attribution 3.0 licence. Any further distribution of this work must maintain attribution to the author(s) and the title of the work, journal citation and DOI.
Published under licence by IOP Publishing Ltd
W.a.w (we are watching) smart app: accommodating social
perception towards public o
fficers’
performance
S A Widhoyoko1,5, Sasmoko2,5, L A Nasir3, S R Manalu4,5 and Y Indrianti5 1Podomoro University, Jakarta, Indonesia
2Faculty of Humaniora, Bina Nusantara University, Jakarta, Indonesia 3University of Indonesia, Jakarta, Indonesia
4Mobile Application & Technology Department, School of Computer Science, Bina
Nusantara University, Jakarta, Indonesia
5Research Interest Group in Educational Technology, Bina Nusantara University,
Jakarta, Indonesia
Email: samuel.anindyo@podomorouniversity.ac.id, sasmoko@binus.edu, laode.arrahman@ui.ac.id, smanalu@binus.edu, yasintaindrianti@gmail.com
Abstract. This research is a continuation of previous research that is corruption early prevention is expanded by using expert system to analyze data and produce information to build decision. The research method used is neuroresearch method through three stages of research, namely exploratory stage, explanatory stage and confirmatory stages. The exploratory research finds W.aW's Principles and W.a.W's Units of Assessment as the basis for the preparation of the application. Stages of explanatory research in the form of W.a.W's design of IT and confirmatory research stages are the design of expert system W.a.W. Expert System uses this formulation to generate dynamic standard value for each category and current social perception.
1.Introduction
The impact of good governance value in reducing the public officers’ misconduct has been a trending
topic over the last ten years. However, not many discussions include the role of society as one of the objective components although, some scholars set aside this element as the secondary consideration in terms of impartial respondents resulting bias information. Moreover, some developed countries with certain governmental ideology tend to separate society from political environment to neutralize any possibility of conflict. On the other hand, Organisation for Economic Co-operation and Development
(OECD) has been developing a framework emphasizing government’s transparency to public in which
societal perception towards government is built amongst the society.
Accordingly, there are three elements that trigger good societal perception: (i) law enforcement, (ii) infrastructure development, and (iii) fair treatment. In its political application, these aspects shall be distorted by corrupted nature infecting both personally and systemically. In this context, there is a belief to transform social perception into a more supervision function as it is the most independent
opinion towards government’s performance. Therefore, a tool in form of a smart application corresponding modern world requirements must be built to facilitate societal perception. Furthermore, the tool used must be able to present an impartial information because political partiality does exist.
2
expected to accommodate public’s perception towards the government performance (personal and organizational) through an application without sacrificing the reliability of information. This research is expanded from previous research that using DSS to build decisions, but for this research uses Expert System (ES) to analyze the data and generate information to build decision. Furthermore, this application is designed to support the CEP that is constructed for presidential Expert System (ES) purposes [1].
2.Research Method
This research is developed using Neuroresearch. Neuroresearch is a research methodology approach that combine quantitative and qualitative techniques. This research conducts using three steps namely exploratory, explanatory, and confirmatory. This research methodology already use in previous research, that focus on Corruption Early Prevention blue print by implementing decision support system [2]. This research is also conducted using exploratory research. That is doing literature review regarding to W.a.W to produce construct theoretical W.a.W’s technology principles to be implemented. This research use Expert System to analyze and summarize the data.
3.Result and Analysis 3.1.W.aW’s Principles
As an information system, W.a.W is grounded on two frameworks that was developed from basic internal control designed by COSO (Committee of Sponsoring Organizations of the Treadway Commission). In terms of framework development, W.a.W is not built on COBIT (Control Objective for Information and related Technology) due to its purposes that emphasises on the validation of data source. In this aspect, COBIT is mainly designed to bridge the gap between control requirements, technical issues and business risks which enables clear policy development and good practice for IT control throughout organizations. COBIT also emphasizes regulatory compliance, helps organizations to increase the value attained from IT, simplifies implementation of the enterprises' IT governance and control framework [2].
Due to its needs to trace both users and targeted personnel, W.a.W is equipped with a Occupational Fraud Detection by Social Network Analysis (OFD-SNA). According to Lookman and Nurcan (2015), SNA is an emerging framework that enables fraud examiner to inter-connect interaction patterns between person-to-person. This method is successful for a problem-solving application, mainly in several economic crime issues i.e. business strategy, fraud detection, and counter terrorism. In other words, SNA provides interaction patterns between people in the forms of data collection and graph visualization [3]. Furthermore, as the SNA’s coverage enabling fraud examiners to detect the insider fraud through networking organization, computer algorithms pattern, and auditable raw data [4], it is assumed that SNA will also be able to uncovered the users’ data based on the tips [5].
Another framework is also implemented for the purpose of data base security named CIA (Confidentiality-Integrity-Availability) triad [6]. Confidentiality is the first requirement for data security which protects the data from thieving or reaching wrong target through restricted access [2]. Second, the data security must also built in a procedure that support consistency and accuracy [7]. According to Houck et all., (2006) Other requirements for data integrity are backup files for restoration system and permission of access control. The last component that is the most important thing for fraud detection is availability, as it is a fundamental aspect that protect both integrity and confidentiality [8]. In this context, availability comprises all aspects including the originality of the software adopted which has been the requirement for admissibility of forensic reporting [9].
3
of introductory and informational questions are necessary to be conducted in sequence. However, well-performed closing stage of interview must be conducted to reconfirm facts, obtain additional clues, and retain goodwill [11].
Therefore, According to Ord, Shaw and Green (2011) W.a.W’s questions’ configuration is
grounded on opened and closed questions. Closed question is a type of inquiry that is able to lead
respondents’ focuses into a certain field of information with minimum distraction [12], [13] and detect
respondents’ inconsistencies which eliminates biased informants [13], [14]. Based on these traits, the closed question is suitable for both introductory and closing stages which are also equipped with multi-part-patterned question between both stages to validate the information [15]. Meanwhile the opened question is more flexible type which allows users to information related to person-to-person
linkages, alleged motivation, and other related societies’ suspicions [13]. At the end, the system is set to evaluate all information through automated summarizing system and syncing all summarized information to specific target in terms of producing decisive output.
Last but not least, filtering system is pivotal for the information objectivity. The aspect of objectivity has been an issue for all surveying tools in political corruption fields. A research done in China finds that there are gaps and discrepancies between corruption perception between national, regional, and local areas even though, the questions lead to the same purposes [16]. Another finding related to the deficiency of perception is the critiques addressed to Corruption Perception Index (CPI) published by Transparency International (TI). According to Andersson and Heywood (2009), the main issue of CPI is in the unclarified definition of corruption as a factor to deteriorated corporate governance which led to diffused data articulation [17]. However, the use of perception has been considered as an empirical approach in the field of research. The use of Delphi method in both research applications and techniques [18], [19] and investigative auditing especially in anti-fraud risk assessment program [20] have one main requirement which is identifiable respondents with sufficient capacity.
Corruption perception is a very subjective type of information which needs a rigorous-selective filtering system that reduces bewilderment in decision making process in terms of matching perception and reality [21]. This can easily be done through social-partiality and personal-biodata analysis [4].
Both of these techniques aim to both (i) reveal respondents’ inclination in either striking-down or elevating a public officer [22], [23]and (ii) form an output contained with subjective information from respondents that possess sufficient capacity in providing such information [17], [24], [25]. In processing the big data collection, Stanfield (2009) provides simplest clues related to big-volume data discovery in the field of computer forensics. In reacting upon wide range of data discovery, forensic analysts usually undertake two alternatives: (i) gathering similar output from varied perspectives (in this context: all society elements, groups, and organization) and/or deleting similar output from similar perspectives [26].
3.2.W.a.W’s Units of Assessment
As it is revealed, that the nature of society perception is limited only as a set of supporting information for direct information provided through industry and retail society which means that, numerical analysis towards the social perception must get through the screening system. There are commonly
three aspects to assess the public officers’ performance: (i) growth of public infrastructure, (ii)
convenience of public services, and (iii) financial transparency of officers [27]. All these facts must be viewed in a framework that represents three areas in which society is always concern at i.e. politics, economics, and regulations. According to Adams (1981), reflecting from the politics circumstance United States of America (USA), which is a fair representation of the majority of politic practices [24],
“Iron Triangle” can be used to view a modern politics that embraces politicians, regulators, and certain
4
Figure 1. Iron Triangle: Political Economy of Regulation
Based on three indicators, it is revealed that the dimensions and indicators for the assessment system are completely structured. The table below depicts the relationship between the both groups.
Table 1. Relationship Between Dimension and Indicators of W.a.W Assessment System
W a W
Dimensions
D.1 D.2 D.3
Infrastructure
Growth Public Services Quality Financial Transparency
Indicators I of D.1 I of D.2 I of D.3
I.1 Politics I.1 related with D.1 I.1 related with D.2 I.1 related with D.3 I.2 Economics I.2 related with D.1 I.2 related with D.2 I.2 related with D.3
I.3 Regulation I.3 related with D.1 I.3 related with D.2 I.3 related with D.3
3.3 W.a.W’s Design of IT
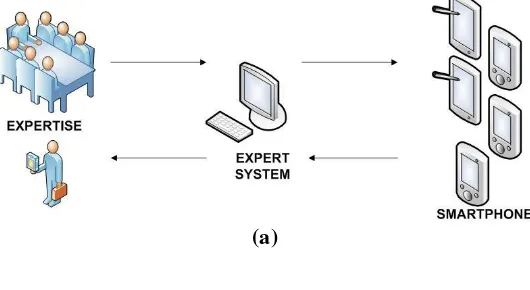
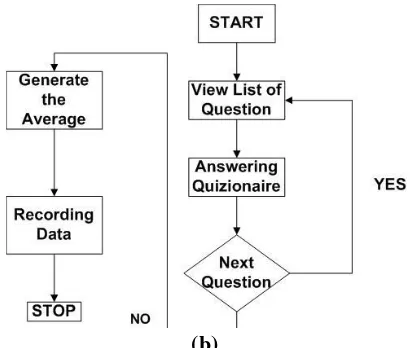
Expert System is a computer program that act as an expertise to analyse and assist problems, the program has a specific expertness [29] such as to diagnose mental health disorder [30], [31] or to discover a knowledge [32]. Expert system is one of artificial intelligence branch that aim to understand the expertise knowledge and build the computer program from it. This knowledge is transforming into rule-based and used while generate inference or reasoning. Previous research [27] focusing on how to generate decision from respondent tends, but this research focusing on how to transform expertise knowledge in Table 1 to inference of Expert System (ES), while all the data input are dynamic from smart phone as shown in Figure 2a .
(a)
Politicians
5
(b)
Figure 2. (a) Architecture W.a.W; (b) Forward Chaining W.a.W
W.a.W Expert System are using forward chaining, it starts from a set of condition (in this case, condition is rule that has been transform into questions) and generate conclusions according to answer for each conditions. Each of rules will ask and all the answers computes and at the end average value of answer and all the answers are recorded, as shown in Figure 2b. They are recorded at relational database.
3.3.1. Generate Rule-Based
Rule-based are specific factor as a measurement of social perception to government, this rules are divided into nine, which is explain below in detail:
Rule 1: IF “Government related with Infrastructure Growth and Politics” Rule 2: IF “Government related with Infrastructure Growth and Economics” Rule 3: IF “Government relatedwith Infrastructure Growth and Regulation” Rule 4: IF “Government related with Public Services Quality and Politics” Rule 5: IF “Government related with Public Services Quality and Economics” Rule 6: IF “Government related with Public Services Quality andRegulation” Rule 4: IF “Government related with Financial Transparency and Politics” Rule 5: IF “Government related with Financial Transparency and Economics” Rule 6: IF “Government related with Financial Transparency and Regulation”
Rules are displayed in several questions in expert system. Questions are accessed using smart phone by respondent. Respondent must be answered between 1 to 4 for each question, 1 is very negative and 4 is very positive.
3.3.2. Generate Reasoning (Inference)
6
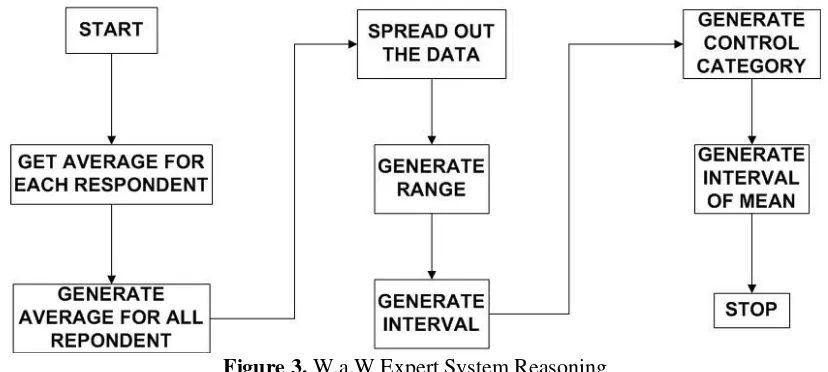
Figure 3. W.a.W Expert System Reasoning
W.a.W Expert System’s Reasoning starts with getting the average data for each respondent, this average calculates with
X
i= ∑ A
𝑛1 1+⋯+A
n(1)
.
‘A’ is answered for each question. Next step is generating average all the respondent using formula X̅ = ∑𝑛𝑖=0X1+ ⋯ + Xn (2). While ‘X’ is average value from each respondent in (1). To get the amount of respondent diversity this researchuses formula of standard deviation 𝑠 = √∑(Χ𝑖−Χ̅)2
𝑛 (3). Value of ‘Χ𝑖’ comes from (1) and ‘Χ̅’ comes from (2). Table 2 describe sample data from respondents. There are 10 respondents that answer each rule, from rule number 1 until 10.
Table 2. Sample Data from Respondents
Rule Χ𝑖 Χ𝑖− Χ̅
Sample 1 2 3 4 5 6 7 8 9
1 3 4 4 4 3 4 4 4 3.6 1
2 3 3 3 3 3 3 4 3 3 3.1 0.25
3 4 4 3 3 3 4 3 3 3 3.3 0.49
4 2 2 3 3 2 3 2 2 2 2.3 0.09
5 2 3 2 3 3 3 2 2 2 2.4 0.04
6 3 3 3 3 3 3 3 3 3 3 0.16
7 1 1 1 1 1 1 1 1 2 1.1 2.25
8 3 2 3 2 2 3 3 2 2 2.4 0.04
9 2 2 2 2 2 2 2 2 2 2 0.36
10 3 3 3 2 2 3 3 3 3 2.8 0.04
Inference generates average value of answer for each respondent using (1), and label as yellow in Table 2. The average for all the respondent data is formulated by (2), and by using data in Table 2 will simulate as below:
Χ̅ = 3.6 + 3.1 + 3.3 + 2.3 + 2.4 + 3 + 1.1 + 2.4 + 2 + 2.8 Χ̅ = 2.6
7
𝑠 = √0.45 + 0.25 + 0.49 + 0.09 + 0.04 + 0.16 + 2.25 + 0.04 + 0.36 + 0.04 10
𝑠 = 0.69
Next step Inference will generate control value, but Inference needs to generate each factor of control value namely ‘range’ and ‘interval’. This control value helps to make a standard value for each category in (5). Inference generates ‘range’ value by subtracting the maximum and minimum value of
Χ𝑖, to get the ‘range’ value is following the formula 𝑅𝑎𝑛𝑔𝑒 = Χ𝑖 𝑚𝑎𝑥− Χ𝑖 𝑚𝑖𝑛 (4). The calculation by using data above as below:
𝑅𝑎𝑛𝑔𝑒 = 3.6 − 1.1 𝑅𝑎𝑛𝑔𝑒 = 2.5
After calculating ‘range’, ‘interval’ generates by using this formula 𝑖𝑛𝑡𝑒𝑟𝑣𝑎𝑙 = Σ 𝑅𝑎𝑛𝑔𝑒
𝑐𝑎𝑡𝑒𝑔𝑜𝑟𝑦 5). By using (5) according to data before, Inference generates the ‘interval’ as below:
𝐼𝑛𝑡𝑒𝑟𝑣𝑎𝑙 = 2.54 𝐼𝑛𝑡𝑒𝑟𝑣𝑎𝑙 = 0.51 𝐼𝑛𝑡𝑒𝑟𝑣𝑎𝑙 = 1
Category at (5) is number of choices for questions. Inference generates control value by using
𝐼𝑛𝑡𝑒𝑟𝑣𝑎𝑙 ∗ 𝐶𝑎𝑡𝑒𝑔𝑜𝑟𝑦 ≥ 𝑅𝑎𝑛𝑔𝑒 + 1 (6). If it is true and (𝐼𝑛𝑡𝑒𝑟𝑣𝑎𝑙 ∗ 𝐶𝑎𝑡𝑒𝑔𝑜𝑟𝑦) − 𝑅𝑎𝑛𝑔𝑒 + 1 =
2 than first category (in this case is 1, that indicate very negative) is Χ𝑖 𝑚𝑖𝑛− 1 and last category (in this case is 4, that indicate very positive) is Χ𝑖 𝑚𝑎𝑥+ 1. If it is true and (𝐼𝑛𝑡𝑒𝑟𝑣𝑎𝑙 ∗ 𝐶𝑎𝑡𝑒𝑔𝑜𝑟𝑦) −
𝑅𝑎𝑛𝑔𝑒 + 1 = 3 than first category (in this case is 1, that indicate very negative) is Χ𝑖 𝑚𝑖𝑛− 1 and last category (in this case is 4, that indicate very positive) is Χ𝑖 𝑚𝑎𝑥+ 2. If it is true and (𝐼𝑛𝑡𝑒𝑟𝑣𝑎𝑙 ∗
𝐶𝑎𝑡𝑒𝑔𝑜𝑟𝑦) = 𝑅𝑎𝑛𝑔𝑒 + 1 than first category (in this case is 1, that indicate very negative) is Χ𝑖 𝑚𝑖𝑛 and last category (in this case is 4, that indicate very positive) is Χ𝑖 𝑚𝑎𝑥. From the data above, standard value for each category as below:
𝐼𝑛𝑡𝑒𝑟𝑣𝑎𝑙 ∗ 𝑐𝑎𝑡𝑒𝑔𝑜𝑟𝑦 ≥ 𝑅𝑎𝑛𝑔𝑒 + 1 1 ∗ 4 ≥ 2.5 + 1
1 (𝑣𝑒𝑟𝑦 𝑛𝑒𝑔𝑎𝑡𝑖𝑣𝑒) ∶ 1.1 − 1.9 2 (𝑛𝑒𝑔𝑎𝑡𝑖𝑣𝑒) ∶ 1.9,5 − 2.75 3 (𝑝𝑜𝑠𝑖𝑡𝑖𝑣𝑒) ∶ 2.8 − 3.55
4 (𝑣𝑒𝑟𝑦 𝑝𝑜𝑠𝑖𝑡𝑖𝑣𝑒) ∶ 3.6 − 4.45
Final Inference calculation is generating the current social perception to government according to data in Table 2. This perception value is following this formula Χ̅ − 𝑡𝑝 𝑠
√𝑛 < µ < Χ̅ + 𝑡𝑝 𝑠
√𝑛 (7). While 𝑡𝑝is the value from ‘t Table’ where 𝑑𝑓 = 𝑛 − 1. By using data we can get range for social perception as below:
2.6 − (2.262 ∗ (0.69
8
2.6 − (2.262 ∗ (0.693.16)) < 𝜇 < 2.6 + (2.262 ∗ (0.693.16))
2.6 − (2.262 ∗ 0.22) < 𝜇 < 2.6 + (2.262 ∗ 0.22)
2.6 − 0.5 < 𝜇 < 2.6 + 0.5
2.1 < 𝜇 < 3.1
To generate the conclusion, Expert System Inference is mapping value 𝜇 at (7) into category standard value and decided this value is in which category, for this case the social perception is in third category (positive).
Expert System uses this formulation to generate dynamic standard value for each category and current social perception. This value will change dynamically according to the newest input from customer. By using this Expert System social perception to government is valid.
4.Conclusions and Recommendation
Expert System is a full power computer program to mimic knowledge skills to summarize conclusions. This knowledge then turns into useful conclusions in decision making. The rules for social perception produce nine rules, each rule has four categories of answers 1 (very negative), 2 (negative), 3 (positive), and 4 (very positive). An arrangement is approximated by probabilistic to ensure each valid value matches the current data, this inference can result in a tendency for a condition of social perception dynamically.
Through expert systems, communities respond as their perceptions of government performance over time. Automatically the system built in the W.a.W apps will generate any incoming information and provide conclusions and types of social interventions that should be implemented by the government. Any addition of a community response will alter the fluctuating and dynamic conclusions that give the consequences of the current state. Up to date conclusions will help the government in responding rapidly to the phenomena that occur in the community. With this pattern, W.a.W application becomes a smart system in implementing new policies to prevent unhealthy practices affecting government performance in Indonesia.
References
[1]
Sasmoko, Widhoyoko S A, Ariyanto S, Indrianti Y, Noerlina, Muqsith A M and
Alamsyah M 2017 Corruption Early Prevention: Decision Support System for
President of the Republic of Indonesia J Phys Conf Ser
801
pp 1
–
8.
[2]
Feruza S and Kim T H 2007 IT Security Review: Privacy, Protection, Access Control,
Assurance and System Security Int. J. Multimed Ubiquitous Eng.
2
pp 17
–
32.
[3]
Scott J and Carrington P J 2011 Crime and Social Network Analysis Sage Handb. Soc.
Netw. Anal. pp 236
–
255.
[4]
Lookman S and Nurcan S 2015 A Framework for Occupational Fraud Detection by
Social Network Analysis CEUR Workshop Proc
1367
pp 221
–
228.
[5]
Association of Certified Faud Examiners 2016 Report to Nations.
[6]
Qadir S and Quadri S M K 2016
Information Availability : An Insight into the Most
Important Attribute of Information Security J. Inf. Secur.
7
pp 185
–
194.
[7]
Sridhar S and Manimaran G 2010 Data Integrity Attacks and Their Impacts on SCADA
9
[8]
Houck M M, Kranacher MJ, Morris B, Riley R A Jr, Robertson J and Wells J T 2006
Forensic Accounting as an Investigative Tool CPA J.
76
pp 68
–
70.
[9]
Pedneault S, Silverstone H, Rudewicz F and Sheetz M 2012 Forensic Accounting and
Fraud Investigation for Non-Experts (USA: Wiley)
[10]
Alexander R 2004 The Role of Whistleblower in the Fight Against Economic Crime, J.
Financ. Crime
12
pp 131
–
138.
[11]
Wells J T 2003 There is an Art on Conducting Interview J. Account.
[12]
Schuman H and Presser S 1979 The Open and Closed Question Am Sociol Rev
44
pp 692
–
712.
[13]
Ord B, Shaw G and Green T 2011 Investigative Interviewing Explained 3rd ed.
(Australia: LexisNexis).
[14]
Dohrenwend B 1965
Some Effects of Open and Closed Questions on Respondents’
Answers Human Organization
24
pp 175
–
184.
[15]
Conway J M and Peneno G M 1999 Comparing Structured Interview Question Types:
Construct Validity and Applicant Reactions J. Bus. Psychol.
13
pp 485
–
506.
[16]
Song X and Cheng W 2012 Perception of Corruption in 36 Major Chinese Cities: Based
on Survey of 1,642 Experts Soc. Indic. Res.
109
pp 211
–
221.
[17]
Andersson S and Heywood P M 2009 The Politics of Perception: Use and Abuse of
Transparency I
nternational’s
Approach to Measuring Corruption Polit. Stud.
57
pp 746
–
767.
[18]
Linstone H A and Turoff M 2002 The Delphi Method Techniques and Applications
(London: Addison-Wesley Publishing Company).
[19]
Pawlowski S D and Okoli C 2004
The Delphi Method as a Research Tool : An Example
, Design Considerations and Applications Inf. Manag.
42
pp 15
–
29.
[20]
Verwey I G F, Universiteit N B and Asare S K 2016 The Effect of Forensic Expertise
and Time Pressure on Fraud Risk Assessment and Responsiveness AAA Forensic
Account Res. Conf. pp 1
–
30.
[21]
Olken B A 2009 Corruption Perceptions vs Corruption Reality J. Public Econ.
93
pp 950
–
964.
[22]
Robertson-Snape F 1999 Corruption, Collusion and Nepotism in Indonesia Third World
Q
20
pp 589
–
602.
[23]
Mietzner M 2007 Party Financing in Post-Soeharto Indonesia: Between State Subsidies
and Political Corruption Contemp Southeast Asia
29
pp 238
–
263.
[24]
Freie J F 2012 Postmodern Politics in America Society
49
pp 323
–
327.
[25]
Ernstson H, Sörlin S and Elmqvist T 2008 Social Movements and Ecosystem Services -
The Role of Social Network Structure in Protecting and Managing Urban Green
Areas in Stockholm Ecol Soc
13
pp 38
–
48.
[26]
Stanfield A 2009 Computer Forensics, Electronic Discovery, and Electronic Evidence
1st Ed. (LexisNexis).
[27]
Sasmoko, Widhoyoko S A, Ariyanto S, Indrianti Y, Noerlina, Muqsith A M and Alamsyah M 2017 Corruption Early Prevention: Decision Support System for President of the Republic of Indonesia J. of Physics: Conf. Series 801.[28]
Adams G 1981 The Politics of Defense Contracting (New York: Council on Economic
Priorities)
[29]
R S Design, Fundamentals of Expert System, pp 1
–
26, 1987
[30]
Singh P K and Sarkar R 2015 A Simple and Effective Expert System for Schizophrenia
10
[31]
Manalu S R, Abbas B S and Gaol F L 2017 An Expert System to Assist with Early
Detection of Schizophrenia Intell. Inf. Database Syst.
10191
pp 802
–
812.
[32]
Abouelhoda M and Ghanem M 2010 Scientific Data Mining and Knowledge Discovery