Identification of Markers Associated with Birth Weight in Boer Goat
Jamli S, Shanmugavelu S
Animal Science Research Centre, Malaysian Agricultural Research and Development Institute (MARDI) MARDI H, Persiaran MARDI-UPM, Serdang 43400, Selangor, Malaysia
ABSTRACT
Genetic improvement of breeding depends on selective breeding of superior phenotypes. In order to increase accuracy of breeding and selection for efficient production systems, current trend is towards applying molecular markers. The purpose of the study was to identify markers associated with birth weight in Boer goats using 50k single nucleotide polymorphism (SNP) chip. A total of 657 Boer goats were selected based on the availability of birth weight data from a commercial farm. Individuals were genotyped using 50k SNP chip from Illumina using Illumina Genome Analyzer IIx. A genome wide association analysis using a mixed model was carried out and resulted in 32 detected markers for birth weight. In previous genotyping study done on the same population of goat using 20k custom-designed SNP chip resulted in 14 markers for birth weight. However, markers identified should be verified in an independent population before being applied in a Marker Assisted Selection (MAS) program. Further consideration should be on socio-economic factors as well as their sustainability in biodiverse environments.
Key Words: Molecular Markers, 50k SNP Chip, Boer Goat
INTRODUCTION
Genetic improvement of breeding depends on selective breeding of superior
phenotypes. In order to increase accuracy of breeding and selection for efficient production
systems, current trends is towards applying molecular markers. Molecular markers have
been explored to evaluate the livestock performance for the purpose of genetic
improvement (Montaldo & Meza-Herrera 1998; Dekkers 2004) as well for genetic
diversity (Groeneveld 2010).
Currently, SNP panel are widely used to identify markers for various traits in livestock
such as body weight (Esmailizadeh 2014; Jung et al. 2014; Somavilla 2014), reproductive
(Tart et al. 2013; Sasaki et al. 2015; Farah et al. 2016; Ortega et al. 2016) and carcass traits
(Onogi et al. 2015; Skok et al. 2016). SNP panel are also used in genetic diversity studies
(Nicoloso et al. 2015; Manunza et al. 2016; Visser et al. 2016).
MATERIAL AND METHODS
Biological samples and genotyping
A total of 657 Boer goats were selected based on the availability of birth weight data
from a commercial farm at Negeri Sembilan, Malaysia. The parental stock of these Boer
goats were imported from Australia.
DNA samples were extracted using a Promega Wizard Genomic DNA Purification
System. Individuals were genotyped using the Goat SNP50 Beadchip (Illumina Inc., San
Diego, CA) developed by the International Goat Genome Consortium (Tosser-Klopp et al.
2014). Genotyping was done at DNA Landmarks Inc. using Illumina Genome Analyzer IIx.
Whole genome association (WGA) and SNP Selection
To maximize the information from 50k genotyping, the samples with low call rate (<90%) and without phenotype data were excluded. Samples with the pedigree information were included in the 50k typing.
To select a panel of significant SNPs, those SNPs were selected based on their own p-value but also the P-p-value of the nearby SNPs. The regions that showed multiple SNPs with significant association were considered as promising regions.The most significant SNP was selected from such peaks. The minimum P-value is set as P<0.01 for SNP selection.
The statistical analysis was performed using ASREML by 2-step Mixed model
(Aulchenko et al. 2007). The model for the body weight was: BW = Sex + Type of birth +
Polygenic effect and SNP effect. In order to estimate polygenic effect, the relationship
matrix was calculated using genotypes rather than pedigree due to some pedigree errors in
the dataset. Sex and type of birth were estimated as fixed effects for birth weight. SNPs were
selected based on the P-value of individuals SNPs as well as P-value of the nearby SNPs.
RESULTS AND DISCUSSION
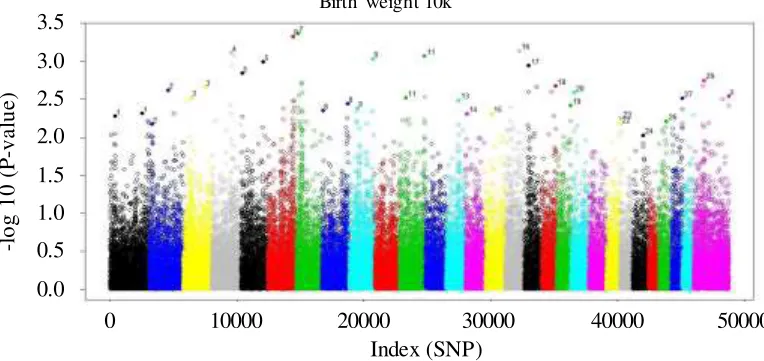
Chromosomes and SNPs position from this study are shown on Manhattan plots in
Figure 1.
Different colors in the figures are used to separate different chromosome based on cattle genome. The position is also based on cattle chromosome. Each dot in the figure means a SNP. The SNP with high –log10 (P-value) indicate higher association with the trait. The – log10 (P-value) = 3 is equivalent to P= 0.001.Figure 1. Manhattan plots of SNP associated with birth weight using 50k SNP chip
0 10000 20000 30000 40000 50000
Birth weight 10k
Index (SNP)
-l
o
g
1
0
(P
-v
a
lu
e
)
3.5
3.0
2.5
2.0
1.5
1.0
0.5
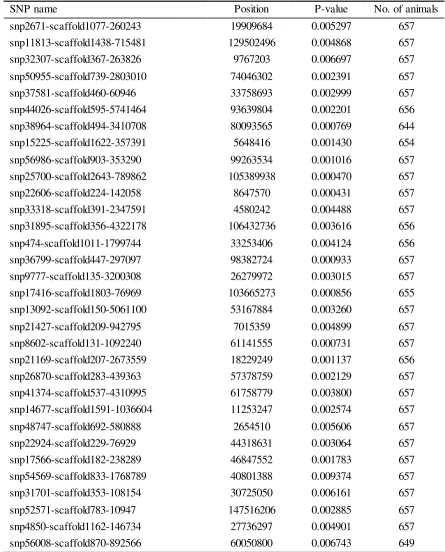
The P-value for SNPs selected is shown in Table 1. The minimum P-value considered
for SNPs selection in this study was P<0.01. The study identified 32 markers associated
with birth weight from the Boer goat population (Table 1).
Table 1. Description of SNPs associated with birth weight in Boer goats
SNP name Position P-value No. of animals
snp2671-scaffold1077-260243 19909684 0.005297 657
snp11813-scaffold1438-715481 129502496 0.004868 657
snp32307-scaffold367-263826 9767203 0.006697 657
snp50955-scaffold739-2803010 74046302 0.002391 657
snp37581-scaffold460-60946 33758693 0.002999 657
snp44026-scaffold595-5741464 93639804 0.002201 656
snp38964-scaffold494-3410708 80093565 0.000769 644
snp15225-scaffold1622-357391 5648416 0.001430 654
snp56986-scaffold903-353290 99263534 0.001016 657
snp25700-scaffold2643-789862 105389938 0.000470 657
snp22606-scaffold224-142058 8647570 0.000431 657
snp33318-scaffold391-2347591 4580242 0.004488 657
snp31895-scaffold356-4322178 106432736 0.003616 656
snp474-scaffold1011-1799744 33253406 0.004124 656
snp36799-scaffold447-297097 98382724 0.000933 657
snp9777-scaffold135-3200308 26279972 0.003015 657
snp17416-scaffold1803-76969 103665273 0.000856 655
snp13092-scaffold150-5061100 53167884 0.003260 657
snp21427-scaffold209-942795 7015359 0.004899 657
snp8602-scaffold131-1092240 61141555 0.000731 657
snp21169-scaffold207-2673559 18229249 0.001137 656
snp26870-scaffold283-439363 57378759 0.002129 657
snp41374-scaffold537-4310995 61758779 0.003800 657
snp14677-scaffold1591-1036604 11253247 0.002574 657
snp48747-scaffold692-580888 2654510 0.005606 657
snp22924-scaffold229-76929 44318631 0.003064 657
snp17566-scaffold182-238289 46847552 0.001783 657
snp54569-scaffold833-1768789 40801388 0.009374 657
snp31701-scaffold353-108154 30725050 0.006161 657
snp52571-scaffold783-10947 147516206 0.002885 657
snp4850-scaffold1162-146734 27736297 0.004901 657
snp56008-scaffold870-892566 60050800 0.006743 649
Discussion
custom-designed SNP chip resulted in 14 markers for birth weight (Saadiah et al. 2014).
The chromosomal regions of SNPs selected from 20k do not completely overlapped with the ones selected from 50k. This indicate the challenges in identifying markers that control traits. Various factors have to be taken into consideration in order for the markers to be accurately utilised in breeding programme. In a study done by Brito et al. (2015) on characterization of linkage disequilibrium indicate that genome selection could be implemented within breed for a large training population but some breeds will require a denser panel. Multi-breed genomic evaluation require a denser panel as well (Brito et al. 2015).Application of these markers in a biodiversed environment and geographical location requires further consideration as several studies indicate huge genetic diversity within different goat population and geography. Different pattern of diversity displayed in different goat population such as genetic drift in Spanish (Manunza et al. 2016) and Italian goats (Nicoloso et al. 2015); lack of gene flow (Nicoloso et al. 2015) and admixture with other goat breed (Manunza et al. 2016; Visser et al. 2016). Geographical locations cause genetic distiction between the population. Furthermore, for purebred population, inbreeding depression have impact on economic income of breeders (Leroy 2014). It is expected that the genetic background will affect different pattern of genome wide association of various traits.
CONCLUSION
The results give more insight into the trait of interest for breeding animals. More
denser SNP panel such as 50k chip resulted to more markers generated as compared to less
dense SNP panel. The study contribute to the understanding of genomic variability in
relation to the birth weight in locally adapted Boer goat. However, markers identified
should be verified in an independent population before application in a Marker Assisted
Selection program (MAS) program. Further consideration should also be given to
socio-economic factors as well as sustainability in a biodiverse environment.
REFERENCES
Aulchenko YS, De Koning DJ, Haley C. 2007. Genome wide rapid association using mixed model and regression: A fast and simple method for genome wide pedigree-based quantitative trait loci association analysis. Genetics. 177:577-585.
Brito LF, Jafarikia M, Grossi DA, Kijas JW, Porto-Neto LR, Ventura RV, Salgorzaei M, Chenkel FS. 2015. Characterization of linkage disequilibrium, consistency of gametic phase and admixture in Australian and Canadian goats. BMC Genetics. DOI: 10.1186/s12863-015-0220-1.
Dekkers JCM. 2004. Commercial application of marker- and gene-assisted selection in livestock: Strategies and lessons. J Anim Sci. 82(E Suppl.):E313-E328.
Esmailizadeh AK. 2014. Genome-scan analysis for genetic mapping of quantitative trait loci underlying birth weight and onset of puberty in doe kids (Capra hircus) Anim Genet. 45:849-854.
Farah MM, Swan AA, Fortes MRS, Fonseca R, Moore SS, Kelly MJ. 2016. Accuracy of genomic selection for age at puberty in a multi-breed population of tropically adapted beef cattle. Anim Genet. 47:3-11.
Greenwood PL, Hunt AS, Hermanson JW, Bell AW. 1998. Effects of birth weight and postnatal nutrition on neonatal sheep: I. Body growth and composition, and some aspects of energetic efficiency. J Anim Sci. 76:2354-2367.
Jung EJ, Park HB, Lee JB, Yoo CK, Kim BM, Kim HI, Kim BW, Lim HT. 2014. Genome-wide association analysis identifies quantitative trait loci for growth in a Landrace purebred population. Anim Genet. 45:442-444.
Leroy G. 2014. Inbreeding depression in livestock species: review and meta-analysis. Anim Genet. 45:618-628.
Manunza A, Noce A, Serradilla JM, Goyache F, Martínez A, Capote J, Delgado JV, Jordana J, Muñoz E, Molina A, Landi V, Pons A, Balteanu V, Traoré A, Vidilla M, Rodriguez MS, Sànchez A, Cardoso TF, Amills M. 2016. A genome-wide perspective about the diversity and demographic history of seven Spanish goat breeds. Genet Sel Evol. 48:52.
Morel PCH, Morris ST, Kenyon PR. 2008. Effect of birth weight on survival in triplet-born lambs. Aust J Exp Agric. 48:984-987.
Nicoloso L, Bomba L, Colli L, Negrini R, Milanesi M, Mazza R, Sechi T, Frattini S, Talenti A, Coizet B, Chessa S, Marletta D, D’Andrea M, Bordonaro S, Ptak G, Carta A, Pagnacco G, Valentini A, Pilla F, Ajmone-Marsan P, Crepaldi P. 2015. Genetic diversity of Italian goat breeds assessed with a medium-density SNP chip. The Italian Goat Consortium. Genet Select Evol. 47:62.
Montaldo HH, Meza-Herrera CA. 1998. Use of molecular markers and major genes in the genetic improvement of livestock. J Biotechnol. 1:1-9.
Onogi A, Ogino A, Komatsu T, Shoji N, Shimizu K, Kurogi K, Yasumori T, Togashi K, Iwata H. 2015. Whole-genome prediction of fatty acid composition in meat of Japanese Black cattle. Anim Genet. 46:557-559.
Ortega MS, Denicol AC, Cole JB, Null DJ, Hansen PJ. 2016. Use of single nucleotide polymorphisms in candidate genes associated with daughter pregnancy rate for rediction of genetic merit for reproduction in Holstein cows. Anim Genet. 47:288-297.
Saadiah J, Johari JA, Tun-Ping Y, Nadaf J, Hifzan RM, Ernie-Muneerah MA, Khairun Hisam N, Rabiatul-Adawiyah ZA, Umi-Kalsom AB. 2014. A genome wide association study for birth weight in boer goats using a 20k single nucleotide polymorphism chip. MJVR. 5:305-307.
Sasaki S, Ibi T, Kojima T, Sugimoto Y. 2015. A genome-wide association study reveals a quantitative trait locus for days open on chromosome 2 in Japanese Black Cattle. Anim Genet. 47:102-105.
Skok DJ, Kunej T, Kovac M, Malovrh S, Potocnik K, Petric N, Zgur S, Dovc P, Horvat S. 2016. FTO gene variants are associated with growth and carcass traits in cattle . Anim Genet. 47:219-222.
Somavilla AL, Sonstegard TS, Higa RH, Rosa AN, Siqueira F, Silva LOC, Torres Junior RAA, Coutinho LL, Mudadu MA, Alencar MM, Regitano LCA. 2014. A genome-wide scan for selection signatures in Nellore cattle. Anim Genet. 45:771-781.
Tart JK, Johnson RK, Bundy JW, Ferdinand NN, McKnite AM, Wood JR, Miller PS, Rothschild MF, Spangler ML, Garrick DJ, Kachman SD, Ciobanu DC. 2013. Genome-wide prediction of age at puberty and reproductive longevity in sows. Anim Genet. 44:387-397.
Tosser-Klopp G, Bardou P, Bouchez O, Cabau C, Crooijmans R, Dong Y, Donnadieu-Tonon C, Eggen A, Heuven HCM, Jamli S, Jiken AJ, Klopp C, Lawley CT, McEwan J, Martin P, Moreno CR, Mulsant P, Nabihoudine I, Pailhoux E, Palhie`re I, Rupp R, Sarry J, Sayre BL, Tircazes A, Wang J, Wang W, Zhang W. 2014. Design and Characterization of a 52K SNP Chip for Goats. The International Goat Genome Consortium. PLoS One. 9:e86227.