Lampiran 1: Kuesioner
KUESIONER IDENTITAS :
1. Nama : 2. Masa Kerja :
Cara mengisi kuesioner :
1. Jawablah pernyataan-pernyataan berikut secara teliti dengan cara memilih salah satu jawaban yang saudara anggap paling benar
2. Jawaban dipilih dengan cara memberi tanda silang (X) pada kelima alternatif jawaban
Keterangan :
STS : sangat tidak setuju TS : tidak setuju
S : setuju SS : sangat setuju
3. Apabila terdapat jawaban yang salah, saudara dapat memperbaiki dengan cara memberi coretan pada tanda silang (X) dan selanjutnya menyilang angka yang menurut saudara paling tepat.
Terima kasih atas kesediaan saudara untuk mengisi kuesioner ini Kuesioner Tentang Kompensasi
No Pertanyaan
X
1= Kompensasi Financial
X1.1 Imbalan yang Anda terima sesuai dengan pekerjaan yang Anda lakukan
STS TS S SS
X1.2 Tunjangan yang diberikan di luar gaji pokok mencukupi kebutuhan Anda
STS TS S SS
X1.3 Upah yang Anda terima tepat waktu STS TS S SS
X1.4 Upah yang Anda terima sesuai dengan pendidikan STS TS S SS X1.5 Pemberian program asuransi tenaga kerja
(jamsostek) untuk karyawan sesuai
STS TS S SS
X1.6 Pembayaran biaya sakit (berobat) ditanggung perusahaan
STS TS S SS
X
2= Kompensasi Non Financial
X2.1 Pekerjaan yang dilakukan memberikan kesempatan menggunakan ketrampilan yang dimiliki
STS TS S SS
X2.2 Pengakuan dari atasan terhadap hasil kerja yang telah dicapai
STS TS S SS
X2.3 Pekerjaan ini menuntut keahlian yang tinggi STS TS S SS X2.4 Fasilitas yang disediakan oleh organisasi memadai
(tempat ibadah, loker, kamar mandi, dll)
STS TS S SS
X2.5 Banyak relasi baru yang didapatkan di tempat Anda bekerja sekarang
STS TS S SS
X2.6 Rekan sekerja Anda senang menolong STS TS S SS
Kuesioner Tentang Kinerja Karyawan
No Pertanyaan
KK1 Hasil kerja yang telah Anda lakukan sesuai dengan standar kualitas perusahaan
STS TS S SS
KK2 Jumlah produksi yang Anda hasilkan memenuhi target perusahaan
STS TS S SS
KK3 Pekerjaan dapat Anda selesaikan tepat waktu STS TS S SS KK4 Pemakaian bahan baku untuk produksi digunakan
secara hemat
STS TS S SS
KK5 Penyertaan supervisor dalam pelaksanaan pekerjaan sangat diperlukan
STS TS S SS
KK6 Ada kerjasama yang baik antar karyawan didalam perusahaan Anda bekerja
STS TS S SS
49
HASIL TANGGAPAN RESPONDEN MENGENAI KOMPENSASI DAN KINERJA KARYAWAN BAGIAN PENJUALAN PADA UD. KAROSERI GAJAH MADA DI SURABAYA
No. PERNYATAAN
Resp. X1.1 X1.2 X1.3 X1.4 X1.5 X1.6 X1 X2.1 X2.2 X2.3 X2.4 X2.5 X2.6 X2 Y1 Y2 Y3 Y4 Y5 Y6 Y
1 4 4 4 3 4 4 3.83 4 4 4 4 3 4 3.83 3 4 4 4 4 4 3.83
2 3 4 4 3 4 4 3.67 4 4 4 4 4 4 4.00 3 4 4 4 4 4 3.83
3 2 4 4 3 4 2 3.17 2 3 1 2 2 2 2.00 4 4 3 3 3 4 3.50
4 2 2 4 2 4 1 2.50 2 2 3 3 2 4 2.67 4 3 4 4 4 3 3.67
5 3 4 4 4 4 4 3.83 4 4 4 2 4 2 3.33 4 3 4 4 4 4 3.83
6 2 4 4 2 4 1 2.83 4 4 2 4 3 4 3.50 4 4 4 4 4 4 4.00
7 2 2 2 2 3 2 2.17 4 4 4 3 3 2 3.33 3 3 3 4 3 3 3.17
8 4 4 4 3 4 3 3.67 3 3 4 3 4 4 3.50 2 2 2 2 2 3 2.17
9 3 4 4 2 2 3 3.00 3 4 4 4 4 4 3.83 4 2 2 4 3 4 3.17
10 2 2 3 2 3 2 2.33 3 4 2 3 4 2 3.00 3 4 2 3 3 4 3.17
11 2 2 2 1 2 1 1.67 4 4 2 2 4 4 3.33 2 3 4 4 4 1 3.00
12 2 3 3 2 4 2 2.67 2 4 2 4 2 2 2.67 3 2 3 3 3 3 2.83
13 3 4 4 3 4 2 3.33 4 3 4 4 4 3 3.67 3 2 3 4 3 4 3.17
14 1 2 3 3 2 2 2.17 4 4 2 2 4 3 3.17 3 4 4 3 3 4 3.50
15 2 4 4 2 2 2 2.67 2 4 4 2 4 3 3.17 3 4 3 3 4 4 3.50
16 4 4 4 3 3 2 3.33 3 3 3 3 2 4 3.00 3 2 3 2 2 3 2.50
17 4 2 4 4 4 2 3.33 3 3 4 4 4 4 3.67 2 2 2 2 3 2 2.17
18 4 2 4 4 3 3 3.33 3 4 4 4 2 4 3.50 4 4 4 4 3 4 3.83
19 3 4 4 4 4 3 3.67 4 4 2 3 4 4 3.50 4 4 4 4 4 4 4.00
20 3 4 4 4 2 3 3.33 4 4 2 2 3 4 3.17 4 4 4 4 3 3 3.67
21 4 4 4 4 4 4 4.00 4 4 4 4 3 4 3.83 2 2 3 3 4 1 2.50
22 4 4 4 4 4 4 4.00 4 4 4 4 4 4 4.00 3 4 4 3 3 2 3.17
23 4 4 4 4 4 3 3.83 2 2 2 2 3 2 2.17 4 2 4 3 3 3 3.17
L am pir an 2: D ata P en elit ian
50
244444444.003444343.673334312.83 254343333.333333433.174243323.00 262234443.172413342.834334343.50 274344343.673243222.673233322.67 284434443.833424343.334433323.17 293432312.673333322.834323322.83 304322343.003323222.504334443.67 313334343.333344343.504344433.67 323443433.504344343.674344443.83 333442333.171322242.334243233.00 344343333.333333443.332221322.00 352442343.174412242.834344443.83 Tot/Var107118127105118100####111122104110110118####118105116118115108#### Mn/Var##################3.21##################3.21##################3.24 X1:Kompensasi Financial X2:Kompensasi Non Financial KK:KinerjaLampiran 2: Data Penelitian
Lampiran 3: Frekuensi
Frekuensi Kompensansi Financial
x1.1
1 2.9 2.9 2.9
10 28.6 28.6 31.4
10 28.6 28.6 60.0
14 40.0 40.0 100.0
35 100.0 100.0
Sangat tidak setuju (STS) Tidak setuju (TS)
Setuju (S)
Sangat setuju (SS) Total
Valid Frequency Percent Valid Percent
Cumulative Percent
x1.2
8 22.9 22.9 22.9
6 17.1 17.1 40.0
21 60.0 60.0 100.0
35 100.0 100.0
Tidak setuju (TS) Setuju (S)
Sangat setuju (SS) Total
Valid Frequency Percent Valid Percent Cumulative
Percent
x1.3
3 8.6 8.6 8.6
7 20.0 20.0 28.6
25 71.4 71.4 100.0
35 100.0 100.0
Tidak setuju (TS) Setuju (S)
Sangat setuju (SS) Total
Valid Frequency Percent Valid Percent
Cumulative Percent
x1.4
1 2.9 2.9 2.9
11 31.4 31.4 34.3
10 28.6 28.6 62.9
13 37.1 37.1 100.0
35 100.0 100.0
Sangat tidak setuju (STS) Tidak setuju (TS)
Setuju (S)
Sangat setuju (SS) Total
Valid Frequency Percent Valid Percent Cumulative
Percent
x1.5
5 14.3 14.3 14.3
12 34.3 34.3 48.6
18 51.4 51.4 100.0
35 100.0 100.0
Tidak setuju (TS) Setuju (S)
Sangat setuju (SS) Total
Valid Frequency Percent Valid Percent
Cumulative Percent
x1.6
4 11.4 11.4 11.4
9 25.7 25.7 37.1
10 28.6 28.6 65.7
12 34.3 34.3 100.0
35 100.0 100.0
Sangat tidak setuju (STS) Tidak setuju (TS)
Setuju (S)
Sangat setuju (SS) Total
Valid Frequency Percent Valid Percent Cumulative
Percent
Frekuensi Kompensasi Non Financial
x2.1
1 2.9 2.9 2.9
6 17.1 17.1 20.0
14 40.0 40.0 60.0
14 40.0 40.0 100.0
35 100.0 100.0
Sangat tidak setuju (STS) Tidak setuju (TS)
Setuju (S)
Sangat setuju (SS) Total
Valid Frequency Percent Valid Percent
Cumulative Percent
x2.2
3 8.6 8.6 8.6
12 34.3 34.3 42.9
20 57.1 57.1 100.0
35 100.0 100.0
Tidak setuju (TS) Setuju (S)
Sangat setuju (SS) Total
Valid Frequency Percent Valid Percent Cumulative
Percent
x2.3
3 8.6 8.6 8.6
11 31.4 31.4 40.0
5 14.3 14.3 54.3
16 45.7 45.7 100.0
35 100.0 100.0
Sangat tidak setuju (STS) Tidak setuju (TS)
Setuju (S)
Sangat setuju (SS) Total
Valid Frequency Percent Valid Percent
Cumulative Percent
Lampiran 3: Frekuensi (sambungan)
x2.4
9 25.7 25.7 25.7
12 34.3 34.3 60.0
14 40.0 40.0 100.0
35 100.0 100.0
Tidak setuju (TS) Setuju (S)
Sangat setuju (SS) Total
Valid Frequency Percent Valid Percent Cumulative
Percent
x2.5
9 25.7 25.7 25.7
12 34.3 34.3 60.0
14 40.0 40.0 100.0
35 100.0 100.0
Tidak setuju (TS) Setuju (S)
Sangat setuju (SS) Total
Valid Frequency Percent Valid Percent
Cumulative Percent
x2.6
9 25.7 25.7 25.7
4 11.4 11.4 37.1
22 62.9 62.9 100.0
35 100.0 100.0
Tidak setuju (TS) Setuju (S)
Sangat setuju (SS) Total
Valid Frequency Percent Valid Percent
Cumulative Percent
Frekuensi Kinerja
y1
5 14.3 14.3 14.3
12 34.3 34.3 48.6
18 51.4 51.4 100.0
35 100.0 100.0
Tidak setuju (TS) Setuju (S)
Sangat setuju (SS) Total
Valid Frequency Percent Valid Percent
Cumulative Percent
y2
12 34.3 34.3 34.3
11 31.4 31.4 65.7
12 34.3 34.3 100.0
35 100.0 100.0
Tidak setuju (TS) Setuju (S)
Sangat setuju (SS) Total
Valid Frequency Percent Valid Percent Cumulative
Percent
y3
6 17.1 17.1 17.1
12 34.3 34.3 51.4
17 48.6 48.6 100.0
35 100.0 100.0
Tidak setuju (TS) Setuju (S)
Sangat setuju (SS) Total
Valid Frequency Percent Valid Percent Cumulative
Percent
y4
1 2.9 2.9 2.9
3 8.6 8.6 11.4
13 37.1 37.1 48.6
18 51.4 51.4 100.0
35 100.0 100.0
Sangat tidak setuju (STS) Tidak setuju (TS)
Setuju (S)
Sangat setuju (SS) Total
Valid Frequency Percent Valid Percent
Cumulative Percent
y5
3 8.6 8.6 8.6
19 54.3 54.3 62.9
13 37.1 37.1 100.0
35 100.0 100.0
Tidak setuju (TS) Setuju (S)
Sangat setuju (SS) Total
Valid Frequency Percent Valid Percent
Cumulative Percent
y6
3 8.6 8.6 8.6
7 20.0 20.0 28.6
9 25.7 25.7 54.3
16 45.7 45.7 100.0
35 100.0 100.0
Sangat tidak setuju (STS) Tidak setuju (TS)
Setuju (S)
Sangat setuju (SS) Total
Valid Frequency Percent Valid Percent Cumulative
Percent
Lampiran 4: Validitas
Validitas Kinerja
Correlations
1 .690** .691** .687** .805** .614** .678**
.000 .000 .000 .000 .000 .000
35 35 35 35 35 35 35
.690** 1 .287 .420* .531** .148 .473**
.000 .094 .012 .001 .396 .004
35 35 35 35 35 35 35
.691** .287 1 .369* .409* .394* .381*
.000 .094 .029 .015 .019 .024
35 35 35 35 35 35 35
.687** .420* .369* 1 .550** .428* .194
.000 .012 .029 .001 .010 .264
35 35 35 35 35 35 35
.805** .531** .409* .550** 1 .570** .373*
.000 .001 .015 .001 .000 .027
35 35 35 35 35 35 35
.614** .148 .394* .428* .570** 1 .194
.000 .396 .019 .010 .000 .264
35 35 35 35 35 35 35
.678** .473** .381* .194 .373* .194 1
.000 .004 .024 .264 .027 .264
35 35 35 35 35 35 35
Pearson Correlation Sig. (2-tailed) N
Pearson Correlation Sig. (2-tailed) N
Pearson Correlation Sig. (2-tailed) N
Pearson Correlation Sig. (2-tailed) N
Pearson Correlation Sig. (2-tailed) N
Pearson Correlation Sig. (2-tailed) N
Pearson Correlation Sig. (2-tailed) N
ytotal
y1
y2
y3
y4
y5
y6
ytotal y1 y2 y3 y4 y5 y6
Correlation is significant at the 0.01 level (2-tailed).
**.
Correlation is significant at the 0.05 level (2-tailed).
*.
Validitas Kompensasi Non Financial
Correlations
1 .677** .495** .662** .643** .596** .558**
.000 .003 .000 .000 .000 .001
35 35 35 35 35 35 35
.677** 1 .439** .273 .227 .404* .195
.000 .008 .112 .189 .016 .263
35 35 35 35 35 35 35
.495** .439** 1 -.063 .142 .307 .239
.003 .008 .718 .416 .072 .168
35 35 35 35 35 35 35
.662** .273 -.063 1 .514** .310 .137
.000 .112 .718 .002 .070 .433
35 35 35 35 35 35 35
.643** .227 .142 .514** 1 .058 .337*
.000 .189 .416 .002 .742 .048
35 35 35 35 35 35 35
.596** .404* .307 .310 .058 1 .130
.000 .016 .072 .070 .742 .456
35 35 35 35 35 35 35
.558** .195 .239 .137 .337* .130 1
.001 .263 .168 .433 .048 .456
35 35 35 35 35 35 35
Pearson Correlation Sig. (2-tailed) N
Pearson Correlation Sig. (2-tailed) N
Pearson Correlation Sig. (2-tailed) N
Pearson Correlation Sig. (2-tailed) N
Pearson Correlation Sig. (2-tailed) N
Pearson Correlation Sig. (2-tailed) N
Pearson Correlation Sig. (2-tailed) N
x2total
x2.1
x2.2
x2.3
x2.4
x2.5
x2.6
x2total x2.1 x2.2 x2.3 x2.4 x2.5 x2.6
Correlation is significant at the 0.01 level (2-tailed).
**.
Correlation is significant at the 0.05 level (2-tailed).
*.
Validitas Kompensasi Financial
Correlations
1 .751** .605** .625** .774** .570** .740**
.000 .000 .000 .000 .000 .000
35 35 35 35 35 35 35
.751** 1 .318 .339* .537** .278 .512**
.000 .063 .046 .001 .106 .002
35 35 35 35 35 35 35
.605** .318 1 .531** .154 .247 .299
.000 .063 .001 .378 .153 .081
35 35 35 35 35 35 35
.625** .339* .531** 1 .402* .301 .183
.000 .046 .001 .017 .079 .294
35 35 35 35 35 35 35
.774** .537** .154 .402* 1 .399* .596**
.000 .001 .378 .017 .018 .000
35 35 35 35 35 35 35
.570** .278 .247 .301 .399* 1 .228
.000 .106 .153 .079 .018 .188
35 35 35 35 35 35 35
.740** .512** .299 .183 .596** .228 1
.000 .002 .081 .294 .000 .188
35 35 35 35 35 35 35
Pearson Correlation Sig. (2-tailed) N
Pearson Correlation Sig. (2-tailed) N
Pearson Correlation Sig. (2-tailed) N
Pearson Correlation Sig. (2-tailed) N
Pearson Correlation Sig. (2-tailed) N
Pearson Correlation Sig. (2-tailed) N
Pearson Correlation Sig. (2-tailed) N
x1total
x1.1
x1.2
x1.3
x1.4
x1.5
x1.6
x1total x1.1 x1.2 x1.3 x1.4 x1.5 x1.6
Correlation is significant at the 0.01 level (2-tailed).
**.
Correlation is significant at the 0.05 level (2-tailed).
*.
Lampiran 5: Reliability
Reliability Kompensasi Financial
Case Processing Summary
35 100.0
0 .0
35 100.0
Valid Excludeda Total
Cases N %
Listwise deletion based on all variables in the procedure.
a.
Reliability Statistics
.766 .767 6
Cronbach's Alpha
Cronbach's Alpha Based
on Standardized
Items N of Items
Summary Item Statistics
3.214 2.857 3.629 .771 1.270 .084 6
Item Means Mean Minimum Maximum Range Maximum /
Minimum Variance N of Items The covariance matrix is calculated and used in the analysis.
Item-Total Statistics
16.2286 8.182 .597 .383 .707
15.9143 9.257 .414 .401 .755
15.6571 9.703 .491 .433 .740
16.2857 8.034 .629 .563 .698
15.9143 9.728 .401 .202 .757
16.4286 7.840 .551 .473 .723
x1.1 x1.2 x1.3 x1.4 x1.5 x1.6
Scale Mean if Item Deleted
Scale Variance if Item Deleted
Corrected Item-Total Correlation
Squared Multiple Correlation
Cronbach's Alpha if Item
Deleted
Reliability Kompensasi Non Financial
Case Processing Summary
35 100.0
0 .0
35 100.0
Valid Excludeda Total
Cases N %
Listwise deletion based on all variables in the procedure.
a.
Reliability Statistics
.653 .659 6
Cronbach's Alpha
Cronbach's Alpha Based
on Standardized
Items N of Items
Summary Item Statistics
3.214 2.971 3.486 .514 1.173 .034 6
Item Means Mean Minimum Maximum Range Maximum /
Minimum Variance N of Items
The covariance matrix is calculated and used in the analysis.
Item-Total Statistics
16.1143 6.751 .486 .323 .572
15.8000 7.929 .308 .314 .635
16.3143 6.281 .387 .419 .615
16.1429 6.950 .445 .383 .588
16.1429 7.185 .383 .283 .610
15.9143 7.257 .313 .156 .636
x2.1 x2.2 x2.3 x2.4 x2.5 x2.6
Scale Mean if Item Deleted
Scale Variance if Item Deleted
Corrected Item-Total Correlation
Squared Multiple Correlation
Cronbach's Alpha if Item
Deleted
Lampiran 5: Reliability (sambungan)
Reliability Kinerja
Case Processing Summary
35 100.0
0 .0
35 100.0
Valid Excludeda Total
Cases N %
Listwise deletion based on all variables in the procedure.
a.
Reliability Statistics
.777 .787 6
Cronbach's Alpha
Cronbach's Alpha Based
on Standardized
Items N of Items
Summary Item Statistics
3.238 3.000 3.371 .371 1.124 .025 6
Item Means Mean Minimum Maximum Range
Maximum /
Minimum Variance N of Items
The covariance matrix is calculated and used in the analysis.
Item-Total Statistics
16.0571 8.055 .542 .439 .741
16.4286 7.723 .516 .290 .746
16.1143 7.987 .532 .380 .743
16.0571 7.350 .694 .567 .702
16.1429 8.714 .474 .416 .758
16.3429 7.350 .450 .307 .775
y1 y2 y3 y4 y5 y6
Scale Mean if Item Deleted
Scale Variance if Item Deleted
Corrected Item-Total Correlation
Squared Multiple Correlation
Cronbach's Alpha if Item
Deleted
Regression
Variables Entered/Removedb
Kompensasi Non Financial,
Kompensasi Financiala . Enter
Model
1 Variables Entered Variables
Removed Method
All requested variables entered.
a.
Dependent Variable: Kinerja b.
Model Summary
.843a .710 .703 .29496
Model
1 R R Square Adjusted
R Square Std. Error of the Estimate Predictors: (Constant), Kompensasi Non Financial, Kompensasi Financial
a.
ANOVAb
6.531 2 3.266 94.360 .000a
3.130 32 .098
9.662 34
Regression Residual Total Model 1
Sum of
Squares df Mean Square F Sig.
Predictors: (Constant), Kompensasi Non Financial, Kompensasi Financial a.
Dependent Variable: Kinerja b.
Coefficientsa
1.570 .136 11.532 .000
.310 .045 .504 6.840 .000 .615
.238 .039 .453 6.148 .000 .574
(Constant)
Kompensasi Financial Kompensasi Non Financial Model
1 B Std. Error
Unstandardized Coefficients
Beta Standardized
Coefficients
t Sig. Partial Correlatio
ns
Dependent Variable: Kinerja a.
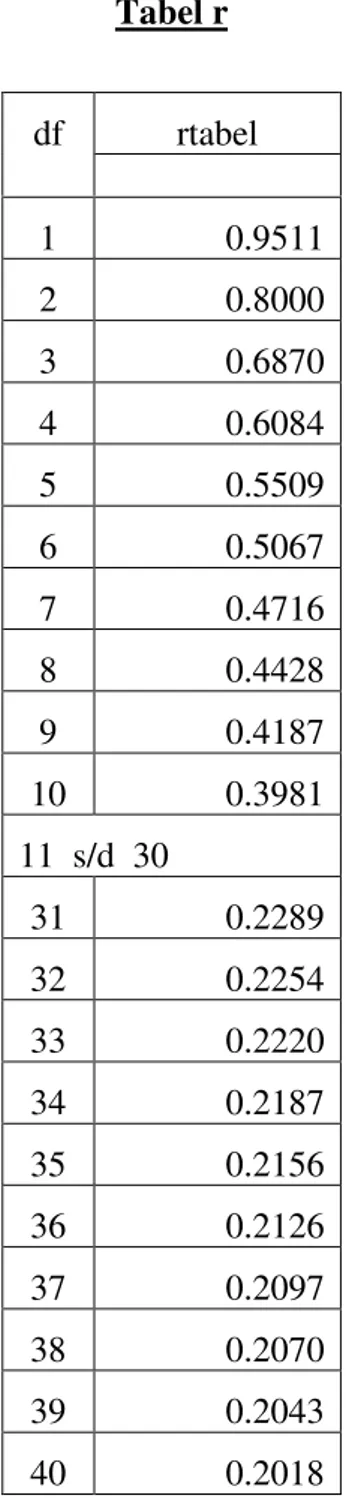
Lampiran 7: Tabel r
Tabel r
df rtabel
1 0.9511
2 0.8000
3 0.6870
4 0.6084
5 0.5509
6 0.5067
7 0.4716
8 0.4428
9 0.4187
10 0.3981
11 s/d 30
31 0.2289
32 0.2254
33 0.2220
34 0.2187
35 0.2156
36 0.2126
37 0.2097
38 0.2070
39 0.2043
40 0.2018
Tabel T
alpha untuk uji dua sisi (two tailed test)
0.01 0.025 0.05 0.1
alpha untuk uji satu sisi (one tailed test)
df 0.005 0.0125 0.025 0.05
1 63.656 25.452 12.706 6.314
2 9.925 6.205 4.303 2.920
3 5.841 4.177 3.182 2.353
4 4.604 3.495 2.776 2.132
5 4.032 3.163 2.571 2.015
6 3.707 2.969 2.447 1.943
7 3.499 2.841 2.365 1.895
8 3.355 2.752 2.306 1.860
9 3.250 2.685 2.262 1.833
10 3.169 2.634 2.228 1.812
11 s/d 30
31 2.744 2.356 2.040 1.696
32 2.738 2.352 2.037 1.694
33 2.733 2.348 2.035 1.692
34 2.728 2.345 2.032 1.691
35 2.724 2.342 2.030 1.690
36 2.719 2.339 2.028 1.688
37 2.715 2.336 2.026 1.687
38 2.712 2.334 2.024 1.686
39 2.708 2.331 2.023 1.685
40 2.704 2.329 2.021 1.684
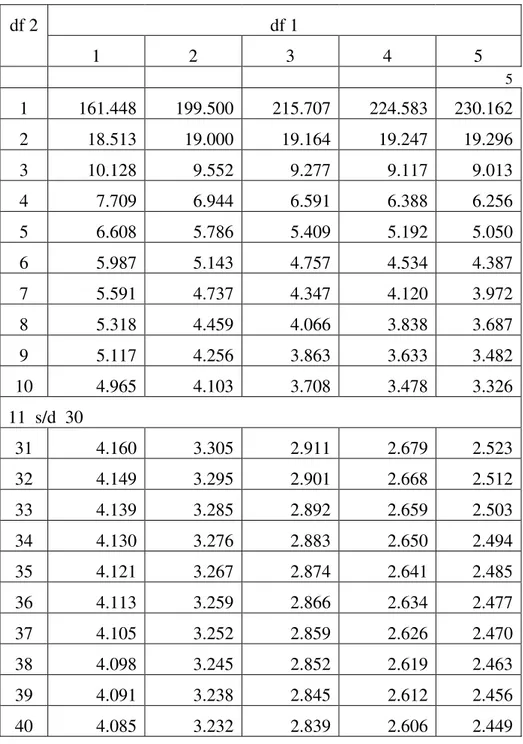
Lampiran 9: Table F Tabel F ( = 5% )
df 2 df 1
1 2 3 4 5
5