March 2009
Effect of VCO to leucocyte differential count, glucose levels and blood
creatinine of hyperglycemic and ovalbumin sensitized Mus musculus Balb/c
NOOR SOESANTI HANDAJANI1,3,♥, RUBEN DHARMAWAN2,3
¹Department of Biology, Faculty of Mathematic and Natural Sciences, Sebelas Maret University. Jl. Ir. Sutami 36a Surakarta 57126, Central Java, Indonesia. Tel./Fax.: +92-271-663375. ♥email: [email protected].
²Faculty of Medicines, Sebelas Maret University, Surakarta 57126, Central Java, Indonesia
3Bioscience Program, School of Graduates, Sebelas Maret University, Surakarta 57126, Central Java, Indonesia
Manuscript received: 3 December 2008. Revision accepted: 24 February 2009.
Abstract. Handajani NS, Dharmawan R. 2009. Effect of VCO to leucocyte differential count, glucose levels and blood creatinine of
hyperglycemic and ovalbumin sensitized Mus musculus Balb/c. Nusantara Bioscience 1: 1-8. Chemical medicines and insulin can decrease glucose blood level on hyperglycemic patients with macro vascular side effect. Diabetes and allergy incidences are influenced by quality and quantity of leucocytes. Lauric acid within VCO reports decreased glucose blood level of diabetes and some allergy incidents. The purpose of the study is to know the effect of VCO on glucose blood level, differential leucocytes count and creatinine blood level on hyperglycemic and normoglicemic ovalbumin sensitized mice. Forty five (45) male (mice) of Mus musculus Balb/c with average weight of 35 g are divided into 9 groups with 5 repetitions, those are 4 non alloxan groups and 5 alloxan induced hyperglycemic groups. On 22nd day to 36th day they are sensitize to ovalbumin as allergen. Blood sample was obtained by orbital vena using heparin as anti coagulant in order measuring glucose blood level by GOD method to 6 times, on 1st, 4th, 18th, 22nd, 32nd and 37th days, then are tested by ANOVA followed by DMRT 0.05. On 37th day, differential leucocytes are determined, blood level are counted, and then compared to normal value. The result of this study were that within differential leucocytes count of hyperglycemic mice, neutrophile percentage were much lower than the normal value (3.22%), and lymphocyte percentage were much higher than the normal value (94.54%). Consumed 0.003 mL/35 g VCO more 18 days decreased glucose blood level on hyperglycemic mice, decreased basophile percentage of ovalbumin sensitized mice, normalized neutrophile percentage no increased creatinine blood level.
Key words: VCO, hyperglycemic, allergy, leucocytes differential count, blood creatinine.
Abstrak. Handajani NS, Dharmawan R. 2009. Pengaruh VCO terhadap hitung jenis leukosit, kadar glukosa dan kreatinin darah Mus
musculus Balb/c hiperglikemi dan tersensitisasi ovalbumin. Nusantara Bioscience 1: 1-8. Obat-obatan kimia dan insulin dapat menurunkan kadar glukosa darah pada pasien dengan efek samping hiperglikemi makro vaskular. Diabetes dan insiden alergi dipengaruhi kualitas dan kuantitas leukosit. Asam laurat dalam VCO dilaporkan menurunkan tingkat glukosa darah pada kejadian diabetes dan beberapa insiden alergi. Tujuan penelitian ini adalah mengetahui pengaruh VCO pada tingkat glukosa darah, diferensial leukosit dan kadar kreatinin pada mencit hiperglikemi dan normoglicemic tersensitisasi ovalbumin. Empat puluh lima (45) mencit Mus musculus Balb/c jantan dengan berat rata-rata 35 g dibagi menjadi 9 kelompok dengan 5 ulangan, yaitu 4 kelompok non aloksan dan 5 kelompok hiperglikemi yang diinduksi aloksan, Pada hari ke-22 sampai ke-36, mereka disensitisasi dengan ovalbumin sebagai penyebab alergi. Sampel darah diperoleh dari vena orbital menggunakan heparin sebagai anti koagulan, kadar glukosa darah diukur dengan metode GOD sebanyak 6 kali, pada hari ke-1, 4, 18, 22, 32 dan 37, kemudian diuji dengan ANAVA yang diikuti oleh DMRT 0,05 untk mengetahui tingkat perbedaan antar perlakuan. Pada hari ke-37, diferensial leukosit dan tingkat kreatinin darah ditentukan, lalu dibandingkan dengan nilai normal. Hasil penelitian menunjukkan bahwa dalam hitungan diferensial leukosit mencit hiperglikemi, persentase neutrofil jauh lebih rendah daripada nilai normal (3.22%), dan persentase limfosit jauh lebih tinggi daripada nilai normal (94.54%). Konsumsi 0.003 mL/35 g VCO lebih dari 18 hari menurunkan kadar glukosa darah pada mencit hiperglikemi, menurunkan persentase basophile pada mencit tersensitisasi ovalbumin, normalisasi persentase neutrophile tidak meningkatkan tingkat kreatinin darah.
Kata kunci: VCO, hiperglikemia, alergi, hitungan diferensial leukosit, kreatinin darah.
INTRODUCTION
Diabetes mellitus is a disease of the pancreatic endocrine hormones, including insulin and glucagons. This was due to inadequate insulin activity so that the amount of insulin secretion is reduced (Suharmiati 2003) or a response decrease in peripheral tissue to insulin (insulin resistance) and a decrease in the ability of pancreatic beta cells to secrete insulin in response to glucose load. The
lymphocytes metabolism, the Diabetes can also cause characteristic changes in lymphocyte metabolism (Otton et al. 2002), which in turn can stimulate the apoptosis lymphocyte (Otton et al. 2004). Research of Alba-Loureiro et al. (2006) showed that diabetes also causes the characteristic on neutrophile function and metabolism of white rats.
Today, allergic is interpreted as immunologic reaction to antigens unreasonably or inappropriately in individuals who have previously sensitized by the antigen in question, so that the antigen is called an allergen. Ovalbumin, an allergenic protein that is found in white egg, can often cause allergic reactions in children (Endaryanto and Harsono 1996). Two processes that mark the occurrence of allergic process are exocytose of granule contents such as histamine and the induction of the formation of mediators that stimulate the formation of prostaglandins and leukotrienes that have a direct impact on the local tissue (Kresno 2001).
All this time, the use of VCO (Virgin Coconut Oil) for cases of diabetes and allergies are empirically much done, so the author wants to prove a reduction of blood glucose levels in hyperglycemia mice (Mus musculus Balb/c) with the treatment of VCO. Given the role of several types of leukocytes between the cases of diabetes and allergies, so in this study, it also should be noted that the VCO is potential for the vulnerability of normal and hyperglycemia mice on allergen exposure by viewing the leukocyte counts.
The consumption of nutritious substances that are expected to resolve a complaint needs to be watched out as the negative impacts may arise as a side effect. Therefore, it should be tested for the presence or absence of the rise of blood creatinine levels indicating the normality status of renal function physiologically, because the inability to excrete creatinine as a component of urine, so, in large numbers, it flows back into the bloodstream above its normal values.
Based on the background of the problems above, the purpose of this study are: (i) to examine the effect of VCO on blood glucose levels in mice (M. musculus) Balb/c hyperglycemia, (ii) to know the leukocyte counts of mice hyperglycemia, (iii) to investigate the VCO effect on leukocyte counts mice which are exposed to ovalbumin, (iv) the effect of VCO on leukocyte counts mice hyperglycemia which are exposed to ovalbumin, (v) the effect of VCO on levels of blood creatinine of mice in efforts to achieve normal glichemia conditions and protection against exposure to ovalbumin.
MATERIALS AND METHODS
Time and place
This research was conducted in October-November 2007. The Maintenance and the checking of blood sugar levels and creatinine in mice were conducted in LP3HP-LPPT Gadjah Mada University, Yogyakarta.
Material
VCO is obtained from PT Prima Solutions Medika
Jakarta, 45 mice (Mus musculus BaIb/c) which are 2-3 months old and male with an average body weight of 35 g are obtained from LP3HP-LPPT Gadjah Mada University, Yogyakarta. Alloxan monohydrate (SIGMA), glibenclamide (Kalbe Farma), ovalbumin (SIGMA), pellets are used to feed the mice and tap water is as drink.
Procedures
Before the treatment, 45 mice Balb/c which are 2-3 months old and male with an average body weight of 35 g are acclimated to suit with laboratory conditions, then they are divided into 9 groups. They are fed with pellets and gave drink with tap water, ad libitum. Then the following works are performed:
Determination of dosage and injection of alloxan. Alloxan dose given to monkeys (Macaca fascicularis) after being converted to white rats weighing 200 g is 35 mg/200 g BW (Widyastuti et al. 2005). For mice weighing 35 g is 35/200x35 mg = 6.125 mg/35 g BW. For injection, the alloxan is dissolved in 0.5 mL of distilled water.
Determination of dosage and the oral application of glibenclamide. The dose of glibenclamide in humans is 5 mg/day/70 kg BW (Tjay and Rahardja 2007), then converted in mice = 35/70000 x 5 mg = 0.00025 mg/day /35 g BW and for every application, it is dissolved with 0.5 CMC 1%.
Determination of dosage and the application of VCO. VCO is given to the human therapeutic dose is generally 3 tablespoons or 45 mL/day (Dayrit, 2000), when converted in mice, it is 35/70.000x45 = 0.00225 mL/day /35 kg BW. In this study, the doses are given in 2 variations, dose I = 0.002 mL/day and dose II = 0.003 mL/day.
Determination of blood glucose levels. Blood glucose level was determined with the GOD-PAP method (Enzymatic Photometric Test) which is the method of photometric measurement with spectrophotometer (Widowati et al. 1977). The measurements are taken 6 times during the study, day 1 (just before alloxan treatment), day 4, day 18, day 22, day 32 and day 37 (just before the sacrifice).
Determination of dose and way of allergen injection. Determination of allergen dose and way of allergen injection refer to the work of Diding (2007) who managed to create mice with an average weight of 17.5 mg to have an allergy on its digestive system. This study used mice with an average weight of 35 mg, so every injection can be converted into 2X of the initial dose, with the protocol as follows: On day 22 sensitization of mice by injection of 0.30 mL ovalbumin out of 2.5 mg ovalbumin in 7.75 mL of Al(OH)3 in intra-peritoneal way. The re-sensitization is
with the same solution and the same way on day 28. then, on day 32-34 consecutively the mice were re-sensitized by giving a solution of 0.30 mL ovalbumin of 2.5 mg ovalbumin in 2.5 mL of PBS orally.
Furthermore, the preparations are lifted and placed in 1-2% of Giemsa dye solution for 30 minutes. Finally, the preparations are removed from the dye solution and washed with water, and carefully dried with a tissue, and then they are ready to be observed under microscope (Suntoro 1983). After all form of leukocytes is observed under microscope with 10x100 magnification, with emersion oil paced on the surface of the smear preparations. Furthermore, the percentage of each type of leukocytes from 100 leukocytes found in every preparation is counted (Fox 1990).
Calculation of blood creatinine levels. Decrease in renal physiological function can be ascertained from the increased levels of blood creatinine. Blood creatinine levels were measured with a spectrophotometer of photometric system based on method of Daffe.
The experimental design
This study used 45 mice (M. musculus Balb/c) which are divided into 9 groups. The blood glucose measurements were performed 6 times and then a Completely Randomized Design was carried out, using 9 kinds of treatments with five replications at each treatment, as follows: A. Treatment of normal controls: mice were given food
and drink each day ad libitum without any treatment until the end of the study.
B. Treatment of non-alloxan, CMC and ovalbumin sensitization: on day 4 mice were given with 0.5 mL of 1% CMC, orally every day until the end of the study. Ovalbumin sensitization was started on day 22-36. C. Non alloxan treatment, dose I of VCO and ovalbumin
sensitization: on day 4 mice were given orally with VCO 0.002 mL/35 g BW every day until the end of the study. Ovalbumin sensitization was started from day 22-36.
D. Treatment of non-alloxan, VCO dose II and ovalbumin sensitization: on day 4 mice were given orally with VCO 0.003 mL/35 g BW every day until the end of the study. Ovalbumin sensitization was started from day 22-36.
E. Treatment of hyperglycemia control: on day 1 mice were injected with alloxan 6.125 mg/35 g BW subcutaneous, then they were let to be fed and drank ad libitum without any treatment until the end of the study. F. Treatment of alloxan, CMC and ovalbumin sensitization: on day 1 mice were injected subcutaneously with alloxan 6.125 mg/35 g BW, then on day 4-36 were given with 0.5 mL of 1% CMC. Ovalbumin sensitized was begun at day 22-36.
G. Treatment of alloxan, VCO dose I, ovalbumin sensitization: on day 1 mice were injected subcutaneously with 6.125 mg/35 g BW, then on days 4-36 were given with VCO 0.002 mL/35 g BW orally and ovalbumin sensitization began on day 22-36. H. Treatment of alloxan, VCO dose II, ovalbumin
sensitization: on day 1 mice were injected subcutaneously 6.125 mg/35 g BW, then on day 4-36 were given with 0.003 mL/35 g BW of VCO orally and ovalbumin desensitization began on day 22-36.
I. Treatment of alloxan, glibenclamide and ovalbumin sensitization: on day 1 mice were injected
subcutaneously with alloxan 6.125 mg/35 g BW, then on day 4-36 was given orally with 0.0025 mg of glibenclamide in 1% CMC and ovalbumin sensitization began on day 22-36.
Data analysis
Quantitative data of blood glucose levels were analyzed using the ANOVA (Analysis of Variance) and if there are significant differences, then it is followed by the DMRT test (Duncan's Multiple Range Test) at the significance level of 5% to determine the significance differences among the treatments. So the VCO effect in decreasing the blood glucose levels in hyperglycemic mice can be detected. Quantitative data of leukocyte differential were obtained by counting each type of leukocytes in each treatment group. And then, the data mean were compared with differential of normal leukocyte, according to Smith and Mangkoewidjojo (1988) and Jacoby and Fox (1984) to compare the leukocyte differential of mice in conditions of hyperglycemia, hyperglycemia that have been treated with the VCO, and hyperglycemia which is exposed to allergens, mice exposed to VCO which is then exposed to allergens and normal leukocyte differential in mice, so that can know the relationship between hyperglycemia, VCO and the development of allergy immunology. Quantitative data average blood creatinine levels of each treatment group is compared with the normal rate according to Jacoby and Fox (1984), so the effect of VCO treatments on the function status of renal physiology can be known.
RESULTS AND DISCUSSION
Blood Glucose Levels (BGL)
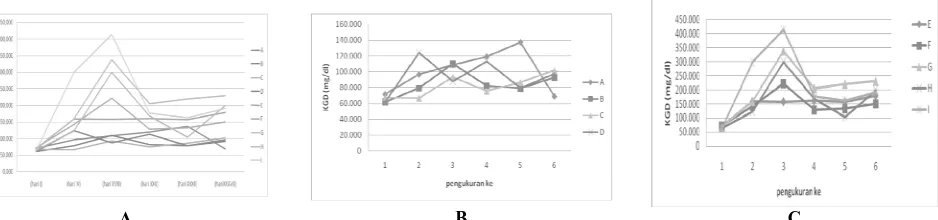
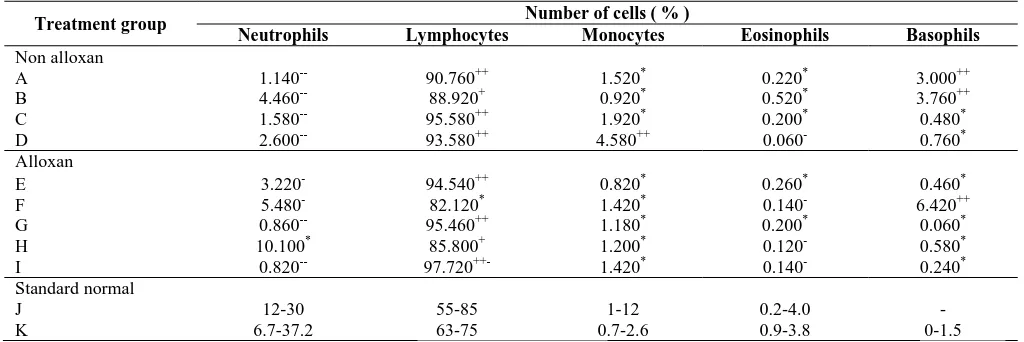
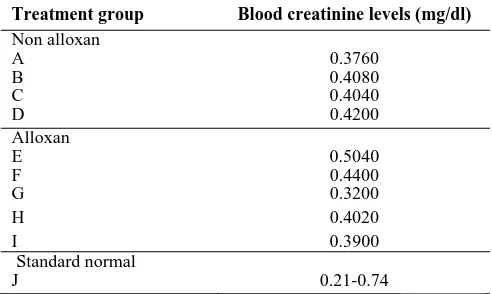
From the results, the state/condition of blood glucose levels data can be obtained as shown in Table 1 and Figure 1: the Mean of Blood Glucose Levels (BGL) of all treatment, measurement 1 to measurement 6, Figure 2: the Mean of BGL of non alloxan groups, measurements 1 to 6 and, Figure 3: Mean BGL of alloxan groups, measurement 1 to 6. The data obtained is analyzed by analysis of variance (ANOVA) one way and when there are significant difference, it is followed by Duncan test (DMRT) with significance level of 5% to determine the real differences among the treatments.
The first measurement of average blood glucose level on day 1 was started just before the injection of alloxan. The mean blood glucose levels of 45 mice were classified into 9 treatment groups. Figure 1 shows that there are no significant differences of the blood glucose levels of all treatment groups from A to I. It means that between groups which were not given with alloxan and the group which were given with alloxan showed no significant difference, namely in a range of 61.40 to 71.80 mg/dl. This is because all the mice used were in normal-glychemia and relatively similar.
to levels at the beginning of treatment. The increase in non alloxan groups allegedly was due to stress because of the treatment of grouping in a different cage from its usual cage. Stress conditions will stimulate the sympathetic nervous system for the adrenal medulla to secrete the epinephrine hormone which causes the increase in blood glucose levels (Guyton and Hall 2008). The same was experienced by mice in the groups treated with alloxan.
In the 3rd measurement (day 18), non alloxan groups has blood glucose levels that can be said to be stable, ie average maximum of about 100 mg/dl. The difference with the alloxan group is so contrast. This is because all of them had an increase in blood glucose levels significantly.
On day 1, shortly after the measurement of blood glucose levels, the groups were treated with alloxan. Alloxan plays a role in pancreatic beta cells that produce insulin and selectively killing these cells (Suharmiati 2003; Guyton and Hall 2008). The destruction of pancreatic beta cells causes the quantity and or quality of insulin disturbing the smooth transport of glucose from the blood into the tissues; it causes the glucose pile up in the blood, causing an increase in levels (hyperglycemia).
The 4th measurements (day 32), the average of blood glucose level of groups of mice induced with alloxan had a
significant reduction. The same blood glucose levels found in group H (alloxan, VCO dose II, ovalbumin) and group I (alloxan, glibenclamide, ovalbumin), although it did not reach the previous level which was not significantly different from the level in the initial treatment, but giving a dose VCO 2 after 18 days gives the same effect with the provision of glibenclamide, which lowers blood glucose levels. According Tjay and Rahardja (2007), glibenclamide is one oral antidiabetic drug including sulfonylurea. Sulfonylurea drugs play a role in stimulating beta cells of Langerhans islands, so that insulin secretion is increased, besides that it also can increase the sensitivity of beta cells for blood glucose levels through its influence on glucose transport proteins. There are indications that these drugs also improve the target organ of insulin and decrease absorption of insulin by the liver. While in group H (alloxan, VCO dose II, ovalbumin), a decline in blood glucose levels happened after the oral provision of VCO at a dose of 0.003 mL/35 g BW every day for 18 days. This was because of the VCO makes an improvement of metabolic activity. MCFAs in the VCO which particularly are monolauric can reduce protein catabolism in hypercatabolic status, and they can serve as a protein sparer which prevents oxidation of amino acids to produce
Table 1. Changes in average blood glucose level groups of mice during treatment
Treatment group
Blood glucose levels day by
1 (day-1) 2 (day-4) 3 (day-18) 4 (day-22) 5 (day-32) 6 (day-37)
mg/dl mg/dl % changes mg/dl % changes mg/dl % changes mg/dl % changes mg/dl % changes
Non alloxan
A 71,600a 96,600abc + 34,9 108,600a + 51,7 119,000ab + 66,2 137,000ab + 91,3 69,000a -3,6 B 61,400a 79,200ab +29 110,000a +79,2 82,000a +33,6 78,800 a +28,3 92,800ab +51 C 67,200a 66,400a -1,2 93,200a +38,7 75,200a +12 86,400a +28,6 101,600ab+51,2 D 61,400a 124,200abc + 102 87,800a + 43 113,000ab + 84 79,400a + 29,3 97,200ab +58,3
Alloxan
E 69,600a 159,000c +128,4 157,800ab+126,7 160,800bcd+131 156,600ab +125 179,200c +157,5 F 71,800a 142,000bc +97,8 222,000bc+209,2 128,000abc+78,3 132,200ab +84 150,200bc+109 G 67,200a 158,800c +136 338,000de+403 205,400d +205,7 220,200b +227,7 230,200c +242,6 H 64,400a 122,800abc +90,7 299,800cd+365,5 168,200bcd+161,2 104,200a +61,8 200,200c +210,9 I 61,800a 298,800d +383,5 413,600d +413,6 177,000cd +186,4 162,200ab +162 191,200c +209,4
Note: The number followed the same superscript letter within a column indicate no significant difference between treatments (p> 0.05). A: normal control group (non-alloxan, non-allergen), B: The treatment of non alloxan, CMC and allergens/ovalbumin, C: Treatment of non alloxan, VCO dose I and allergens/ovalbumin, D: Treatment of non alloxan, VCO II dose and allergen/ovalbumin, E: The control group alloxan/hyperglycemia (alloxan, non-allergen), F: The treatment of alloxan, CMC and allergens/ovalbumin, G: Treatment of alloxan, VCO dose and allergen/ovalbumin, H: Treatment of alloxan, VCO dose II and allergens/ovalbumin, I: Treatment alloxan, glibenclamide and allergens/ovalbumin.
A B C Figure 1. Blood Glucose Levels of 1 to 6 repetised measurement. A. All treatment, B. Non-alloxan measurement, C. Alloxan
energy, and can also provide a protein into the tissues. The supply of network protein stimulates the secretion of glucagon which activates adenil cyclase that will produce cyclic AMP, so the phosphorylation for the processes of normal cell metabolism is activated, such as the repairing of gland secretion and enzymes activity, hormones, and of their receptors (Guyton and Hall 2008). In this case, it is assessed that there was an increase in insulin sensitivity hormones and in tissues of insulin receptor, so the supply of glucose into the tissue was normal. The other insulin functions are also normal, so that high blood glucose levels could be lowered.
In group G (alloxan, VCO dose I, ovalbumin), the same mechanism with the group H (alloxan, VCO dose II, ovalbumin) occurred though the decrease was not as much as dose of VCO 2 group. The mechanism was assumed to be the same. In the normal group or the control solvent, decrease blood glucose levels occurred, although there was no substance that could act as healers, including group E (alloxan, non-therapeutic, non ovalbumin) and group F (alloxan, CMC, ovalbumin). This was due to the recovery levels of the hormone epinephrine in experimental mice as the response of the body to restore its normal conditions. Therefore, 1% CMC solution was only used as a hydrophilic gel drug compounds that were nontoxic, were not digested and not absorbed by the individual (Tjay and Rahardja 2007), so it does not affect changes in blood glucose levels. Only the H group (alloxan, VCO dose II, and ovalbumin) is steadily declining blood glucose levels until day 32nd, but rose again on day 37th, after ovalbumin sensitization protocol is complete. This is because, despite improved metabolic activity with the VCO, due to the body's response to ovalbumin which acts as allergens, so that blood glucose levels which had increased because of damage to pancreatic beta cells selectively, was damaged again, although not fatal.
In groups of non alloxan, the rise of blood glucose levels that occurred is assumed because of stress. The decline did not happen simultaneously, it was because the response of the body to restore normal conditions of each group was also influenced by the initial conditions and the given therapeutic as well as the body's response to allergens given. Three non-alloxan groups except group A (non-alloxan, non-therapeutic, non ovalbumin) decreased maximally and reached levels which were not significantly different from day 32nd, Groups C and D which were given VCO had decreased first, due to the improvement of metabolic activity. In group A, a new decline occurred on day 32nd and continued to decline, it was because there was no influence in the body, including allergens.
Determination of leukocyte differential
Data on the average percentage of each leukocyte type of all treatment groups is shown in Table 2. Data average percentage of each leukocyte type of each treatment group is compared to its normal standard of mice according to Smith and Mangkoewidjojo (1988) and according to Jacoby and Fox (1984).
The first measurement of average blood glucose level on day 1 was started just before the injection of alloxan.
The mean blood glucose level of 45 mice was classified into 9 treatment groups. Figure 1 showed that there are no significant differences of the blood glucose levels of all treatment groups from A to I. It means that between groups which were not given with alloxan and the group which were given with alloxan showed no significant difference, namely in a range of 61.40 to 71.80 mg/dl. This is because all the mice used were in normal-glychemic and relatively similar.
Figure 1 shows the measurement 2 (day 4), all treatment groups, which were given alloxan or not, had an increasing in blood glucose levels, although the non alloxan groups were not statistically significant compared to levels at the beginning of treatment. The increase in non alloxan groups allegedly was due to stress because of the treatment of grouping in a different cage from its usual cage. Stress conditions stimulated the sympathetic nervous system for the adrenal medulla to secrete the epinephrine hormone which caused the increase in blood glucose levels (Guyton and Hall 2008). The same was experienced by mice in the groups treated with alloxan.
In the 3rd measurement (day 18), non alloxan groups had blood glucose levels that can be said to be stable, ie average maximum of about 100 mg/dl. The difference with the alloxan group is so contrast. This is because all of them had an increase in blood glucose levels significantly.
On day 1, shortly after the measurement of blood glucose levels, the groups were treated with alloxan. Alloxan plays a role in pancreatic beta cells that produce insulin and selectively killing these cells (Suharmiati 2003; Guyton and Hall 2008). The destruction of pancreatic beta cells causes the quantity and or quality of insulin disturbing the smooth transport of glucose from the blood into the tissues; it causes the glucose pile up in the blood, causing an increase in levels (hyperglycemia).
prevents oxidation of amino acids to produce energy, and can also provide a protein into the tissues. The supply of network protein stimulates the secretion of glucagon which activates adenil cyclase that will produce cyclic AMP, so the phosphorylation for the processes of normal cell metabolism is activated, such as the repairing of gland secretion and enzymes activity, hormones, and of their receptors (Guyton and Hall 2008). In this case, it is assessed that there was an increase in insulin sensitivity hormones and in tissues of insulin receptor, so the supply of glucose into the tissue was normal. The other insulin functions were also normal, so that high blood glucose levels could lowered.
In group G (alloxan, VCO dose I, ovalbumin), the same mechanism with the group H (alloxan, VCO dose II, ovalbumin) occurred though the decrease was not as much as dose of VCO 2 group. The mechanism is assumed to be the same. In the normal group or the control solvent, decrease blood glucose levels occurred, although there was no substance that could act as healers, including group E (alloxan, non-therapeutic, non ovalbumin) and group F (alloxan, CMC, ovalbumin). This is due to the recovery levels of the hormone epinephrine in experimental mice as the response of the body to restore its normal conditions. Therefore, 1% CMC solution was only used as a hydrophilic gel drug compounds that were nontoxic, were not digested and not absorbed by the individual (Tjay and Rahardja 2007), so it does not affect changes in blood glucose levels. Only the H group (alloxan, VCO dose II, and ovalbumin) is steadily declining blood glucose levels until day 32nd, but rose again on day 37th, after ovalbumin sensitization protocol is complete. This is because, despite improved metabolic activity with the VCO, due to the body's response to ovalbumin which acts as allergens, so that blood glucose levels which had increased because of damage to pancreatic beta cells selectively, was damaged again, although not fatal.
In groups of non alloxan, the rise of blood glucose levels that occurred is assumed because of stress. The decline did not happen simultaneously, it was because the response of the body to restore normal conditions of each group was also influenced by the initial conditions and the given therapeutic as well as the body's response to allergens given. Three non-alloxan groups except group A (non-alloxan, non-therapeutic, non ovalbumin) decreased maximally and reached levels which were not significantly different from day 32nd, Groups C and D which were given VCO had decreased first, due to the improvement of metabolic activity. In group A, a new decline occurred on day 32nd and continued to decline, it is because there is no influence in the body, including allergens.
The differential of leukocyte of group A as control (non-alloxan, non-therapeutic, non ovalbumin) was: 1.140% of neutrophils; 90.76% of lymphocytes, 1.52% of monocytes 0.22% of eosinophils and 3.00% of basophils. All percentage of neutrophile of groups with treatment is less than the normal standard by Smith and Mangkoewidjojo (1988) and/or according to Jacoby and Fox (1984), except in group H (alloxan, VCO 0.003 mL/g BW, ovalbumin) which has a normal percentage.
Furthermore, all lymphocyte percentage of groups with treatment is high above normal standards according to Smith and Mangkoewidjojo (1988) and/or according to Jacoby and Fox (1984), except in group F which has a normal percentage. All the percentage of monocytes is normal, except in group D (non-alloxan, VCO 0.003 mL/g BW), most of the eosinophils percentage in groups with treatment is less than the normal percentage. Percentage of basophils is higher than normal standards, except for groups C, D, E, G, H, and I.
From the above data, it is estimated that basically in animal studies, there has been immunological defense mechanism which is likely due to a viral infection. Because according to Burkitt et al. (1995), an increased number of lymphocytes is generally a marking of a viral infection. Neutrophil percentage far below the percentage of normal, it also supports the allegation. According to Price and Wilson (2006), neutropenia can be caused by disorders of neutrophil formation or the formation of ineffective neutrophil due to hipoplastic or aplastic anemia caused by cytotoxic drugs, the presence of toxic substances and viral infections, starvation and replacement by normal bone marrow by malignant cells, as in leukemia. Since lymphocytes have a central role in all immunological defense mechanisms. The increasing percentage of basophiles is supposed due to the induction of sensitized lymphocytes to respond to antigens or environmental allergens that are less profitable. According to Price and Wilson (2006), basophiles and mast cells have a membrane receptor which is very typical for this segment of Fc&IgE produced by plasma cells as antigen/allergen environment. Burkitt et al. (1995) also states that basophiles are responsible primarily to give an allergic reaction and antigen by releasing chemicals histamine that causes inflammation. According to the authors, the high percentage of basophiles in these groups is as a respond to environmental antigens that arise due to endogenous viruses that infected him. The percentage of neutrophil on group H (alloxan, VCO 0.003 mL/g BW, ovalbumin) occupies the normal range according to Smith and Mangkoewidjojo (1988) or by Jacoby and Fox (1984)
asthma, urticaria and anaphylactic shock. But, there are other incentives for the occurrence of IgE independent mast cell degranulation. Basophils also represents 15% of infiltrate cells in allergic dermatitis and skin alograf rejection, known as basophils skin hypersensitivity, induced by sensitized lymphocytes and is a kind of hypersensitivity with media of slow degranulation cells (Burkitt et al. 1995).
Because the MCFAs contained in the VCO are particularly monolaurin which can reduce protein catabolism in hiperkatabolik status and serve as a protein sparer which prevents oxidation of amino acids to produce energy, so it provides the supply the protein into tissue. The supply of tissue protein stimulates the secretion of glucagon which activates adenil cyclase, produces cyclic AMP; so, the phosphorylation for metabolism processes of cell is activated normally, such as gland secretion and activity of enzymes, hormones, or repairing their receptors (Guyton and Hall 2008). The repair of hormones activity is, among other, increasing the sensitivity of receptors that they will have the ability to actively induce immunological response toward the Th1-Th2 balance after being exposed to ovalbumin allergen. According to Endaryanto and Harsono (1996), allergic is a form of Th2 disease which its cure requires the patient to be on a balanced condition between Th1 and Th2. So if risk factors cannot be avoided for the prevention, active induction of immunological response toward Th1-Th2 balance needs to be strived. According to Abbas and Lichtman (2004), allergy is a type of pathological reactions caused by the release of mediators from mast cells. Generally, the production of IgE antibody cells mast is in various tissues of the body. The situation is followed by inflammation in some individuals exposed by certain foreign antigens which have hit them before. Basically, the immune response, whether specific or
nonspecific, is to act protectively. But the immune response can lead to bad consequences and even disease called hypersensitivity. In addition, according to Bratawidjaja (2004), levels of cAMP and cGMP in cells are one of the things that affect of degranulation of mast cell. The increase of cAMP prevents degranulation, while moderate increase in cGMP boosts the prevention. So normally the percentage of basophiles is in the groups protected by VCO, although they were sensitized with ovalbumin, they allegedly did not experience an allergic event, this was due to the prevention of degranulation of basophiles due to the increase in AMP cyclic caused by the provision of VCO.
The role of monocytes and eosinophils are not needed specifically on this group, because this study allegedly has no relation to bacteria and the given ovalbumin gives no result in anaphylactic reaction. According to Burkitt et al. (1995), the role of eosinophils are, among others, to destroy parasites, to respond to bacterial products and as complement components, especially a substance released by basophiles namely histamine and eosinophil chemotactic factor of anaphylaxis other than activated lymphocytes, the percentage of eosinophils in this group which was just below normal indicates high rates balance toward percentage of lymphocytes.
Measurements of blood creatinine levels
The average data of blood creatinine levels of each group is presented in Table 3. The data is then compared with the standard normal creatinine levels in mice by Jacoby and Fox (1984). From the measurement results of 9 groups of mice, it was found that all group had a magnitude of blood creatinine levels between 0.320 to 0.5040 mg/dl which still meet the range of normal numbers by Jacoby and Fox (1984), namely 0.21 to 0.74 mg/dl.
Tabel 2. The mean percentage of the types of leukocytes from all groups of Mus musculus (mice), day 37 (last day of the study) after
treatment of a variety of healers and ovalbumin sensitization
Treatment group Number of cells ( % )
Neutrophils Lymphocytes Monocytes Eosinophils Basophils
Non alloxan
A 1.140-- 90.760++ 1.520* 0.220* 3.000++
B 4.460-- 88.920+ 0.920* 0.520* 3.760++
C 1.580-- 95.580++ 1.920* 0.200* 0.480*
D 2.600-- 93.580++ 4.580++ 0.060- 0.760*
Alloxan
E 3.220- 94.540++ 0.820* 0.260* 0.460*
F 5.480- 82.120* 1.420* 0.140- 6.420++
G 0.860-- 95.460++ 1.180* 0.200* 0.060*
H 10.100* 85.800+ 1.200* 0.120- 0.580*
I 0.820-- 97.720++- 1.420* 0.140- 0.240*
Standard normal
J 12-30 55-85 1-12 0.2-4.0 -
K 6.7-37.2 63-75 0.7-2.6 0.9-3.8 0-1.5
Table 3. Mean blood creatinine levels of all treated groups on day
37 (end of study)
Treatment group Blood creatinine levels (mg/dl)
Non alloxan Note: Description of A to I are similar to Table 1. J. The normal
according to Jacoby and Fox (1984).
Giving VCO with a dose of 0.002 mL/35 g BW and 0.0030 mL/35 g BW orally for 34 days (started on day 4th- 37th), which is intended to lower blood glucose levels for groups of hyperglycemia mice and to protect the body against allergic reactions for groups of normoglycemia mice or groups that hyperglycemia does not affect the increase in blood creatinine levels. The increased value of creatinine would indicate a decrease of excretion, for example due to the decrease of kidney function. Thus, plasma creatinine values which are still within the normal range after long-term consumption of this VCO do not damage the kidneys, thus it is safe for consumption even though for a long-term consumption. This is appropriate with Kabara’s opinion (1978) that after consumption, the high percentage of lauric acid contained in the VCO which is a medium chain saturated fat will come into the digestive tract and can be easily absorbed without enzymatic process, thus more quickly reach the bloodstream. Furthermore, through blood flow it is brought to liver (heart) and to other tissues directly into mitochondria without the need for carnitine, and then will be converted into energy (ATP), so it will not be accumulated as fat that can lead to problems of blood vessels, etc.. Lauric acid is the most important fatty acids in VCO which potentially build and maintain the immune system. According to him, coconut oil improve immune system, among others, by lowering the amount of H4 virus and increase the number of CD4 cell without the side effects that are concluded from various clinical tests, among others, the number of blood cells, liver function tests (ALT and AST), renal function tests (urea and creatinine), blood lipids (cholesterol, triglycerides, HDL) and body weight.
CONCLUSION
Giving VCO (Virgin Coconut Oil), 0.003 mL per oral after 18 days can lower blood glucose levels of Mus musculus Balb/c with hyperglycemia. The leukocyte differential of mice with hyperglycemia in this study: 3.220% of neutrophil, lymphocytes: 94.540%, 0.820%, of monocytes, eosinophils: 0.260%, 0.460% of basophile,
which reflects the low percentage of neutrophil and the high percentage of lymphocytes. Giving VCO onto differential of mice leukocyte which are exposed to ovalbumin will normalize the percentage of basophils. Giving VCO to differential of hyperglycemic mice leukocyte which are exposed to ovalbumin can normalize the percentage of basophils and neutrophils.
REFERENCES
Abbas AK, Lichtman AH. 2004. Hypersensitivity disease, basic immunology. 2nd ed. Saunders. Philadelphia.
Alba-Loureiro TC, Hirabara SM, Mendonça JR, Curi R, Pithon-Curi TC. 2006. Diabetes causes marked changes in function and metabolism of rat neutrophils. J Endocrinol 188: 295-303
Bratawidjaja KG. 2004. Basic immunology. Faculty of Medicine, University of Indonesia. Jakarta. [Indonesia]
Burkitt HG, Young B, Heath JW. 1995. Handbook and atlas of Wheater functional histology. In: Tambayong J, Melfiawati S (eds). EGC. Jakarta. [Indonesia]
Caradang EV. 2005. Health benefits of virgin coconut oil explained. Philippine Coconut Research and Development Foundation (PCRDF). Manila.
Dayrit C. 2000. Coconut oil in health and desease’s potential, it’s and monolaurin’s potential as cure for HIV/AIDS. 36th Cocotech Meeting, Chennai India, July 25, 2000.
Diding HP. 2007. Effect of probiotics on cytokine profiles and expression of TOOL LIKE receptor of intestinal mucosa of mice Balb/c allergen model. Faculty of Medicine, Sebelas Maret University. Surakarta. [Indonesia]
Endaryanto A, Harsono A. 1996. The prospect of probiotics in allergy prevention through the active induction of immunological tolerance. Faculty of Medicine, Airlangga University/RSUP Dr. Sutomo. Surabaya. [Indonesia]
Fife B. 2003. The healing miracles of coconut oil. Healthwise Pub. Colorado Springs.
Fox SI. 1990. A labolatory guide to human physiology (concept clinical applications). 4th ed. Macmilan. New York.
Guyton A, Hall JE. 2008. Textbook of medical physiology. 11st ed. Elsevier. New York.
UK Prospective Diabetes Study (UKPDS) Group. 1999. Intensive blood glucose control with sulphonylureas or insulin compared with conventional treatment and risk of complication in patient with type 2 diabetes. Lancet 352 (9131): 837-853
Hessel EM, Van Oosterhout AJ, Hofstra CL, De Bie JJ, Garssen J, Van Loveren H, Verheyen AK, Savelkoul HF, Nijkamp FP. 1995. Bronchoconstriction and airway hyperresponsiveness after ovalbumin inhalation in sensitized mice. Eur J Pharmacol 293 (4): 401-412. Jacoby RO, Fox JG. 1984. Biology and desease of mice. Academic Press.
Orlando.
Kabara JJ. 1984. Antimicrobial agents derived from fatty acids. J Am Oil Chem Soc 61: 397-403.
Kresno SB. 2001. Imunologi: diagnosis dan prosedur laboratorium. Faculty of Medicine, University of Indonesia. Jakarta. [Indonesia] Nugroho AE. 2000. Experimental animals with diabetes mellitus:
pathology and mechanism of diabetogenic action. Biodiversitas 7 (4): 387-391. [Indonesia]
Otton R, Mendonca JR, Curi R. 1999. Diabetes causes marked changes in lymphocyte metabolism. J Endocrinol 174: 55-61.
Otton R, Soriano FG, Verlengia R, Curi R. 2004. Diabetes induces apoptosis in lymphocytes. J Endocrinol 182: 145-156.
Price SA, Wilson LM. 2006. Pathophysiology: clinical concept of desease processes. 6th ed. Elsevier. New York.
Smith JB, Mangkoewidjojo S. 1988. Pemeliharaan, pembiakan dan penggunaan hewan percobaan di daerah tropis. UI-Press. Jakarta. [Indonesia]
Suharmiati. 2003. Tests for anti-diabetes mellitus bioactivity of medicinal plants. Cermin Dunia Kedokteran 140: 8-13. [Indonesia]
Suntoro SH. 1983. Staining Method pewarnaan. Bhratara Karya Aksara. Jakarta. [Indonesia]
Tjay TH, Rahardja K. 2007. Essential medicines: efficacy, usage and side effects. 6th ed. Elex Media Komputindo. Jakarta. [Indonesia]
Unger RH, Foster DW. 1992. Diabetes mellitus. In: Wilson JD, Foster DW. Endocrinology. W.B Sunders. London.
Widowati L, Dzulkarnain B, Sa’roni. 1997. Medicinal plants for diabetes mellitus. Cermin Dunia Kedokteran 116: 53-60. [Indonesia]