THE FACTORS INFLUENCING PURCHASE INTENTION BY
STUDENTS TO BUY COUNTERFEIT PRODUCTS
RESEARCH
Submitted to the Faculty of Economics and Business
Management International Program in Partial Fulfillment of the Requirement of
the Degree of BACHELOR OF ECONOMICS at Muhammadiyah University of
Surakarta
Written by:
RIFFAT VERLILA PONTO
B 100 112 002
MANAGEMENT INTERNATIONAL PROGRAM
ECONOMICS AND BUSINESS FACULTY
ABSTRACT
Since there are many people in Indonesia that know and buy counterfeit products of CROCS and since this product is famous enough in society, the author wants to know the factors that can influence purchase intention by students to buy counterfeit products. The title of this research is The Factors Influencing Purchase Intention by Students to buy counterfeit products. The purpose of this research is to analyze the effect of brand personality, perceived product attributes, perceived benefits, product involvement and product knowledge toward purchase intention by students to buy counterfeit products.125 respondents in this research are students of Muhammadiyah University of Surakarta. Technique sampling of research used was convenience sampling. The data in this research have fulfilled the normal distribution. The analysis results brand personality, product involvement and product knowledge were significant and supported while perceived product attributes and perceived benefits were not significant and not supported.
1. Introduction
A global trend that has been increasing at an alarming rate is the
production, distribution and consumption of counterfeit products. In spite of
legislation intended to reduce the sale of counterfeit merchandise, industry leaders
and designers all over the world have identified this as a growing problem, and
are working with groups such as the International Anti-Counterfeiting Coalition
(IACC) to protect their designs from being copied.Counterfeit products are those
bearing a trademark that is identical to, or indistinguishable from, a trademark
registered to another party and infringe the rights of the holder of the trademark
(Bian, 2009).Since there are many people in Indonesia that know and buy
counterfeit products of CROCS and since this product is famous enough in society, the author wants to know the factors that can influence purchase intention
by students to buy counterfeit products.
2. Research Objectives
Based on research problems above, the research objectives is to analyze
the factors influencing purchase intention by students to buy counterfeit products.
The specific research objectives can be derived into the following:
1. To analyze the influence of brand personality toward purchase intention by
students to buy counterfeit products.
2. To analyze the influence of perceived product attribute toward purchase
3. To analyze the influence of perceived benefits toward purchase intention
by students to buy counterfeit products.
4. To analyze the influence of product involvement toward purchase
intention by students to buy counterfeit products.
5. To analyze the influence of product knowledge toward purchase intention
by students to buy counterfeit products.
3. Literature Review
a. Brand Personality. The brand personality factor enables a consumer to
express his/her own self (Aaker, 1997; Moutinho, 2009) or specific dimensions of
the self. It serves as a symbolic function and helps consumers differ from or
integrate themselves with others (Keller, 1993; Moutinho, 2009). There has been
little research conducted as to whether or not the brand personality of an original
brand can be transferred to, or how and to what extent brand personality is
transferred to. However, as symbolic attributes are captured by brand name and by
its nature is not only a product, but more importantly it is a brand – a counterfeit
one that bears a brand name of an original branded product, it is rational to
assume that existing brand theory can be applied to. Thus, previous research
found that when are perceived to process positive and favorable brand
personalities they are more likely to be purchased.
b. Perceived Product Attributes.Keller’s (1993; Moutinho, 2009) broad view
that characterize a product. The consumer uses perceived attributes in the
decision-making process (Puth, et al. 1999; Moutinho, 2009). A positive
relationship between linkage of the brand and perceived product attributes and
brand choice/preference has been found by many researchers (Nedungadi, 1990;
Bian, 2009) the previous research indicates that the more positive the consumers
perceptions of the product attributes of a specific brand are, the more chance there
is of the branded product being purchased.
c. Perceived Benefit.Perceived benefit is what consumers think the product
can do for them (Keller, 1993; Moutinho, 2009) it is associated with perception of
product attributes and brand personality. Benefits are what consumers seek when
purchasing a product/brand (Kotler, 1999; Puth et al. 1999; Moutinho, 2009).
These benefits lead to certain end states or values that consumers wish to achieve
(Kotler, 1999; Moutinho, 2009).Numerous previous studies have demonstrated a
positive relationship between perceived benefit and consumer decision making
(Cho, et al. 2002; Moutinho, 2009).
d. Product Involvement. The level of a consumer's interest in purchasing a
certain product type and how committed they are to purchasing a given brand.
Product involvement by consumers tends to be greater for goods that have a
higher cost and are bought after considerable research and thought such as cars
and computers.The involvement construct originates from the discipline of
psychology. Bian and Moutinho (2011) discussed product involvement as Product
involvement is the lasting insight about the product and considering the product is
there is high product involvement consumers are more willing to spend additional
money on the specific brand.Pedersen and Nysveen (2013) studied product
involvement and its relationship with the consumer purchase intention. They
collected data from 874 respondents to determine the purchase intention of the
customers and after taking several test and analysis they verified that there is
direct positive influence of product involvement on consumer purchase intention.
e. Product Knowledge. Consumers with various levels of product knowledge
differ in their perceptions of a product (Laroche et al., 2003).Implicitly, Peter
(1994: 70-77) states that product knowledge is all the information that is
contained in a product/service that is interpreted by consumers.Lin, Yeh, Chung,
Wen. (2013) studied the relationship between product knowledge and purchase
intention by collecting 292 responses and confirmed that the product knowledge
has a significant positive relationship with the consumer purchase intention.
Pedersen &Nysveen (2013) studied product knowledge and its influence on the
consumer purchase intention. On the basis of 874 responses they were able to
determine and prove that there is a direct positive influence of product knowledge
on purchase intention. Moreover, Eze, Tan, Yeo (2013) studied product
knowledge to find out its influence on the consumer purchase intention.
f. Purchase Intention. According to Keller (1993) purchase intention means a
consumer prefers to buy a product or service because he/she finds that he/she
needs a particular product or service, or even attitude towards a product and
perception ofproduct. In other words, purchase intentions means consumer will
product that the product worth buying. Purchase intention is positively inclined by
some independent variables i.e. brand image, perceived product attributes,
perceived benefits, product involvement and product knowledge.
4. Research Methodology
The sampling method used in this study is convenience sampling and
purposive sampling. Convenience sampling refers to the collection of information
from members of the population who are conveniently available to provide it.
Instead of obtaining information from those who are most readily or conve-
niently available, it might sometimes become necessary to obtain information
from specific target groups. This type of sampling design is called purposive sampling. The sampling here is confined to specific types of people who can
provide the desired information, either because they are the only ones who have it,
or conform to some criteria set by the researcher. (Sekaran, 2013)
To avoid duplication, each respondent was asked to fill out the major of
the respondents. The samplings taken in this research were students of
Muhammadiyah University of Surakarta who have a desire to buy counterfeit
products.
The primary data source is the data that collected first-hand from the
source of the data obtained directly from respondents by the researcher (Sekaran,
questions, the dataobtained from thequestionnairegivento students of
Muhammadiyah University of Surakarta.
Purchase intention variablewas measuredwith a Likert scale, withvalues respectively: strongly agree(score5), agree(score4), neutral(score 3), disagree
(score2), andstrongly disagree(score of 1).
According to Ghozali (2005), the validity of the test is used to measure the
validity of a questionnaire. According to Ghozali (2005), the reliability test is a
tool used to measure the questionnaire. It is an indicator of the variables or
constructs. A questionnaire said to reliable if someone answers the consistent
statement from time to time. Test equipment used is the Cronbach alpha method. More close to score 1.0, the highest of score consistency to answer questions
grains or more and can be trusted. Reliability more than 0.6 is acceptable, 0.8-1 =
good reliability, 0.6-0.79 = acceptable, 0.6 and below = poor reliability. (Sekaran,
2012). Normality test was conducted in order to determine the distribution of the
data in the study model of normal or near-normal distribution. A good model is
the model with the data distribution is normal or near normal. Linearity test is to
determine whether the relationship between the independent and dependent
variables be linear or not.Multicollinearity test is used to determine whether the
independent variables occur multicolinier or not.t-test is the purpose of the test to
determine the level of significant of each influence between dependent and
independent variables.f-test was conducted in order to determine whether the
variable.Multiple linear regression analysis was used to determine how the
dependent variable can be predicted by independent variables.According to
Gudono (2012:143) analyze coefficient of determination (R2) was used to measure
the proportion of variablilitas Y decline as a result of the use of independent
variables in the regression model.
5. Data Analysis
Table IV.1
Respondent Characteristic Based on Experience to buys counterfeits product
Sources: Primary datawereprocessedin 2014.
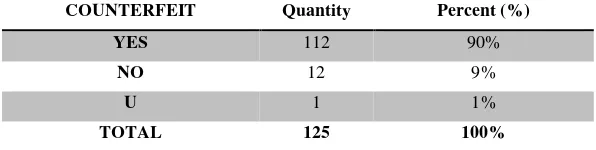
Based on the experience table IV.1 above, 112 respondents (90 %) bought
counterfeit, 12 (9%) respondents never buy counterfeits product and 1 (1%)
respondents did not answer. The result shows that 112 (90%) respondents bought
counterfeits product.
COUNTERFEIT Quantity Percent (%)
YES 112 90%
NO 12 9%
U 1 1%
Table IV.2
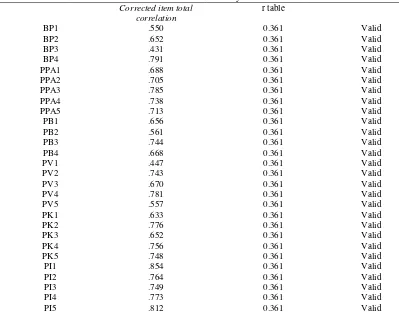
has loading factor values > 0.3, then all the item questionnaire brand personality,
perceived product attribute, perceived benefit, product involvement and product
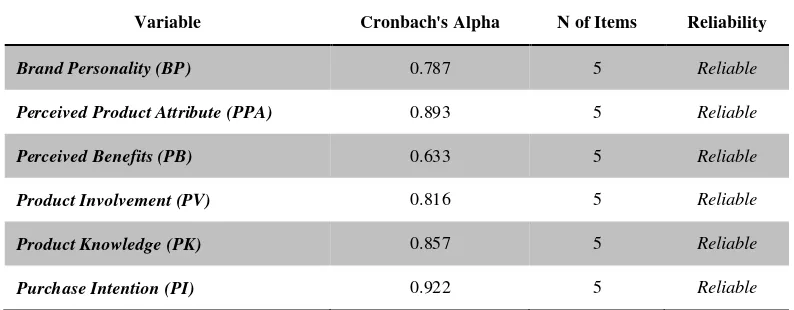
Table IV.3 Result of Reliability Test
Variable Cronbach's Alpha N of Items Reliability
Brand Personality (BP) 0.787 5 Reliable
Perceived Product Attribute (PPA) 0.893 5 Reliable
Perceived Benefits (PB) 0.633 5 Reliable
Product Involvement (PV) 0.816 5 Reliable
Product Knowledge (PK) 0.857 5 Reliable
Purchase Intention (PI) 0.922 5 Reliable
Sources: Primary datawereprocessedin 2014
Based on the table IV.3 above shows reliability test, brand personality
variable with Cronbach alpha> 0.787 means reliable, perceived product attribute variable with Cronbach alpha> 0.893 means reliable, perceived benefits variable
with Cronbach alpha> 0.633 means reliable, perceived involvement variable with
Cronbach alpha> 0.816 means reliable, perceived knowledge variable with
Cronbach alpha > 0.857, and purchase intention variable with Cronbach alpha>
0.922 means reliable. intention variable (Y) was 1.017 with asymp. Sig (2-tailed) 0.252 > 0.050 means
Table IV.5
Personality, Perceived Product Attributes, Perceived Benefits, Product
Involvement and Product Knowledge toward Purchase Intention are linear.
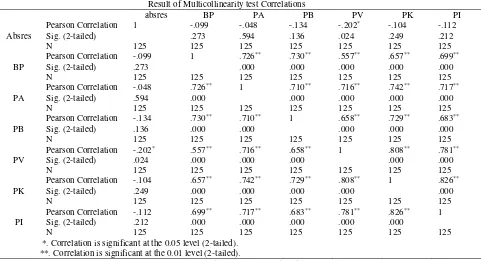
Table IV.6
*. Correlation is significant at the 0.05 level (2-tailed). **. Correlation is significant at the 0.01 level (2-tailed).
Sources: Primary datawereprocessedin 2014
The above table IV.6 above shows that the value obtained
intercorrelations for each variable are as follows, for the brand personality
variable (BP) rcount = (-.099) ((-.099) < 0.80), for the perceived product attribute
(-.134) ((-.134) < 0.80), for Product Involvement (PV) rcount = (-.202) ((-.202) <
0.80), to the Product Knowledge (PK) rcount = (-.104) ((-.104) < 0.80), for the
Purchase Intention (PI) rcount = (-.112) ((-.112) < 0.80 ). Then it can be concluded
that the results of the regression analysis of data is not the case multicollinearity
problem.
a. Predictors: (Constant), PK, BP, PB, PA, PV
Sources: Primary datawereprocessedin 2014
R Square also called the coefficient of determination. From the table IV.7
above value of R Square is 0.758 (the value of R Square is the square of the
correlation coefficient (R), or 0.871 x 0.871 = 0.758). This means that 75.8%
purchase intention can be explained by the brand personality variable (BP),
Perceived Product Attributes (PPA), Perceived Benefits (PB), Product
Involvement (PV) and Product Knowledge (PK). While the rest (100% - 75.8% =
24.2%) is explained by other causes. R Square value ranges between 0 and 1, the
smaller the value of R Square, the weaker the relationship between the variables.
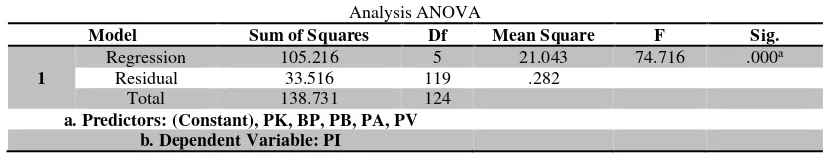
Table IV.8
a. Predictors: (Constant), PK, BP, PB, PA, PV b. Dependent Variable: PI
Sources: Primary datawereprocessedin 2014
The result of the ANOVA test or alsocalled as f-test, from the table IV.8 is
obtained by Fcount of 74.716 with significant level of 0.000. Because of the
predict purchase intention. Therefore the Brand Personality variables (BP),
Perceived Product Attributes (PPA), Perceived Benefits (PB), Product
Involvement (PV) and Product Knowledge (PK) collectively influence on the
Purchase Intention.
0.05,brand personality has a significant influence on the purchase intention.
Product involvement has a significant influence on the purchase intention. Product
knowledge has a significant influence on the purchase intention.
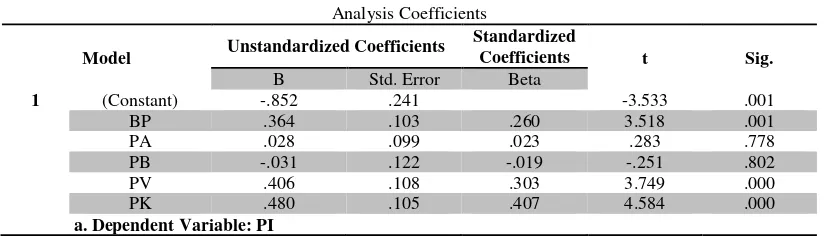
Regression equation is:
Y = (-0.852) + 0.364 X1 + 0.028 X2 + (-0.031 X3) + 0.406 X4 + 0.480 X5 + e
a) Constants are negative value (-0.852), mean if there is no Brand Personality
(BP), Perceived Product Attributes (PPA), Perceived Benefits (PB), Product
Involvement (PV) and Product Knowledge (PK), the Purchase Intention has
b) Coefficient of regression X1 is positive values 0.364 mean that if perception
of brand personality is increase, the purchase intention will increase too.
c) Coefficient of regression X2 is positive values 0.028 mean that if perception
of perceived product attribute is increase, the purchase intention will increase
too.
d) Coefficient of regression X3 is negative values (-0.031) mean that if
perception of perceived benefits is decrease, the purchase intention will
increase.
e) Coefficient of regression X4 is positive values 0.406 mean that if perception
of product involvement is increase, the purchase intention will increase too.
f) Coefficient of regression X5 is positive values 0.480 mean that if perception
BP : Brand Personality (0.001) Influencing toward Purchase Intention. PPA : Perceived Product Attribute (0.778)
PB : Perceived Benefits (0.802)
PV : Product Involvement (0.000) Influencing toward Purchase Intention. PK : Product Knowledge (0.000) Influencing toward Purchase Intention.
The figure IV.1 shows that the brand personality, product involvement and product knowledge influence toward the purchase intention.
BP
PPA
PB
PV
PK
PI
0.000
0.000 0.778
6. Discussion
Based on table IVshows that unstandardized coefficients beta of brand
personality (independent variable) toward purchase intention (dependent variable)
is 0.364 with significant 0.001 (0.001 < 0.005) or probability more smaller then
0.05, this means H0 rejected, coefficient regression significant or brand personality
variable significant toward purchase intention.Table IVshows that unstandardized
coefficients beta of perceived product attributes (independent variable) toward
purchase intention (dependent variable) is 0.023 with significant 0.778 (0.778 >
0.005) or probability bigger then 0.05, this means H0 accepted, coefficient
regression significant or perceived product attribute variable not significant
toward Purchase Intention. It can conclude that hypotheses 2 are not
supported.Table IVshows that unstandardized coefficients beta of perceived
benefits (independent variable) toward purchase intention (dependent variable) is
(-0.019) with significant 0.802 (0.802 > 0.005) or probability bigger then 0.05,
this means H0 accepted, coefficient regression significant or perceived benefits
variable not significant toward Purchase Intention. It can be concluded that
hypotheses 3 is not supported.Based on table IVshows that unstandardized
coefficients beta of product involvement (independent variable) toward purchase
intention (dependent variable) is 0.303 with significant 0.000 (0.000 > 0.005)or
probability smaller then 0.05, this means H0 rejected, coefficient regression
significant or product involvement variable significant toward Purchase Intention.
It can be concluded that hypotheses 4 is supported.Table IVshows that
toward purchase intention (dependent variable) is 0.407 with significant 0.000
(0.000 > 0.005)or probability smaller then 0.05, this means H0 rejected, coefficient
regression significant or product knowledge variable significant toward Purchase
Intention. It can be concluding that hypotheses 5 are supported.
7. Conclusions
Brand personality has influence toward purchase intention. This research
is exactly similar with previous research by Bian and Moutinho (2009) who
described brand personality influence positively toward purchase
intention.Perceived product attributes did not influence toward purchase
intention.Perceived benefits did not influence toward purchase intention.Product
involvement has influence toward purchase intention. This research is match with
research that has been made by Pedersen and Nysveen (2013) described product
involvement influence positively toward purchase intention.Product knowledge
has influence toward purchase intention. Lin, Yeh, Chung, Wen. (2013) described
product involvement influence positively toward purchase intention.There are
differences between the previous research and the research that the author has
conducted perceived product attributes and perceived benefits. In previous
research, both perceived product attributes and perceived benefits were significant
and supported the hypotheses that the previous researchers made. In this research,
the result is not significant and does not support the hypotheses that the author
REFERENCES
Aaker, D.A. and Keller, K.L. (1990), “Consumer evaluation of brand extension”,
Journal of Marketing, Vol. 54, January, pp. 27-41.
Aaker, D.A. (1996), “Building Strong Brands”, The Free Press, New York, NY.
Aaker, J.L. (1997), “Dimensions of brand personality”, Journal of Marketing Research, Vol. 34, August, pp. 347-56.
Amendolara, L. (2005), “Knocking out knock-offs: effecting the criminalization of trafficking in counterfeit goods”, Fordham Intellectual Property, Media and Entertainment Law Journal, Vol. 15, pp. 789-836.
Ang, S., Cheng, P., Lim, E. and Tambyah, S. (2001), “Spot the difference: consumer responses towards counterfeits”, Journal of Consumer Marketing, Vol. 18 No. 3, pp. 219-350.
Azoulay, A. and J.-N. Kapferer (2003). "Do brand personality scales really measure brand personality?",The Journal of Brand Management 11(2): 143-155.
Bian, X. And Moutinho, L. (2009). “The role of brand image, product involvement and knowledge in explaining consumer purchase behaviour of counterfeits”, Journal of Marketing, Vol. 1 No.1, pp. 9-26.
Biel, A. (1992), “How brand image drives brand equity”, Journal of Advertising Research, Vol. 32 No. 6, November/December, pp. RC6-RC12.
Bloch, P., Bush, R. and Campbell, L. (1993), “Consumer ‘accomplices’ in product counterfeiting”, Journal of Consumer Marketing, Vol. 10 No. 4, pp. 27-36. Chakravarti, A. and Janiszewski, C. (2003), “The influence of macro-level
motives on consideration set composition in novel purchase situations”,
Journal of Consumer Research, Vol. 30 No. 2, September, pp. 244-58. Cho, Y., Im, I., Hiltz, R. and Fjermestad, J. (2002), “The influence of post
-purchase evaluation factors on online vs offline customer complaining behavior: implications for customer loyalty”, Advances in Consumer Research, Vol. 29 No. 1, pp. 318-26.
de Chernatony, l. and McDonald, M.H.B. (1998), “Creating Powerful Brands in Consumer, Service and Industrial Markets”,Butterworth-Heinemann, Oxford.
Fazio, R.H. (1990), “Multiple processes by which attitudes guide behavior: the mode model as an integrative framework”, in Zabba, M.P. (Ed.), Advances in Experimental Social Psychology, Vol. 23, Academic Press, New York, NY, pp. 75-109.
Freling, T. and Forbes, L. (2005), “An examination of brand personality through methodological triangulation”, Journal of Brand Management, Vol. 13 No. 2, November, pp. 148-62.
Ghozali, Imam. 2005. “Statistik Non Parametik Aplikasi Analisis Multivariate dengan program SPSS”. Semarang. Badan Penerbit UNDIP.
Hem, L.E. and Iversen, N.M. (2002), “Decomposed similarity measures in brand extensions”, Advances in Consumer Research, Vol. 29 No. 1, pp. 199-206. Indriantoro, Nur. 1999, “Metodologi Penelitian Bisnis untuk Akuntansi dan
Kapferer, J-N. (1995), “Brand confusion: empirical study of a legal concept”,
Psychology & Marketing, Vol. 12 No. 6, pp. 551-69.
Keller, K.L. (1993), “Conceptualizing, measuring, and managing consumer-based brand equity”, Journal of Marketing, Vol. 57 No. 1, January, pp. 1-22. Kempf, D.S. and Smith, R.E. (1998), “Consumer processing of product trial and
the influence of prior advertising: a structural modelling approach”, Journal of Marketing Research, Vol. 35 No. 3, August, pp. 325-38.
Kotler, Philip and Amstrong, Gary. (2005), “Dasar-dasar Pemasaran”, Jakarta :
PT Indeks.
Laroche, M., Bergeron, J. and Goutaland, C. (2003), “How intangibility affects perceived risk: the moderating role of knowledge and involvement”,
Journal of Services Marketing, Vol. 17 No. 2, pp. 122-40.
Lefkoff-Hagius, R. and Mason, C. (1993), “Characteristics, beneficial, and image attributes in consumer judgements of similarity and preference”, Journal of Consumer Research, Vol. 20 No. 1, pp. 100-10.
Nedungadi, P. (1990), “Recall and consumer consideration sets: influencing choice without altering brand evaluations”, Journal of Consumer Research, Vol. 17 No. 3, December, pp. 263-76.
Peter, P.J. and Olson, J.C. (1994), “Understanding Consumer Behavior”,
McGraw-Hill/Irwin, Burr Ridge, IL.
Phau, I., Prendergast, G. and Chuen, L.H. (2001), “Profiling brand-piracy-prone consumers: an exploratory study in Hong Kong’s clothing industry”,
Journal of Fashion Marketing and Management, Vol. 5 No. 1, pp. 45-55. Plummer, J.T. (2000), “How personality makes a difference”, Journal of
Advertising Research, Vol. 40 No. 6, November/December, pp. 79-83. Puth, G., Mostert, P. and Ewing, M. (1999), “Consumer perceptions of mentioned
product and brand attributes in magazine advertising”, Journal of Product & Brand Management, Vol. 8 No. 1, pp. 38-49.
Schiffman, L.G. and Kanuk, L.L. (1991), “Consumer Behavior, 4th ed.”, Prentice
Hall International, London.
Stokmans, M. (1991), “The Relative Importance of Product Attributes: Consumer Decision Theories in New-Product Development”, Delft University Press, Delft.
Sekaran, Uma. (2006), “Metode Penelitian Bisnis”, Jakarta : Salemba Empat. Sekaran, Uma. (2013). “Research Method for Bussiness: Metode Penelitian untuk