Health-Enhancing Physical
Activity Monograph in the
Islamic Republic of Iran
Only 50 copies of this book have been published. The electronic version is available on the websites of the National Institute for Health Research of the Islamic Republic of Iran and the Sports Medicine Research Center of Tehran University of Medical Sciences.
1. Sports Medicine Research Center, Neuroscience Institute, Tehran University of Medical Sciences, Tehran, Iran 2. School of Nursing and Midwifery, Tehran University of Medical Sciences, Tehran, Iran
3. Department of Pediatrics, Child Growth and Development Research Center, Research Institute for Primordial Prevention of Non-Communicable Diseases, Isfahan University of Medical Sciences, Isfahan, IR Iran
4. Non-Communicable Diseases Research Center, Alborz University of Medical Sciences, Karaj, Iran
5. Chronic Diseases Research Center, Endocrinology and Metabolism Population Sciences Institute, Tehran University of Medical Sciences, Tehran, Iran
Foreword 1
List of used abbreviations in alphabetical order 2
Summary 3 Introduction 4
Importance of physical activity and its effects on health 5
Costs imposed on the healthcare system and society by inactivity 7
Physical activity status in Iranian children and adolescents 8
Physical activity status in Iranian adults 17
Overview of interventions for physical activity promotion in Iran 35
Situation analysis of current policies in physical activity 37
Physical activity barriers in Iran 38
Reference 40
List of Tables
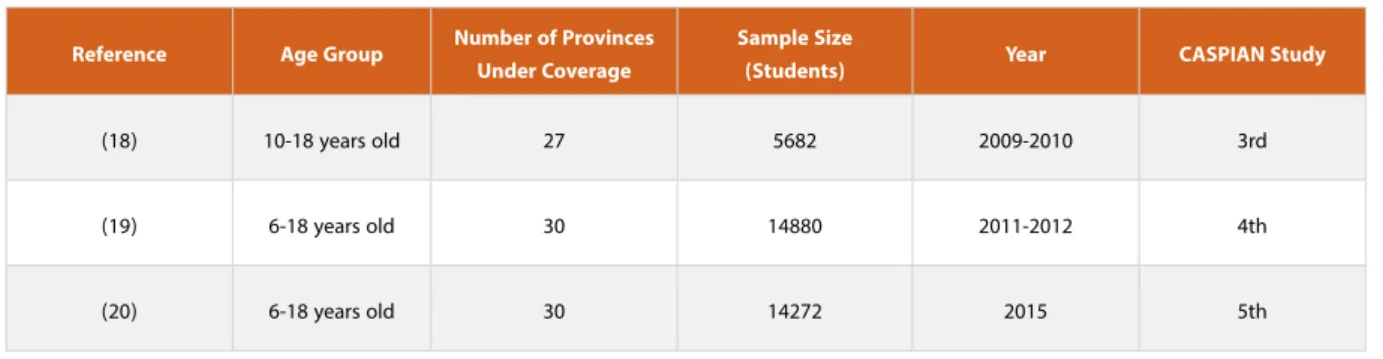
Table 1: Overall characteristics of the CASPIAN surveillance system studies 8
Table 2: The prevalence of low, moderate, and high levels of physical activity by gender according to the CASPIAN studies 9 Table 3: The distribution of low, moderate, and high levels of physical activity in 6- to 18-year-olds by province according to the 4th CASPIAN study (19 ) 12 Table 4: The distribution of low, moderate, and high levels of physical activity in 6 to 18 years olds by province according to the 5th CASPIAN study (20) 13 Table 5: The prevalence of insufficient physical activity in Iran from 2006 to 2016 according to the STEPs study in percentage 18 Table 6: The distribution of low physical activity in all age groups by gender and province in 2016 according to the STEPs study in percentage (22) 24 Table 7: The distribution of the low physical activity prevalence in Iran by age group index and gender in percentage (22) 25 Table 8: Evaluation of the systematic review of “Prevalence of Physical Inactivity in Iran” 27 Table 9: Summary of the results of some cohort studies evaluating the physical activity levels in different people 32 Table 10: Summary of the results of some Persian studies evaluating the physical activity levels in different people in recent years in Iran 33 Table 11: Physical activity barriers according to the suggestions by studies conducted in Iran 38
according to the CASPIAN studies in percentage (18-20) 9 Diagram 2: The trend of changes in the prevalence of low, moderate, and high levels of physical activity in Iranian boys
according to the CASPIAN studies in percentage (18-20) 10
Diagram 3: The trend of changes in the prevalence of low, moderate, and high levels of physical activity in Iranian urban
population according to the CASPIAN studies in percentage (18-20) 10
Diagram 4: The trend of changes in the prevalence of low, moderate, and high levels of physical activity in Iranian rural
population according to the CASPIAN studies in percentage (18-20) 11
Diagram 5: The trend of changes in watching TV with the duration of longer than 2 hours daily in Iran by gender according to
the CASPIAN studies in percentage (18-20) 14
Diagram 6: The trend of changes in watching TV with the duration of longer than 2 hours daily in the urban and rural population
in Iran according to the CASPIAN studies in percentage (18 -20) 15
Diagram 7: The trend of changes in using Personal Computer (PC) with the duration of longer than 2 hours daily in Iran
according to the CASPIAN studies by gender and in percentage (18-20) 15
Diagram 8: The trend of changes in using Personal Computer (PC) with the duration of longer than 2 hours daily in the urban
and rural population in Iran in CASPIAN studies in percentage (18-20) 16
Diagram 9: The trend of changes in physical activity levels, the duration of watching TV, and the duration of using Personal Computer (PC) in Iranian grade-schoolers and adolescents in percentage (18-20) 16 Diagram 10: The prevalence of insufficient physical activity in Iran from 2006 to 2016 according to the STEPs study by percentage 18 Diagram 11: The trend of changes in the insufficient physical activity prevalence in Iran by gender from 2006 to 2016 according
to the STEPs study in percentage 19
Diagram 12: The trend of changes in the insufficient physical activity prevalence in Iranian men by age group (18-64 years old)
from 2006 to 2016 according to the STEPs study in percentage 20
Diagram 13: The trend of changes in the insufficient physical activity prevalence in Iranian women by age group (18-64 years
old) from 2006 to 2016 according to the STEPs study in percentage 20
Diagram 14: The trend of changes in the prevalence of insufficient physical activity at work from 2006 to 2016 according to the
STEPs study in percentage 21
Diagram 15: The trend of changes in the prevalence of insufficient physical activity at times of traveling to and from places from
2006 to 2016 according to the STEPs study in percentage 21
Diagram 16: The trend of changes in the prevalence of insufficient physical activity at times of recreational activities from 2006
to 2016 according to the STEPs study in percentage 22
Diagram 17: The trend of changes in the prevalence of insufficient physical activity in different aspects of physical activity by
Foreword
From ancient times, Iranian culture and science have believed that physical activity and exercise are of great importance in human health. "The basis of health is on nutrition, sleep, and exercise, while the most important of which is exercise," says Avicenna, at the beginning of Al-Qanon, the most famous medical reference book in the global history of medicine. Therefore, he started his book with three chapters on the effects of exercise on the human body. Research performed in Iran in recent years also emphasized this issue. However, studies reported that the physical activity levels of Iranians are decreasing sharply. It seems that many Iranians are not fully aware of the sufficient levels of physical activity and methods of engaging in physical activity in Iran. Valuable activities have been conducted by different ministries, universities, and related organizations to make Iranians more active; however, the effectiveness of these activities is somehow controversial. This report provided a summary of the studies on the physical activity levels of Iranians and its changes in recent years. We hope that it will be useful in planning for physical activity increase in Iranians.
تـسا یـگدنزرو هـب لااو هدـنز نـت شاـب زارفارـس و یارـگ شزرو هـب شاـب هدنـشوک و یاـسایم شزرو ز تـسا یـگدنز ی هـیام یـگدنزرو هـک تـسا یگدنکفارـس یتـسس ماـجرف هـک تـسا یگدنـشوک هـب یـتیگ داـینب هـک Ramin Kordi, MD
Head of the Sports Medicine Research Center, Tehran University of Medical Sciences, Tehran, Iran Head of the Iranian Association of Sports Medicine
List of used abbreviations in alphabetical order
Abbreviations
Behavioral Risk Factor Surveillance System BRFSS
Childhood & Adolescence Surveillance and Prevention of Adult Non-communicable of Diseases CASPIAN
Disability-Adjusted Life Year DALY
Global Physical Activity Questionnaire GPAQ
hour/day h/d
Health Enhancing Physical Activity Policy Audit Tool HEPA PAT
Health Promotion Model HPM
International Physical Activity Questionnaires IPAQ
Low Physical Activity LPA
Metabolic Equivalent of Task MET
Physical Activity PA
Physical Activity Questionnaire for Adolescents PAQ-A
Iran Persian Gulf Healthy Heart Study PGHHS
STEPwise approach to surveillance STEPs
Trans Theoretical Model TTM
Summary
Insufficient physical activity is the main cause of premature mortality through the increased burden of non-communicable diseases. Non-communicable diseases are the cause of 38 million annual deaths globally. Non-communicable diseases cause more than 76% of all the burden of diseases in Iran (1). From 1990 to 2017, the percentage of low physical activity attributable Disability-Adjusted Life Years (DALY) increased by 1.5 times globally and 2 times in Iran, respectively, causing more than 1.2 million deaths worldwide and 18,000 deaths in Iran in 2017. Iran has a high prevalence of physical inactivity as a developing country (2). The most important risk factors in 18-64-year-old Iranians include unhealthy diet, hypertension, high body mass index, inactivity, smoking, and diabetes. Thus, a reduction in the prevalence of these risk factors is a principal strategy for non-communicable disease reduction (3). The goal of the Global Action Plan on Physical Activity (GAPPA) of the World Health Organization (WHO) is reaching a 15% reduction in the global prevalence of inactivity by 2030 (4). According to the studies, the achievement of this goal can be fulfilled through national efforts and measures. Providing information on the prevalence of low physical activity plays
an important role in making policies and decisions in public health. The "National Plan on Physical Activity Promotion of the Islamic Republic of Iran" is being complied with the contribution of all the physical activity-related organizations and aims to manage the physical inactivity epidemic in Iran; however, some progressions have recently been made in the field of physical activity. These statistics indicate a significant gap between the desired and achieved targets of the policies. In 2015, all countries committed to investing in healthcare nationally, aiming at increasing physical activity. Understanding the physical activity barriers can contribute to the planning and modifications to support this move (4). There is a lack of extended and integrated studies investigating the "physical activity barriers" in Iran, so an exact understanding of all the barriers is not possible. However, unfavorable economic conditions, long working hours, cultural issues, lack of self-esteem and motivation, the impact of the disease, injury, and disability, lack of appropriate and available facilities and environments, and air and environmental pollutions are the main physical activity barriers in Iran according to the limited studies conducted.
Introduction
Definition of physical activity
Physical activity includes physical movements by skeletal muscles with energy consumption. It can be performed in different ways, including walking, cycling, housework, exercises, and recreational activities such as football or local games and sports. It can also be done in different places such as at work and at home. Physical activity involves active work such as farming physical works, carrying different equipment in work, and during daily traveling from workplace to home by cycling or walking. It also includes the activities that can be performed around the house such as walking and exercising in the park or gym. All forms of physical activity lead to health benefits if performed regularly and with enough duration and intensity (5).
In 2010, the World Health Organization (WHO) provided recommendations on the type and frequency of physical activity aimed at achieving optimal health for young people, adults, and the elderly (5).
Recommended level of physical activity in
different age groups:
Physical activity in infants, toddlers, and children (0-5 years old) (6)
Babies younger than 1-year-old should have multiple bouts of physical activity per day, especially by playing actively on the floor.
1-4-year-old toddlers should have 180 minutes of physical activity with any intensity throughout the day, including motor skills and various activities in different environments and.
In children up to 5 years of age, the highly active games should increase to 60 minutes per day.
More physical activity leads to additional health benefits. Physical activity in grade-schoolers (5 to 12) and adolescents (13 to 17) (5)
They should have a minimum duration of 60 minutes of moderate to vigorous physical activity daily.
Physical activity of amounts greater than 60 minutes daily
will provide additional health benefits.
Most of the daily physical activity should be aerobic. Muscle-strengthening and vigorous-intensity physical
activities should be done at least 3 times a week. Physical activity in adults aged 18-64 years old (5)
They should do at least 150 minutes of moderate-intensity physical activity or at least 75 minutes of vigorous-intensity physical activity in a week, or a combination of both. The activity should be performed in bouts of at least 10
minutes duration.
For additional health benefits, adults should increase their moderate-intensity physical activity to 300 minutes per week, or engage in 150 minutes of vigorous-intensity aerobic physical activity per week
Muscle-strengthening activities should be done involving major muscles 2 days a week or more.
Elderly aged 65 years and above (5)
They should do at least 150 minutes of moderate-intensity physical activity or at least 75 minutes of vigorous-intensity physical activity in a week, or a combination of both. The activity should be performed in bouts of at least 10
minutes duration.
For additional health benefits, they should increase their moderate-intensity physical activity to 300 minutes per week, or engage in 150 minutes of vigorous-intensity aerobic physical activity per week
The elderly with poor mobility should perform balance-enhancing physical activity to prevent falls 3 days per week or more.
Muscle-strengthening activities should be done involving major muscles 2 days a week or more.
When the elderly cannot do the recommended amounts of physical activity, they should be as physically active as their abilities and conditions allow.
Importance of physical activity and its effects on health
Regular physical activity contributes to the preventionand treatment of non-communicable diseases including cardiovascular diseases, stroke, diabetes, breast cancer, and colon cancer (5). Moreover, Physical activity is involved in the prevention of other major risk factors of non-communicable diseases including hypertension, overweight, and obesity. It is also associated with mental health improvement (7, 8), delaying the incidence of dementia (9), and improvements in the quality of life and well-being (10). Sedentary behavior includes any type of behavior during awakening times with less energy consumption or equal to 1.5 METs (Metabolic Equivalent of Task) including sitting, leaning, and lying down (11). Recent literature reported that getting the habit of sedentary behavior (such as sitting for long periods) is associated with abnormal glucose metabolism, cardiovascular-metabolic disease development, and general mortality (12). Sedentary behavior reduction by promoting physical activity in daily life (standing, climbing stairs, and short walks) increases the physical activity level and helps to reach the required and desirable threshold of health. In addition to the several benefits of physical activity, more active societies are pioneers in productivity in investments, including fossil fuel consumption reduction and achieving cleaner and less polluted air and safe roads. Physical activity is important in all age groups. Active games and recreation in early childhood are important for healthy growth and development of
children and adolescents. The quality of physical education and the presence of a supportive environment in the school can provide motor skills and health needed for a long-term healthy and active lifestyle. Physical activity and its different forms lead to multiple health, social, and economic benefits. Walking and cycling are the key routes of active transportation, allowing active engagement of people in regular and daily physical activity. However, the role and popularity of these methods are unfortunately decreasing in most countries. Low- and middle-income countries show the most changes. For example, the transportation methods of many people are changing from walking and cycling to private cars (13). Policies that improve the road safety and urban design, prioritize the pedestrians, cyclists, and public transport users in service provision, and focus on the educational issues and creating public green spaces and entertainment and sports facilities ultimately lead to a reduction in the private car use, airborne carbon particle emissions, urban traffic, and health costs (14). Also, they result in the local microeconomics strengthening and the promotion of community health and quality of life at the same time (14, 15). Given the fact that 70% of the global population lives in urban areas, city authorities can take effective steps regarding this issue by improving the urban design and sustainable transportation systems, according to the Shanghai Consensus on healthy cities (16).
Costs imposed on the healthcare system and society by inactivity
Global physical inactivity costs health-care systems$54 billion throughout the world. In addition to direct costs, physical inactivity contributes to $14 billion in productivity losses (17). According to the statistics in high-, low-, and middle-income countries, 1%-3% of national healthcare costs are due to the inactivity-related complications (4). These reports are quite conservative because of limited access to the data regarding the costs imposed by mental health issues and musculoskeletal
problems. The costs out of the healthcare system that are imposed on the community, including the potential environmental benefits of increased walking, cycling, and public transportation use and fossil fuel use reduction are not included in this general evaluation. Studies show that physical inactivity-related costs are increasing and are associated with adverse effects on the healthcare system, environment, economic development, community well-being, and quality of life for all.
Physical activity status in Iranian children and adolescents
The National Plan on Childhood & Adolescence Surveillance and Prevention of Adult Non-Communicable Diseases (CASPIAN) studies were first implemented in 2003 and have been performing in 5 steps since then. The project was implemented with the collaboration of associated organizations and ministries, including the Ministry of Education and the Ministry of Health and Medical Education with the support of the World Health Organization (WHO). The study was performed in the provinces of Iran on 6-18 years old students. Both genders and all grades were included in the sampling. A quota sampling of the urban and rural areas was conducted in each county. The sampling was performed considering the different grades, the ratio of the public to private schools under coverage, and the ratio of sample allocation to the schools of the related
cluster. Also, the sampling was based on a simple random method and included the girls' and boys' schools using the school records. A questionnaire was designed for the study which was consisted of 2 parts. Part I included the demographics and the potential environmental factors affecting the physical activity, which were extracted from the other studies. Part II included the evaluation of the levels of physical activity of the students using a classified physical activity questionnaire adapted from validated questionnaires (World Health Organization Global School-based Student Health Survey (WHO-GSHS).
The CASPIAN study provides comprehensive information on a variety of topics. We only discuss the information regarding physical activity and hours spent on watching TV and using the Personal Computer (PC) by the students.
Table 1: Overall characteristics of the CASPIAN surveillance system studies
CASPIAN Study Year Sample Size (Students) Number of Provinces Under Coverage Age Group Reference 3rd 2009-2010 5682 27 10-18 years old (18) 4th 2011-2012 14880 30 6-18 years old (19) 5th 2015 14272 30 6-18 years old (20)
According to the studies based on CASPIAN studies, physical activity is classified into three levels of low, moderate, and high as follows:
A low level of physical activity is defined as less than 2 sessions
of physical activity per week (duration of each session is 30 min). A moderate level of physical activity is defined as 2-4 sessions of physical activity per week, while the high level of physical activity is defined as more than 4 sessions a week.
Physical Activity Girls Boys Total 3rd CASPIAN Percentage (%)
Low level of physical activity 53.1 69.1 61.5
Moderate level of physical activity 31.7 19.3 25.1
High level of physical activity 15.3 11.6 13.3
4th CASPIAN Percentage (%)
Low level of physical activity 39.6 28.7 34.1
Moderate level of physical activity 37.9 35.6 36.7
High level of physical activity 22.4 35.6 29.1
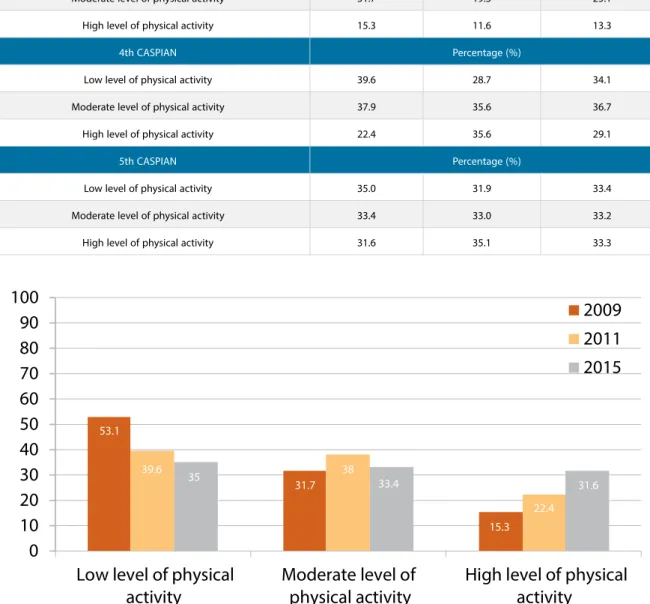
5th CASPIAN Percentage (%)
Low level of physical activity 35.0 31.9 33.4
Moderate level of physical activity 33.4 33.0 33.2
High level of physical activity 31.6 35.1 33.3
Table 2: The prevalence of low, moderate, and high levels of physical activity by gender according to the CASPIAN studies
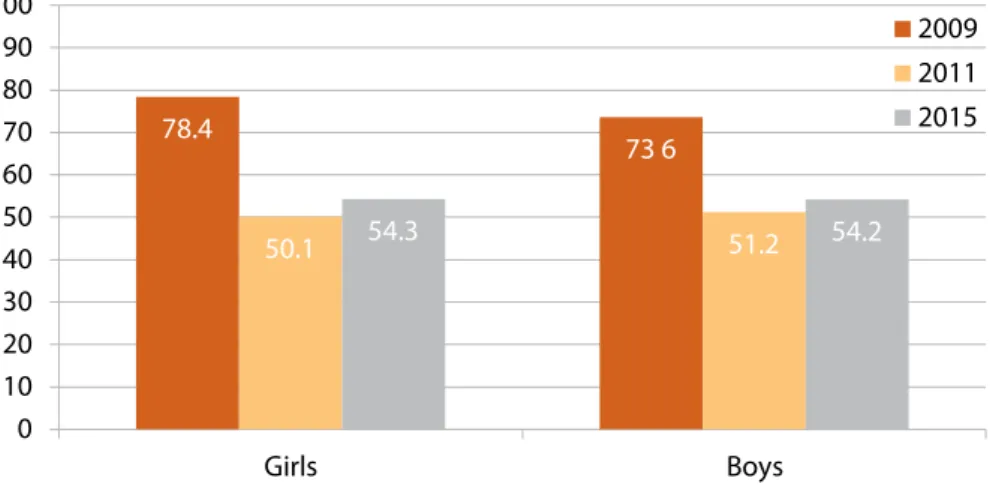
Diagram 1: The trend of changes in the prevalence of low, moderate, and high levels of physical activity in Iranian girls according to the CASPIAN studies in percentage (18-20)
According to Diagram 1, the prevalence of low level of physical activity was decreased by 18.1%, while the prevalence of moderate and high levels of physical activity increased by 1.7% and 16.3%, respectively, in female grade-schoolers and adolescents is the 5th CASPIAN study (2015) compared to the 3rd CASPIAN study (2009).
53.1 31.7 39.6 35 38 33.4 22.4 15.3 31.6
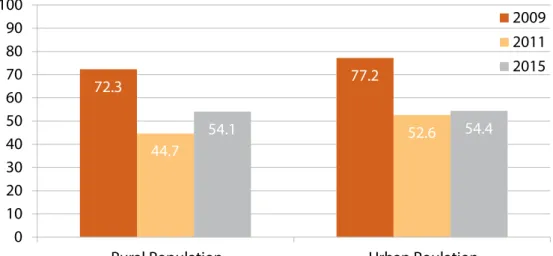
Diagram 3: The trend of changes in the prevalence of low, moderate, and high levels of physical activity in Iranian urban population according to the CASPIAN studies in
percentage (18-20)
Diagram 2: The trend of changes in the prevalence of low, moderate, and high levels of physical activity in Iranian boys according to the CASPIAN studies in percentage (18-20)
According to Diagram 3, the prevalence of low level of physical activity was decreased by 25.5%, while the prevalence of moderate and high levels of physical activity increased by 6.6% and 19%, respectively, in the grade-schoolers and adolescents living in the urban areas in the 5th CASPIAN study (2015) compared to the 3rd CASPIAN study (2009). These data indicate an increase in the level of physical activity and a decrease in the level of physical inactivity in this population.
According to Diagram 2, the prevalence of low level of physical activity was decreased by 37.2%, while the prevalence of moderate and high levels of physical activity increased by 13.7% and 23.5%, respectively, in male grade-schoolers and adolescents is the 5th CASPIAN study (2015) compared to the 3rd CASPIAN study (2009).
60.1 26.6 34.9 34.6 36.5 33.2 32.3 28.8 13.3 28.8 31.9 19.3 35.6 33 11.6 35.6 35.1 69.1
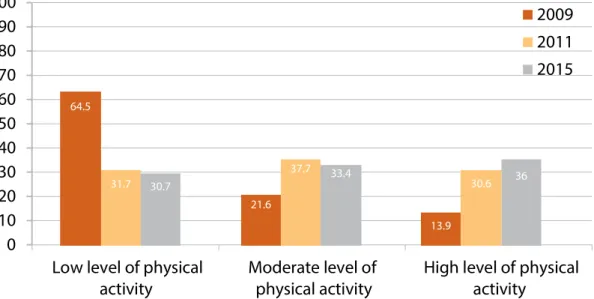
Diagram 4: The trend of changes in the prevalence of low, moderate, and high levels of physical activity in Iranian rural population according to the CASPIAN studies in
percentage (18-20)
According to Diagram 4, the prevalence of low level of physical activity was decreased by 33.8%, while the prevalence of moderate and high levels of physical activity increased by 11.8% and 22.1%, respectively, in the grade-schoolers and adolescents living in the rural areas in the 5th CASPIAN study (2015) compared to the 3rd CASPIAN study (2009). These data indicate an increase in the level of physical activity and a decrease in the level of physical inactivity in this population.
64.5 31.7 30.7 21.6 37.7 33.4 13.9 30.6 36
province according to the 4th CASPIAN study (19)
4th CASPIAN study (%) Level of physical activity
Low Moderate High
Provinces Tehran 49.4 37.3 13.4 Khuzestan 48.4 30.6 21 Qom 47.9 28.8 23.3 Alborz 44.9 38.2 16.9 Chaharmahal va Bakhtiari 41.7 31.5 26.8 Kermanshah 40 36.8 23.2 Ilam 39.4 35 25.6
Kohgiloyeh and Boyerahmad 39.1 34.7 26.2
Zanjan 36.2 39 24.8
Sistan and Baluchestan 35 36.6 28.4
Ardabil 34.9 38.1 27 Isfahan 34.9 37.4 27.7 Mazandaran 34.8 34.5 30.7 Bushehr 34.1 38.4 27.6 Qazvin 33.5 23.9 33.5 Khorasan Razavi 33 43.3 23.7 East Azerbaijan 32.8 40.5 26.7 Hormozgan 32.3 40.9 26.8 Hamedan 32.2 36.1 31.7 Markazi 30.4 37.1 32.5 North Khorasan 29.4 33.2 37.4 Golestan 28.5 38.7 32.8 Semnan 28.4 40 31.6 Fars 28.4 38.8 32.8 Kurdistan 27.9 30.9 41.2 Lorestan 27.5 46.8 25.7 Gilan 26 40.4 33.5 Yazd 25.4 34.6 40 West Azerbaijan 22.9 36.7 40.4 Kerman 21.8 43.9 34.3 Total 34.1 36.8 29.1
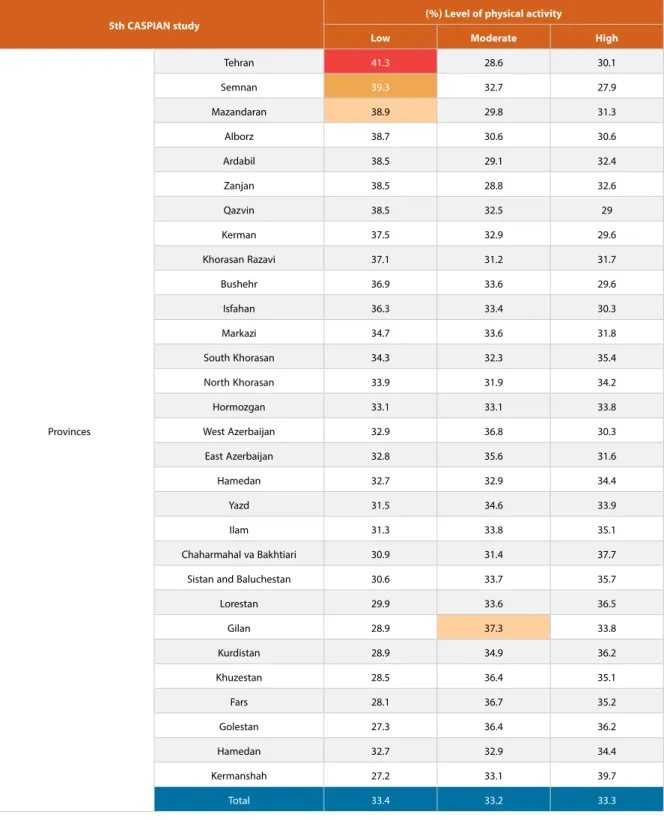
Table 4: The distribution of low, moderate, and high levels of physical activity in 6 to 18 years olds by province according to the 5th CASPIAN study (20)
5th CASPIAN study (%) Level of physical activity
Low Moderate High
Provinces Tehran 41.3 28.6 30.1 Semnan 39.3 32.7 27.9 Mazandaran 38.9 29.8 31.3 Alborz 38.7 30.6 30.6 Ardabil 38.5 29.1 32.4 Zanjan 38.5 28.8 32.6 Qazvin 38.5 32.5 29 Kerman 37.5 32.9 29.6 Khorasan Razavi 37.1 31.2 31.7 Bushehr 36.9 33.6 29.6 Isfahan 36.3 33.4 30.3 Markazi 34.7 33.6 31.8 South Khorasan 34.3 32.3 35.4 North Khorasan 33.9 31.9 34.2 Hormozgan 33.1 33.1 33.8 West Azerbaijan 32.9 36.8 30.3 East Azerbaijan 32.8 35.6 31.6 Hamedan 32.7 32.9 34.4 Yazd 31.5 34.6 33.9 Ilam 31.3 33.8 35.1 Chaharmahal va Bakhtiari 30.9 31.4 37.7
Sistan and Baluchestan 30.6 33.7 35.7
Lorestan 29.9 33.6 36.5 Gilan 28.9 37.3 33.8 Kurdistan 28.9 34.9 36.2 Khuzestan 28.5 36.4 35.1 Fars 28.1 36.7 35.2 Golestan 27.3 36.4 36.2 Hamedan 32.7 32.9 34.4 Kermanshah 27.2 33.1 39.7 Total 33.4 33.2 33.3
Diagram 5: The trend of changes in watching TV with the duration of longer than 2 hours daily in Iran by gender according to the CASPIAN studies in percentage (18-20)
According to Diagram 5, the prevalence of watching TV with a duration of longer than 2 hours daily was decreased by 24.1% and 19.4% in girls and boys, respectively, in the 5th CASPIAN study (2015) compared to the 3rd CASPIAN study (2009).
Diagram 6: The trend of changes in watching TV with the duration of longer than 2 hours daily in the urban and rural population in Iran according to the CASPIAN studies
in percentage (18 -20)
Diagram 7: The trend of changes in using Personal Computer (PC) with the duration of longer than 2 hours daily in Iran according to the CASPIAN studies by gender and in
percentage (18-20)
According to Diagram 6, the prevalence of watching TV with the duration of longer than 2 hours daily was decreased by 22.8% and 18.2% in the grade-schoolers and adolescents living in the urban and rural areas, respectively, in the 5th CASPIAN study (2015) compared to the 3rd CASPIAN study (2009). A decrease in the duration of TV watching per day was reported in the CASPIAN studies.
According to Diagram 7, the prevalence of using Personal Computer (PC) with the duration of longer than 2 hours daily was decreased by 17.9% and 8.5% in girls and boys, respectively, in the 5th CASPIAN study (2015) compared to the 3rd CASPIAN study (2009).
Diagram 8: The trend of changes in using Personal Computer (PC) with the duration of longer than 2 hours daily in the urban and rural population in Iran in CASPIAN studies
in percentage (18-20)
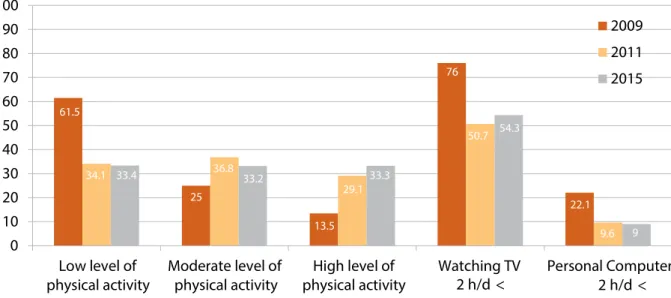
Diagram 9: The trend of changes in physical activity levels, the duration of watching TV, and the duration of using Personal Computer (PC) in Iranian grade-schoolers and
adolescents in percentage (18-20)
According to Diagram 8, the prevalence of using Personal Computer (PC) with the duration of longer than 2 hours daily was decreased by 15% and 8.3% in the grade-schoolers and adolescents living in the urban and rural areas, respectively, in the 5th CASPIAN study (2015) compared to the 3rd CASPIAN study (2009).
61.5 34.1 33.4 25 36.8 33.2 13.5 29.1 33.3 76 50.7 54.3 22.1 9.6 9
Physical activity status in Iranian adults
Given the increasing prevalence of non-communicable diseases throughout the world, the World Health Organization (WHO) has taken the STEPwise Approach to Surveillance (STEPs) to provide access to validated and comparable data on the risk factors of non-communicable diseases. The survey goal is the implementation of an appropriate surveillance system for these major risk factors. This survey is being conducted in Iran in this regard. The STEPwise approach to non-communicable disease risk factor surveillance of the World Health Organization has three steps of data collection. These three executive steps include inquiries using questionnaires, physical measurements, and biochemical measurements. The first step, which is conducting an inquiry using a questionnaire, evaluates smoking, diet, physical activity, history of hypertension and diabetes, and other factors including the seat belt use by the front passenger and the healthcare insurance coverage. The prevalence of different levels of physical activity is assessed using the Global Physical Activity Questionnaire (GPAQ2). The study target group includes adults older than 18 years of age. The sampling is performed from all provinces and both genders. The GPAQ questionnaire includes 16 items regarding the different types of physical activity that people perform as a part of their daily lives. Generally, the questionnaire investigates all the types of vigorous and moderate physical activity during the past 7 days in three domains of physical activity during work, during traveling to and from places, and during recreational activities.
According to the GPAQ questionnaire used in the STEPs survey for physical activity assessment (21), vigorous-intensity physical activity includes activities with the minimum duration of 10 min continuously, causing a substantial increase in the respiratory and heart rate (including carrying heavy loads, construction works, and drilling works). Moderate-intensity physical activity includes activities with a minimum duration of 10 min continuously, causing a noticeable increase in the respiratory and heart rate (including carrying light loads,
frequent climbing of short stairs, or long walks). According to the GPAQ questionnaire, the level of physical activity of the individuals is classified into three levels of low, moderate, and high levels.
An individual with the following criteria is classified in the high-level group of physical activity:
High-intensity activity at least 3 days a week with a minimum energy consumption of 1500 METs per min/week
Or
A combination of walking 7 days a week or moderate-intensity physical activity with a minimum energy consumption of 3000 METs per min/week
An individual who does not fulfill the criteria of the high level of physical activity but fulfills any of the following criteria is classified in the moderate-level group of physical activity: High-intensity activity at least 3 days a week or more with a minimum duration of 20 minutes a day
Or
Moderate-intensity activity at least 5 days a week or more, or walking 7 days a week with a minimum duration of 30 minutes a day
Or
Moderate- or high-intensity activity or walking at least 5 days a week or more with a minimum energy consumption of 600 METs per min/week
An individual who does not fulfill any of the criteria associated with high or moderate levels of physical activity is classified in the low-level group of physical activity.
7 rounds of the STEPwise approach to non-communicable disease risk factor surveillance survey (STEPs) have been performed in Iran in 2005, 2006, 2007, 2008, 2009, 2011, and 2016 (in 2005, the level of physical activity was not studied). The data obtained in the first two steps (inquiry using a questionnaire and physical measurements) was collected in all rounds of the study and the results of insufficient physical activity prevalence are presented in Table 5 and Diagram 10.
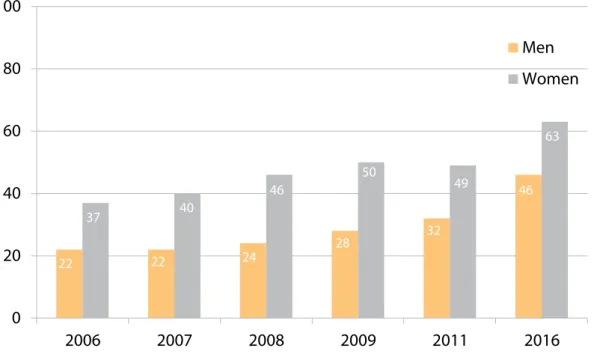
Table 5: The prevalence of insufficient physical activity in Iran from 2006 to 2016 according to the STEPs study in percentage Year 2006 2007 2008 2009 2011 2016 Total population 31 31 35 39 40 56 Men 22 22 24 28 32 46 Women 37 40 46 50 49 63
Diagram 10: The prevalence of insufficient physical activity in Iran from 2006 to 2016 ac-cording to the STEPs study by percentage
22 22 24 28 32 37 40 46 50 63 49 46
Diagram 11: The trend of changes in the insufficient physical activity prevalence in Iran by gender from 2006 to 2016 according to the STEPs study in percentage
According to these studies, there is a significant decrease in physical activity from 2006 to 2016. In terms of gender, the prevalence of insufficient physical activity was higher in women than men. This difference was also steadily increasing from 2006 to 2016 (Diagram 11).
Diagram 12: The trend of changes in the insufficient physical activity prevalence in Iranian men by age group (18-64 years old) from 2006 to 2016 according to the STEPs study in
percentage
Diagram 13: The trend of changes in the insufficient physical activity prevalence in Iranian women by age group (18-64 years old) from 2006 to 2016 according to the STEPs study in
percentage
In terms of different age groups, the highest and lowest rates of insufficient physical activity were reported in the elderly (older than 60 years old) and adults 18-24 years of age, respectively. Moreover, insufficient physical activity has increased significantly in all age groups in recent years (Diagram 13).
Diagram 14: The trend of changes in the prevalence of insufficient physical activity at work from 2006 to 2016 according to the STEPs study in percentage
Diagram 15: The trend of changes in the prevalence of insufficient physical activity at times of traveling to and from places from 2006 to 2016 according to the STEPs study in percentage
47.6 59.9 47.1 62.8 47.8 60.8 48.4 61.1 58.9 66.4 67.5 73.9 47.6 59.9 46.6 63.1 52.7 64.1 53.2 63.7 58.6 70.2 67.6 73.9
Diagram 16: The trend of changes in the prevalence of insufficient physical activity at times of recre-ational activities from 2006 to 2016 according to the STEPs study in percentage
Diagram 17: The trend of changes in the prevalence of insufficient physical activity in different aspects of physical activity by gender in 2016 according to the STEPs study in percentage
53.4 78.6 54.8 77.8 53.8 75.5 59.2 78.9 64.2 70.2 85.5
In this section, there is a report of the results associated with the prevalence of the low level of physical activity according to the STEPs study in 2016 (22).
48,01 48,01 - 53,60 53,60 - 59,20 64,79 - 69,20 64,79
Figure 1: The distribution of low physical activity level in Iran in 2016 by province according to the STEPs study in percentage (22)
Figure 1 presents the prevalence of the low level of physical activity in adults older than 18 years old and involves the urban and rural areas and both genders in 2016 on the map of Iran. The prevalence of low level of physical activity is classified into 5 groups as follows: Lower than 48.01%, 48.01%-53.60%, 53.60%-59.20%, 59.20%-64.79%, higher than 64.79%.
Table 6 presents the distribution of low physical activity in all age groups by gender and province in 2016 according to the STEPs study in percentage.
Bushehr is the first province in the prevalence of low level of physical activity with a rate of 70.3% and the women in Bushehr have the lowest physical activity among Iranian women with a prevalence of 79.5%. The province with the lowest physical activity in men is Yazd with a prevalence of 59.3%. On the other hand, the lowest prevalence of low physical activity in men and women was 35.7% and 44.5% in Kohgiloyeh and Boyerahmad and Kurdistan, respectively. The best condition in physical activity was reported in Zanjan with a low physical activity rate of 42.4%, where the average condition of physical activity in both genders was better compared to the other provinces.
So in general, the prevalence of low physical activity in Iran in 2016 was 56%, considering all age groups and both genders.
to the STEPs study in percentage (22)
By Province Men Women Total
Bushehr 58.8 79.5 70.3
Yazd 59.3 70.6 65.2
Sistan and Baluchestan 57.4 71.1 65.2
Kermanshah 54.1 72.2 64.2 Ardabil 52.1 73.2 64 Alborz 55.8 70.7 64 Chaharmahal va Bakhtiari 52 72.1 63.6 Semnan 56.9 67.4 63 Hormozgan 55.8 67.9 62.8 Kerman 50.4 67.5 60 Golestan 50.7 66 58.8 Khuzestan 47.3 68 58.6 Fars 50.2 63.7 58.2 Isfahan 49.5 63.6 57.4 Tehran 46.9 64.9 56.5 Hamedan 41.4 66 55.6 Ilam 40.2 65.5 55 Markazi 39.8 65.4 54.7 Qazvin 36.3 69.5 64.6 Khorasan Razavi 47.6 59.8 54.3 East Azerbaijan 39.6 60 51.3 Lorestan 38.9 60.1 51.2 Mazandaran 39.3 58.7 50 West Azerbaijan 38.9 57.1 49.3 Gilan 39.9 54.8 48.2 South Khorasan 36 56 47.3 Kurdistan 35.7 55.6 47.3 North Khorasan 38.1 53.4 47.2
Kohgiloyeh and Boyerahmad 39.3 44.5 42.5
Table 7: The distribution of the low physical activity prevalence in Iran by age group index and gender in percentage (22)
Age Group Mean prevalence of low physical activity in Iran
Mean prevalence of low physical activity in Iranian women Mean prevalence of low physical activity in Iranian men 18-24 years old 51.6 63.3 35.4 25-34 years old 54.9 64.7 41.7 35-44 years old 56 61.3 49.2 45-54 years old 54.4 58.2 49.4 55-64 years old 54.5 61.3 44 65-69 years old 62.1 72.3 48.5
70 years old and
older 69.5 81.3 58.5
Provinces with the highest prevalence of low level of
physical activity
Provinces with the lowest prevalence of low level of
physical activity
Yazd, 78.2 South Khorasan, 35.6 Hormozgan, 71.8 Kohgiloyeh and Boyerahmad, 38.3
Bushehr, 76.6 Zanjan, 40.7
Alborz, 66.3 Zanjan, 52.6
Bushehr, 76.3 Kohgiloyeh and Boyerahmad, 24.1 Sistan and Baluchestan, 82.2 South Khorasan, 15.7
Semnan, 85.1 Qazvin, 52
According to Table 7, the highest prevalence of low physical activity was reported in 70 years old women or older living in Semnan province, while the lowest rate was in men aged 65- 69 years in South Khorasan province.
According to the table, the mean prevalence of low physical activity was higher than 50% in all age groups. In other words, one in two people of any age group has low physical activity.
In case of achieving a 20% relative reduction in the prevalence of insufficient physical activity, which is one of the goals of the National Document on the Prevention and Control of Non-Communicable Diseases of the Islamic Republic of Iran from 2015 to 2025, the mortality rate can be reduced significantly. 10717 deaths can be prevented in Iran annually if the rate of insufficient physical activity is reduced by 20% (Figure 2).
North Khorasan 65 Khorasan Razavi 887 South Khorasan 77 Seman 106 Golestan 53 Isfahan 678 Yazd 178 Kerman 325
Sistan and Baluchestan 184 Hormozgan 233 Fars 875 Bushehr 167 Kohgiloyeh and Boyerahmad 65 Chaharmahal va Bakhtiari 100 Khuzestan 571 Ilam 72 Lorestan 156 Kermanshah 264 Hamedan 201 Kurdistan 180 West Azerbaijan 357 East Azerbaijan 446 Ardabil 162 Gilan 439 Zanjan 91 Qazvin 168 Markazi 226 Qom 173 Tehran 2157 Mazandaran 431
Figure 2: Number of annual preventable deaths in case of a 20% reduction in the prevalence of insufficient physical activity in each province in Iran (22).
Evaluation of the systematic review of “Prevalence of Physical Inactivity in Iran”
In a study by Fakhrzadeh et al. (23), the authors investigated the prevalence of physical inactivity in Iran. They searched the international and national databases including Scopus, PubMed/Medline, ISI, Irandoc, Barakat knowledge network system, and SID to access all the available studies. Finally, 34 studies were extracted. The data of these studies are presented in Table 8 in terms of gender, age, province, and year of publication.
Table 8: Evaluation of the systematic review of “Prevalence of Physical Inactivity in Iran”
The table is adapted from the study by Fakhrzadeh et al. (23) and the studies published from 2016 to 2019 were added.
Numb
er
Author locationStudy Publication year Sample size groupAge Measure Reporting method Results (physical activity) Reference
1 Janghorbani national levelAt the 2005 89404 15-65 1GPAQ
The rate of people with a low level of physical activity who has never been married, who are married, and who were married previously
Never been married = 44.9 Married = 23.6 Previously married (not now) = 16.3
Total = 27.93
24
2 Janghorbani national levelAt the 2005 89404 15-65 GPAQ
Percentage of individuals with a low level of physical activity
8/27 25
3 Alikhani national levelAt the 2005 70981 25-65 GPAQ
The average time of physical activity at work in minutes per day
5/27
26 The average time
of physical activity during traveling to and from places in minutes per day
8/43 The average time
of physical activity during recreational activities in minutes per day
6/28
4 Esteghamati national levelAt the 2007 3001 25-65 GPAQ Percentage of individuals with physical activity Low level of physical activity = 40.1% 27 Moderate level of physical activity = 24.7% High level of physical activity = 35.2%
Numb
er
Author locationStudy Publication year Sample size groupAge Measure Reporting method Results (physical activity) Reference
5 Koohpayehzadeh national levelAt the 2011 4121 25-65 1 IPAQ Percentage of individuals with
physical activity Low level of physical activity = 39.1% 21 Moderate level of physical activity = 17.8% High level of physical activity = 43.1%
6 2003, 20042 PGHHS provinceBushehr 2004 3723 ≥ 25 BRFSS3 Percentage of individuals with
physical inactivity 4/70 28
7 2005 , 2006Golestan Golestan province 2003 5000 20-65
Running, jogging, swimming, cycling or at least 30 minutes of walking at any time of the day
Percentage of individuals with
physical inactivity 4/75 23
8 Sadeghi provinceIsfahan 2003 1520 > 25 Minnesota Percentage of individuals with
physical inactivity 27 29
9 Saidei provinceIsfahan 2001 4178 - Baecke
Mean ± standard deviation of the low level of physical activity in MET (min/ week) Men 519.4 ± 186.8 Women 460.5 ± 663.3 30 Mean ± standard deviation of the physical activity associated with work in MET (min/week) 4498.9 ± 2238.9 3621.6 ± 2667
10 Sadeghi provinceIsfahan 2002 12514 > 19 Baecke
Percentage of individuals with regular physical activity
519.4 ± 186.8 31
11 Sarrafzadegan provinceIsfahan 2000 4178 - Baecke
Percentage of individuals with low or moderate physical activity
4498.9 ± 2238.9 3621.6 ± 2667 12 Mousavi provinceIsfahan 2005 6331 - Baecke Percentage of individuals with
physical inactivity 7/75 33
13 Bahonar provinceIsfahan 2001 12541 40/38±
30 /14 Baecke
Percentage of individuals with low
physical activity 5/84 34
1. International Physical Activity Questionnaire 2. Persian Gulf Healthy Heart Study
Numb
er Author Study
location Publication year Sample size groupAge Measure Reporting method Results (physical activity) Reference
14 Hajian-Tilaki An area in the north of Iran 2007 3600 6/13 ± 38 Not specified
Exercise (h/w) ≥ 2 (h/w) = 79.2% 35 ≥ 3-5 (h/w) =
20.8% Physical activity at work (low, moderate,
high) Low level = 64.3%
Low level of physical activity (very low, low, high, very high)
Low and very low levels of physical activity = 81.8%
15 Hajian-Tilaki Babol 2008 1200 12 - 17 Baecke Percentage of individuals with low physical activity
High, moderate, and low physical activity during recreational activities was 2.9%, 79.4%, and 17.8%, respectively. 36
16 Dastgir An area in the north of Iran 2005 300 > 18
National Health and Nutrition
Examination Survey
Percentage of individuals with the physical activity associated with recreational activities High = 8.7% 37 Moderate = 75.9% Low = 9.6% 17 Ghodousi provinceTehran 2001 1100 20-69 Lipid Research Clinic
Percentage of individuals with low, moderate, and high physical activity
62.8 13
24.2 38
18 Azadbakht provinceTehran 2001 926 40-60 IPAQ
Percentage of individuals with low, moderate, and high physical activity
Low = 45% Moderate = 30%
High = 25% 39
19 Mirmiran provinceTehran 2000 840 18-74 Lipid Research Clinic
Percentage of individuals with low, moderate, and high physical activity
Low = 57% Moderate = 30% Vigorous = 13% 40 20 Mirmiran provinceTehran 2000 462 16< Lipid Research Clinic
Percentage of individuals with low, moderate, and high physical activity
Low = 52.5% Moderate = 31.5%
High = 16% 41
21 Sabet provinceTehran 2009 836 20 ≤ Lipid Research Clinic
Percentage of individuals with high physical activity, moderate physical activity, and physical inactivity High = 17.8% Moderate = 17.5% Physical inactivity = 64.2% 42
22 Hadaegh provinceTehran 2007 3444 20 ≤ Lipid Research Clinic
Percentage of individuals with low, moderate, and high physical activity
Low = 39%
High = 61% 43
23 Harati provinceTehran 2005 8212 20< Modifiable Activity Questionnaire
Percentage of individuals with low, moderate, and high physical activity
Low = 66% Moderate = 12%
High = 22% 44
24 MONICA provinceBushehr 2003 1574 25-64 MONICA Percentage of individuals with
Numb
er Author Study
location Publication year Sample size groupAge Measure Reporting method Results (physical activity) Reference
25 Motefaker Yazd province 2007 1500 20< IPAQ
Percentage of individuals with physical inactivity, sufficient physical activity, and high physical activity Physical inactivity = 67.3% Sufficient physical activity = 15% High physical activity = 17.7% 45
26 CASPIAN III هعلاطم national levelAt the 2010 5623 10-18
At least 30 minutes of daily exercise that leads to heavy sweating or increased respiratory or heart rate. Percentage of individuals with physical activity Low = 84.9% High = 15.1% 19
27 CASPIAN IV هعلاطم national levelAt the 2012 14683 6-18
At least 30 minutes of daily exercise that leads to heavy sweating or increased respiratory or heart rate. Percentage of individuals with physical activity Inactive = 34.11% Active = 65.89% 20 28 هعلاطم CASPIAN IV هدننک نییعت لماوع هعلاطم نزو تلالاتخا At the national level 2012 22841 6-18 At least 30 minutes of daily exercise that leads to heavy sweating or increased respiratory or heart rate. Percentage of individuals with physical activity Inactive = 23.48% Active = 76.52% 46
29 Emdadi Hamedan province 2015 866 40-64 Questionnaire of physical activity self-efficacy Percentage of individuals with physical inactivity or insufficient physical activity 57 47
30 Moradi Kurdistan province 2005 2494 08/39±
37/14 Physical inactivity is defined as a low level of activity. It means no or little physical activity at home, work, or during recreation or outdoor activities and traveling. Percentage of individuals with physical inactivity 16.9 48
31 Moradi Kurdistan province 2009 997 77/39±
24/14 Physical inactivity is defined as a low level of activity. It means a minimum duration of 150 min of normal physical activity or 60 min of vigorous physical activity per week at home, work, during recreation, or in outdoor activities and traveling. Percentage of individuals with physical inactivity 26.8 48
Numb
er Author Study
location Publication year Sample size groupAge Measure Reporting method Results (physical activity) Reference
32 Sanaeinasab Khorramabad 2013 1551 12-14
The amount of time allocated to physical activity in the past week
Percentage of individuals with
physical inactivity 87.1 49
33 Soltanian provinceBushehr 2005 2579 15-19 IPAQ Percentage of individuals with physical activity Physical inactivity = 58.3% Minimum activity = 23.8% Health-enhancing physical activity = 17.8% 50
34 Pazoki provinceBushehr 2007 335 25-64 BRFSS Percentage of individuals with physical activity
Moderate = 26.59%
High = 3.61% 51
35 Emdadi Hamedan province 2016 866 40-64 IPAQ-S Percentage of individuals with physical activity Low physical activity = 57% Vigorous physical activity = 19.3% 52
36 Ramezankhani Shahr-e Kord 2016 308 15-18
Researcher-made and based on the Health Belief Model Percentage of individuals with physical activity Low physical activity = 70.1% Moderate level of physical activity = 27.3% Vigorous physical activity = 2.6% 53
37 Moradi Sanandaj 2016 2506 10-12 MAQ Percentage of individuals with
physical activity Insufficient physical activity = 40.90% Sufficient physical activity = 59.09% 3
38 Noormohammadpour national levelAt the 2017 7889 30-70 GPAQ Percentage of individuals with physical activity Low physical activity = 40% Moderate physical activity = 27.2% Vigorous physical activity = 21.8% 54
39 Mohebi national levelAt the 2019 30541 18-64 GPAQ
Percentage of individuals with insufficient physical activity
Table 9: Summary of the results of some cohort studies evaluating the physical activity levels in different people
Number Author Study type Publication year
Sample
size Age group Measure Results (physical activity) Reference
1 Eslami Tehran
Lipid Study 2018 1490 ≥ 60
-The prevalence of low physical activity decreased from 40% to 26% in men from 2002 to 2014, while it has been about 50% in women with no significant difference.
55
2
Khosravi-Boroujeni Iran Cohort 2017 6500 ≥ 35
-The mean amount of physical activity was 863.4, 766.3, and 775.1 METs/hr in 2001, 2007, and 2013, respectively.
Overview of some Persian studies in physical activity in recent years in Iran
Apart from the national STEPs studies in Iran, many studies have investigated the level of physical activity in different groups in the past 10 years. Given various ages, genders, jobs, and study designs, they reported different rates of low physical activity. We selected some of these studies and summarized the results in Table 10.
Given the different definitions for low, moderate, and high levels of physical activity in the studies, it is not possible to compare the results with each other.
Target group Sample size Level of inactivity Publication year Title Reference
Students of the University of Tabriz and the Tabriz University of Medical Sciences
768 39.8% of the students of the Tabriz University of Medical Sciences are at a
dangerous level of physical activity 2007-2008
Comparison of physical activity of Tabriz University of Medical Sciences students with Tabriz University
(57)
Residents in Babol by multi-stage sampling
method 2500
The average duration of vigorous, moderate, and light physical activities were 7.3, 8.5, and 2.4 h/w, while the average duration of sedentary activity was 17.4 h/w.
2008-2009 Study on physical activities in Babol city (58) Female students
of high schools in
Isfahan 240
The rate of physical inactivity was 26.5%
in adolescents 2008-2009
Patterns of physical activity in female adolescents in Isfahan
and its affecting factors (59) Elderly in Isfahan
using cluster and multi-stage sampling method
350 The appropriate level of physical activity was 13.7% 2010-2011 Assessment of the physical activity of the elderly
population of Isfahan, Iran (60) Tehran residents 7285 The prevalence of physical inactivity was 69.8% in the target population 2010-2011
Physical inactivity and related factors in an adult Tehranian population: Tehran Lipid and Glucose Study
(61) Adolescents in district
5 of Tehran 543
The mean frequencies of exercise were 3.2 and 4.2 days a week in female and
male adolescents, respectively 2010-2011
Evaluation of some diet habit and physical activity in
adolescents in Tehran (62)
Children affected by autism in the elementary schools of Tehran
68 91% of these children (90% of the boys and 94% of the girls) had low levels of
physical activity. 2012-2013
Investigating the level of daily physical activity in children with high functioning autism and its relation with age and autism severity
(63)
Workers of the Sanat
Khodro 133
19.2% of the workers exercised regularly 53.3% of the workers exercised occasionally
26.7% of the workers never exercised
2013-2014
Examining the association between musculoskeletal disorders, physical activity and quality of life for workers in an auto parts manufacturing industry
(64)
Table 10: Summary of the results of some Persian studies evaluating the physical activity levels in different people in recent years in Iran
Target group Sample size Level of inactivity Publication year Title Reference
Female students of 6
high schools 615
Light physical activity = 46.2% Moderate physical activity = 28%
Vigorous physical activity = 25.8% 2013-2014
Application of BASNEF1 model
in regular physical activity evaluation of high school girls in Hamadan
(65) the female staff
of Kermanshah University of Medical Sciences
101 Low physical activity = 39.6%Moderate physical activity = 55.4%
Vigorous physical activity = 5% 2014-2015
Effect of physical activity on body composition and quality of life among women staff of Kermanshah University of Medical Sciences in 2013
(66) Elderly hospitalized
in the CCU and post-CCU wards in the Hospitals in Ilam city
240
Regular and moderate physical activity = 8.3%
Regular and light physical activity = 28.3% Low physical activity = 32.5%
Physical inactivity = 25.8%
2014-2015 Physical activity among elderly people with heart disease (67)
Female high school students using a random multi-stage sampling method 230 Active = 32% Inactive = 68%
Results of the IPAQ questionnaire showed that 68%, 28%, and 2% of the active individuals had light, moderate, and vigorous physical activity, respectively.
2014-2015
Level of physical activity among girl high school students in Tarom county and relevant factors
(68)
Nurses working in 27 hospitals in Tehran 553
Excellent physical activity = 18.8% Good physical activity = 25.9% Moderate physical activity = 34.2% Poor physical activity = 20.3%
2015-2016 Factors associated with nurses lifestyle in nurses of Tehran
hospitals in 2012 (69)
Male students living in residential halls of the Tabriz University of Medical Sciences
260 Mild physical activity = 23.5%Moderate physical activity = 48.5%
Vigorous physical activity = 28.1% 2016-2017
The status of physical activity based on the health belief model in dormitory students of Tabriz University of Medical Sciences
(70) Female and male
students from 7 faculties of the Gilan University
400 Low physical activity = 62.5% 2016-2017
Evaluation of the level of physical activity, physical fitness, obesity, and musculoskeletal abnormalities in university students
(71)
Workers of the Basij Organization of the Medical Society of Gilan Province
101 60% were inactive with the mean age of 40.7 years old 2017-2018
Factors associated with physical activity in ringleaders of righteous of Gilan medical society Basij organization: Applying the transtheoretical model
(72) Hormoz residents
using the double stage sampling method
400 Regular physical activity = 37% 2017-2018 Lifestyle of Hormoz island residents: A cross-sectional
study (73)
Overweight pregnant women in Urmia
county 120
The mean physical activity was
1.14 + 2.65 MET/min 2018-2019
Evaluation of nutritional status and physical activity level in
overweight pregnant women (74)
1. . B= Beliefs and Evaluation of Behavioral Outcome, A= Attitude toward the Behavior, SN= Subjective Norms, EF= Enabling Factors
Overview of interventions for physical activity promotion in Iran
Given the available studies, the studies on "the effect of various interventions on physical activity in Iran" are limited. However, some studies have investigated the issue in different groups, including children, adolescents, young people, women, pregnant women, and the elderly.
Children
In a study by Kordi et al. (2012), the authors indicated that a physical activity development program by trained physical education teachers in nursery schools is an effective and applied intervention to increase the level of basic motor skills in preschool children in Iran (75).
Adolescents and young people
A study by Ahmadi et al. (2018) reported in the age group of adolescents and young people, the motivation for physical activity and social-cognitive patterns are important in physical activity levels. They reported that personal knowledge, social support by family and friends, enjoyment from physical activity, and self-efficacy are positively correlated with the level of physical activity (76).
A study by Solhi et al. (2012) evaluated the effectiveness of implementing educational programs in schools. The result showed the effectiveness of the theory of planned behavior on physical activity promotion in school students. They concluded that educational planning based on active learning in the educational system of Iran can change the personal attitudes toward physical activity by making a positive attitude toward physical activity and increasing personal knowledge (77).
A study by Estesbari et al. (2010) suggested the interventions including lectures, free discussions, pamphlets, educational booklets, essay writing and wall newspaper competitions, sports competitions, and film presentation in order to increase the level of physical activity in adolescents and young people (78).
A study by Kelishadi et al (2010) studied the physical activity promotion in female school students and their mothers as part of the national CASPIAN study. The authors could improve the generalized and abdominal obesity indices by educational courses and increasing personal knowledge (79). A study by Tamimi et al. (2015) suggested social support by family as an effective factor in the interventions based on the health promotion model. They reported that motivating families to support adolescents can be an effective step in physical activity promotion in this group (80).
A study by Asefi et al. (2015) suggested that music can be effective in increasing the physical activity duration in
addition to increasing pleasure. Also, music can be used to manage the intensity of physical activity (81).
A study by Najafabadi et al. (2017) investigated the effect of mental training on the promotion of physical activity-related behaviors in adolescent girls. They reported that one of the most effective ways of physical activity-related behavioral reinforcement is making positive attitudes and mental training (82).
A study by Ahmadi et al. (2018) suggested that web-based interventions using Telegram application can be useful in improving the psychological variables associated with physical activity in inactive adolescents (76).
Women and pregnant women
A study by Qaderpanah et al. (2015) investigated the effect of face-to-face education based on the 5A self-management model on physical activity. The results indicated a positive association of motivating and attitude change with the physical activity-related behavior in individuals who had received face-to-face education based on the 5A self-management model (83).
In a study by Shakeri et al. (2012), the researchers encouraged the participants to increase their physical activity levels by holding group-based educational courses. They reported that the group-based educational program I increased the physical activity levels during pregnancy and recommended the use of these programs in the associated clinics (84). In a study by Eskandari et al. (2015), the participants were encouraged to increase their physical activity levels using stimulating measures including video CDs, booklets, free discussion classes, and lectures depending on the stage of behavior change. Finally, it was reported that the implementation of interventional programs based on the behavior change pattern can improve physical activity behavior (85).
A study by Amini et al. (2014) reported that web-based and multimedia-based educational interventions including virtual teaching via SMS, E-mail, online messages, or educational videos can increase the physical activity levels and prevent inactivity-related diseases (86).
In a study by Rassafiani et al. (2015), an intervention program with the ability to record the number of daily steps using electronic smart devices was introduced. They reported that the intervention not only increased the physical activity but also reduced the sitting hours (87).
The approach of two studies by Ayati (2014) and Saberi (2018) was to investigate the effect of self-efficacy on the
activity. The participants reported that yoga and Pilates courses helped in their mental health and happiness in addition to improving their physical activity (88, 89).
The elderly
A study by Karimi et al. (2015) reported that 6 structures of the trans-theoretical model (self-awareness enhancement, dramatic relief, social self-liberation, environmental re-evaluation, helping relationships, and social liberation) and interventions including group discussion, brainstorming, reminiscence, and questioning can help identify the facilitators of physical activity and promote physical activity in the elderly (90).
A study by Mokhlesi et al. (2019) intended to develop a social marketing model to promote physical activity in a middle-aged population. In this study, standard, methodological, pleasant, and feasible physical activities with the costs as low as possible and best access conditions could encourage middle-aged individuals to physical activity (91).
A study by Amirzadeh et al. (2016) investigated the effect of educational intervention based on the health belief model on the physical activity levels of the elderly. They reported that the health belief model, which is a cost-effective model analyzing the nature of preventive health behavior, can be a behavioral predictor in the physical activity of the elderly. The study suggested that the health belief model is effective as
activity education using this model promotes the behavior of the elderly women (92).
Healthcare Personnel
Studies on health volunteers by Emami (2011) (93) and on the staff of health centers by Tabatabaei (2012) (94) indicated that interventions based on planned education in the form of educational courses were effective in improving the awareness and attitude toward physical activity. Therefore, educating the healthcare personnel on this issue is recommended.
Patients
Given the effect of education on the physical activity levels in patients, two studies evaluated the effect of education on diabetic patients. A study by Lari (2018) investigated the effect of education based on the Health Promotion Model (HPM) using a multimedia-based approach on physical activity in diabetic patients. In this study, each patient and one of his/her visitors were instructed on physical activity using an educational CD. The method was reported to increase the physical activity levels in the patients (95). Moreover, a study by Mahdizadeh et al. (2013) investigated the effect of education on the promotion of physical activity in diabetic women using the social cognitive therapy model. They reported that the intervention resulted in increasing the physical activity of the patients (96).
Situation analysis of current policies in physical activity
Situation analysis of the current policies in physical activity provides plenty of information that is useful in planning (97). Current situation analysis will contribute to the exchange of information and experiences. This situation analysis indicates which policy can be used in the current situation, thereby providing a foundation for designing and implementing a national strategic program with the collaboration of all organizations (97). To achieve these goals, it is recommended to analyze the physical activity status using a Health Enhancing Physical Activity Policy Audit Tool (HEPA PAT) (97). This tool provides the requirements for the surveillance of the physical activity-enhancing policies and includes a method of appropriate collection and distribution of the national policies. This audit tool involves the background information of the country, present and previous documents and rules and their developments, the scope and content of the associated policies and target groups, experiences in policy implementations, progressions and challenges of the policies, and reports evaluating the present plans (97).
Evaluation of the policies using a policy audit tool provides a comprehensive overview of the current policies on health-enhancing physical activity and can identify the consistencies or inconsistencies of the policies as well as potential shortcomings (84). The application of this tool for evaluation allows the collaboration of the governmental agencies with the organizations associated with health-enhancing (97). Moreover, it can facilitate further communications, help in the implementation of strategic plans and joint actions, improves the collaboration of agencies in the development and implementation of future policies, and ultimately, introduces the priorities of policy-making and planning (97).
The following results are obtained from the situation analysis
of the physical activity status in Iran using Health Enhancing Physical Activity Policy Audit Tool (HEPA PAT):
In the management and mutual co-operation of the organizations at the national and provincial levels, we need a revision and planning on physical activity.
In the evaluation of the macroplanning and main documents, the problem is the little work done in the fields of active environment, active society, and active system. Physical activity development programs have been
neglected in some groups including children younger than 6 years old, the elderly, and the disabled.
There is no connection and integrity between the present organizations and documents in physical activity.
Provincial plans should receive more support.
The counseling and participation of the authorities associated with physical activity need to improve by focusing on the public sector, universities, executives, front-line staff, people affected by the policies, and the private sector.
In the evaluation of the national macroplanning and documents for physical activity development, the reports are limited and more work should be done. Investment in physical activity in various fields is limited and needs to be supported.
Capacity building in physical activity by the national TV channels should be supported.
Given the prevalence of low physical activity in the majority of Iran population and the analysis of the current status of physical activity, there is a need for a national program to increase the physical activity levels with the collaboration of different organizations.
Physical activity barriers in Iran
The important point in the prevalence of low physical activity is the evaluation of the physical activity barriers. Finding these barriers is necessary to provide efficient solutions.
There are limited studies on the physical activity barriers
in Iran in different populations and age groups. However, a summary of the barriers suggested in the studies is presented in Table 11.
Table 11: Physical activity barriers according to the suggestions by studies conducted in Iran
1 Socioeconomic barriers Unfavorable economic condition (98) High costs of exercising (98-102)
Work-related problems and long working hours (103) 2 Cultural barriers Social beliefs and cultural issues (4) Lack of safe environments for physical activity (4,100)
Cultural physical activity barriers for women (101) 3 Personal barriers
Lack of enough time (98-02) Lack of self-esteem (104)
Lack of motivation, and laziness (104,105) Illnesses, pain, injury, disability, fatigue (99,102)