Economics of Education Review 19 (2000) 17–20
www.elsevier.com/locate/econedurev
How should we measure the effect of ability grouping on
student performance?
D.I. Rees
a,*, D.J. Brewer
b, L.M. Argys
aaDepartment of Economics, University of Colorado at Denver, Denver, Campus Box 181, P.O. Box 173364, Denver, CO
80217-3364, USA
bRAND, 1700 Main Street, Santa Monica, CA 90401, USA
Received 1 February 1998; accepted 15 July 1998
Abstract
In this volume, Betts and Shkolnik [Betts, J. R., & Shkolnik, J. L. (1999) The effects of ability grouping on student math achievement and resource allocation in secondary schools.Economics of Education Review, 19, 1–15] argue that studies that compare students in tracked versus untracked classes overestimate the impact of tracking on student achieve-ment by not adequately controlling for student ability and motivation. In this paper we discuss the shortcomings of their analysis and reinterpret their results. The data used by Betts and Shkolnik do not allow one to accurately classify tracked and untracked classroom, since identification of heterogeneous classes is impossible. They compare ability-grouped students in schools that report formally engaging in tracking to ability-ability-grouped students in schools that track only informally. Our interpretation of their results suggests that there is little difference in student performance and resource allocation between schools that formally and informally group students by ability.[JEL I20]1999 Published by Elsevier Science Ltd. All rights reserved.
Keywords:Resource allocation; Educational economics; Efficiency
1. Introduction
There is a great deal of controversy surrounding the practice of ability grouping or tracking in America’s schools. On the one hand, the education establishment appears to consider tracking as unambiguously detrimen-tal to student learning. For instance, the president of Tea-chers College at Columbia University recently told the New York Times that research showed that putting stu-dents of varying abilities in the same class does not hurt fast learners, but can help slow learners (Sengupta, 1997). In keeping with this view, there has been con-siderable movement towards eliminating the practice of grouping students according to ability.1
* Corresponding author. E-mail: [email protected]
1For example, data from theSchools and Staffing Survey
sug-gest that 20% of school with programs for gifted children in
0272-7757/99/$ - see front matter1999 Published by Elsevier Science Ltd. All rights reserved. PII: S 0 2 7 2 - 7 7 5 7 ( 9 8 ) 0 0 0 5 0 - 8
On the other hand, a number of recently published art-icles have called into question this conventional wisdom. Work by Argys, Rees and Brewer (1996) and Hoffer (1992), suggests that tracking creates winners and losers. Students placed in upper-track classes benefit in terms of achievement with higher scores on standardized tests, but students placed in lower-track classes are clearly hurt.
The latest contribution to the debate over tracking by Betts and Shkolnik (1999) [henceforth “B and S”] is another important addition to the literature which chal-lenges the conventional wisdom. They find that tracking helps some students but harms others. However, they argue that prior work failed to adequately control for unmeasured factors such as motivation, and therefore
18 D. Rees et al. / Economics of Education Review 19 (2000) 17–20
overestimated the magnitude of these differential effects. In contrast, we believe that B and S have interpreted their results incorrectly.
2. Student comparisons and the effect of tracking
In their empirical work, B and S compared students in high, middle and low ability classes at schools that tracked, with students in high, middle and low ability classes at schools that supposedly did not track. While this is an interesting approach, it does not strike us as the correct comparison; indeed it is rather like comparing apples to apples and finding little difference.
B and S determined whether a school practiced track-ing based on an assessment made by the school principal. The level of the class (i.e. whether the class was com-posed of high, middle or low ability students) was based on answers to a teacher questionnaire. B and S investi-gated the effects of tracking by comparing the achieve-ment of students in classes of similar composition across the two types of schools.
Previous researchers were interested in a completely different comparison. If a school principal claims that his or her school does not track and yet teachers in that same school can divide their classes based on the average abilities of their students, then clearly there is informal tracking taking place. Thus, the achievement differential estimated by B and S should be interpreted as the effect of formal versus informal tracking, and is conceptually distinctfrom the effect of placement in a class composed of high ability students versus placement in a heterogen-ous class. Therefore, statements such as, “although the paper does find some evidence that grouping has differ-ential effects across students of differing ability levels … the sizes of these effects are shown to be far smaller than previous estimates” (p. 28) are misleading. The fact that formal and informal tracking have similar effects has no bearing on previous results. In order to make this study comparable to previous studies the authors would have to have been able to observe students in a heterog-enous environment. Yes, B and S identify students in schools that, according to their principals, are not tracked, but teachers in these same schools are dis-tinguishing between five categories of classes, ranging from classes composed of students of “much higher than average” ability to those composed of students of “much lower than average” ability. Call it informal, but when a teacher is in front of a class composed of students whose academic ability is much lower than average, that is
tracking in the traditional sense of the word.
Hoffer (1992) clearly considered informal and formal tracking to be equivalent. He wrote, “… past experience has shown that some schools that in fact have ability grouping do not have a formal policy of grouping: stu-dents are informally encouraged to take or discouraged
from taking certain classes by guidance counselors, tea-chers, and peers, even while admission to all classes are formally open to all” (p. 212). In his analysis, Hoffer made sure to classify students in these schools in the same fashion as he did students in schools with formal tracking policies. In order to accomplish this classi-fication, he turned to information collected from, “teach-ers, school documents, and—when the teacher reports and documents proved ambiguous or contradictory-phone calls to key informants” (p. 212). Hoffer, in fact, found that only 15% of the seventh grade math students in his sample were in schools that did not track, whereas B and S, using the same data source (The Longitudinal Study of American Youth or LSAY)found that fully 27 percent of their sample were in schools that did not track.2Obviously, relying simply on the assessments of
principals understates the amount of tracking in the data. This problem alone would tend to bias any estimates of the effect of tracking toward zero. In addition, because teachers were not given the option of categorizing their class as heterogenous, B and S are unable to utilize a more suitable measure of tracking.3
In our 1996 analysis we relied on teacher assessments as to the composition of a particular class. This method too has its drawbacks.4 First, teachers will not all use
the same criteria in defining classes of different levels. Second, as pointed out by Loveless (1997), classes that seem heterogenous to a teacher may lack students from the extremes of the ability distribution.5The answer to
these issues is better data. Ideally, researchers would be able to access test scores from all students in each class in a school, and in a large number of schools. Tracking information would be gathered from multiple survey sources—district and school administrators, teachers, and students—and perhaps supplemented by school administrative records, and on-site observation. Only then can we be sure that we are really measuring the effect of tracking or detracking on student outcomes.
2It should be noted that the B and S sample included students
from grades 7 through 12. Because tracking has been shown to be more prevalent in higher grades the discrepancy between these figures is especially worrisome.
3B and S state that teachers would naturally classify
heterog-enous classes as “average”. But it is unclear to us how a teacher with a heterogenous class would respond to the question, “how would you rate the average academic ability of the students in this class …? Much higher than average, somewhat higher, about average, somewhat lower, much lower than average?”
4These are discussed in more detail in Brewer, Rees and
Argys (1995).
5A priori, it is not clear to us what the effect might be of
19 D. Rees et al. / Economics of Education Review 19 (2000) 17–20
3. Resources and tracking
B and S devote a considerable portion of their paper to showing the effect of ability grouping on resource allocation. They find that neither class size nor teacher characteristics vary much according to whether a student is in a tracked or detracked environment. This finding is counter to claims made by Oakes (1990, 1992) and others that tracking leads to the unequal structuring of resources across classes such that upper-level classes receive the better teachers, smaller classes, computers, etc.
However, the B and S analysis again utilizes a track-ing measure based on the principal’s assessment as to whether the school sorts its math students into classes according to ability. In effect, they simply found that schools with and without formal tracking policies have similar patterns of resource allocation.
Using a sample of tenth graders drawn from the
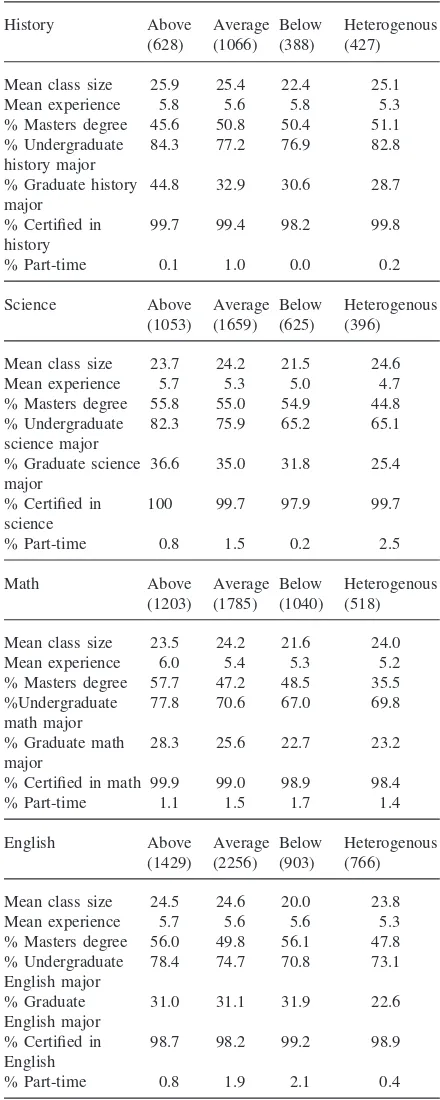
National Educational Longitudinal Study (NELS) (National Center for Education Statistics, 1992), we re-examined the relationship between tracking and resources. Table 1 shows the mean value of selected resources for four subjects by class track.6The first row
of the table suggests that average class size is actually lower in classes composed of below average students in all subjects; e.g. for English, the mean class size is 24.5 in above average and average classes, but is 20.0 in below average classes. This result, then, does not support the common contention of detracking proponents that less able students are consigned to larger classes. How-ever, there is some evidence to support their position with respect to other resources.
For example, while teachers appear to be about equ-ally experienced across tracks in English and history, there is a sizeable gap (0.7 years in each case) in mean years of total experience between above and below aver-age mathematics and science classes. Similarly, for these subjects in particular, teachers of high-ability classes are much more likely to have undergraduate and graduate majors in mathematics and science than those teachers assigned to low ability classes: 77.8% (82.3%) of teach-ers of above average classes have undergraduate degree majors in mathematics (science) compared to just 67.0% (65.2%) in below average classes. The differences are again less pronounced in English and history. There is far less variation across tracks in terms of whether the teacher is certified or whether the teacher has a Masters
6Class track was determined from teacher responses to the
question: “[w]hich of the following best describes the achieve-ment level of the 10th graders in this class compared with the average 10th grade student in the school? Higher achievement levels, average achievement levels, lower achievement levels, or widely differing achievement levels”.
Table 1
Resources by track for sample of 10th graders from NELS
History Above Average Below Heterogenous (628) (1066) (388) (427)
Mean class size 25.9 25.4 22.4 25.1
Mean experience 5.8 5.6 5.8 5.3
% Masters degree 45.6 50.8 50.4 51.1 % Undergraduate 84.3 77.2 76.9 82.8 history major
% Graduate history 44.8 32.9 30.6 28.7 major
% Certified in 99.7 99.4 98.2 99.8 history
% Part-time 0.1 1.0 0.0 0.2
Science Above Average Below Heterogenous (1053) (1659) (625) (396)
Mean class size 23.7 24.2 21.5 24.6
Mean experience 5.7 5.3 5.0 4.7
% Masters degree 55.8 55.0 54.9 44.8 % Undergraduate 82.3 75.9 65.2 65.1 science major
% Graduate science 36.6 35.0 31.8 25.4 major
% Certified in 100 99.7 97.9 99.7 science
% Part-time 0.8 1.5 0.2 2.5
Math Above Average Below Heterogenous (1203) (1785) (1040) (518)
Mean class size 23.5 24.2 21.6 24.0
Mean experience 6.0 5.4 5.3 5.2
% Masters degree 57.7 47.2 48.5 35.5 %Undergraduate 77.8 70.6 67.0 69.8 math major
% Graduate math 28.3 25.6 22.7 23.2 major
% Certified in math 99.9 99.0 98.9 98.4
% Part-time 1.1 1.5 1.7 1.4
English Above Average Below Heterogenous (1429) (2256) (903) (766)
Mean class size 24.5 24.6 20.0 23.8
Mean experience 5.7 5.6 5.6 5.3
% Masters degree 56.0 49.8 56.1 47.8 % Undergraduate 78.4 74.7 70.8 73.1 English major
% Graduate 31.0 31.1 31.9 22.6
English major
% Certified in 98.7 98.2 99.2 98.9 English
% Part-time 0.8 1.9 2.1 0.4
20 D. Rees et al. / Economics of Education Review 19 (2000) 17–20
degree in any subject. Overall, these data suggest a mixed picture in terms of the disproportionate allocation of resources across tracks.7
4. Concluding thoughts
It is encouraging to see high quality econometric research being done on institutional schooling issues like ability grouping. We believe that economists have a use-ful contribution to make to this and other educational policy debates.
B and S argue that past studies comparing students in tracked vs. untracked classes overestimated the impact of tracking on student achievement by not adequately controlling for student ability. However, we believe that their attempt to control for student ability by comparing the achievement of students in classes of similar compo-sition is not the correct approach and that their estimates should be interpreted as the effect of formal versus infor-mal tracking. B and S show that, controlling for class composition, neither class size nor teacher characteristics vary much according to whether a student is in a tracked or detracked environment. This suggests to us that there are few observable differences between schools with and without formal tracking policies. Given this similar pat-tern of resource allocation, it is not surprising that B and S find that students in “tracked” and “untracked” schools have similar achievement gains.
References
Argys, L.M., Rees, D.I., & Brewer, D.J. (1996). Detracking America’s schools: equity at zero cost?Journal of Policy Analysis and Management,15(4), 623–645.
Betts, J.R., & Shkolnik, J.L. (1999). The effects of ability grouping on student math achievement and resource
allo-7Several points are worth making in connection with our
consideration of classroom resources. First, we are only able to document differences across tracks in measuredclassroom characteristics. It is quite possible, for example, that more able and motivated teachers are assigned to upper-level classes but if these traits are independent of years of experience and formal qualifications we will not have adequately captured this inequi-table distribution across tracks. Second, our analysis concerns only classroom resources rather than “opportunity to learn” (OTL) more broadly (McDonnell, 1995). Third, it is not clear what effect, if any, that a differential resource distribution across tracks has on student achievement. Many researchers argue that there is little evidence of a systematic relationship between schooling characteristics such as class size and teacher experience and standardized test scores (Hanushek, 1989), although this view is not unchallenged (Hedges, Laine & Green-wald, 1994).
cation in secondary schools. Economics of Education Review,19, 1–15.
Brewer, D.J., Rees, D.I., & Argys, L.M. (1995). Detracking America’s schools: the reform without cost?Phi Delta Kap-pan,77(3), 210–215.
Figlio, D. N., Page, M. E. (1998). Ability tracking, school choice and social mobility: Does separation increase equal-ity? Institute for Research on Poverty Discussion Paper. University of Wisconsin.
Hanushek, E. (1989). The impact of differential expenditures on school performance.Educational Researcher,18(4), 45–62. Hedges, L., Laine, R., & Greenwald, R. (1994). A meta-analysis of the effects of differential school inputs on student out-comes.Educational Researcher,23(3), 5–14.
Hoffer, T.B. (1992). Middle school ability grouping and student achievement in science and mathematics. Educational Evaluation and Policy Analysis,14(3), 205–227.
Loveless, T. (1997).The uses and misuses of research in edu-cational reform. Presented at the State of Student Perform-ance in American Schools, Brookings Institution, Wash-ington, DC.
McDonnell, L. (1995). Opportunity to learn as a research con-cept and a policy instrument.Educational Evaluation and Policy Analysis,17(3), 305–322.
National Center for Education Statistics (1992).NELS first fol-low-up: student component data file user’s manual. National Center for Education Statistics, Washington, DC. Oakes, J. (1990).Multiplying inequalities: the effects of race,
social class, and tracking on opportunities to learn math and science. RAND, Santa Monica, CA.
Oakes, J. (1992). Can tracking research inform practice? Tech-nical, normative, and political considerations.Educational Researcher,21(4), 12–21.