Economics Letters 70 (2001) 183–186
www.elsevier.com / locate / econbase
Aggregation, rank, and some historical Engel curves
*
Dora L. Costa
Massachusetts Institute of Technology, Department of Economics, E52-274C, 50 Memorial Drive, Cambridge, MA 02142-1347, USA
Received 19 April 2000; accepted 20 July 2000
Abstract
I find evidence for an Engel curve rank of three in both historical and recent data within the context of polynomial Engel curves. The results have implications for specification and for aggregation of consumer demands. 2001 Elsevier Science B.V. All rights reserved.
Keywords: Engel curves; Aggregation; Rank
JEL classification: D12
1. Introduction
Estimation of Engel curves has a long history in economics; but, economic theory provides little guidance in the specification of Engel curves. The most common systems such as AIDS, translog, linear expenditure, PIGL, and PIGLOG have been favored because of their exact aggregation or representative agent properties, not because of their superior fit. Lewbel (1991) found that although most household demands could be modeled as PIGLOG, a more complicated model is required when households with very low or high expenditures are included in the sample. Hausman et al. (1995) found that Engel curves containing cubic terms in functions of expenditures fit the data better than specifications containing lower order polynomials. Such a system will be exactly aggregable provided that the rank of the matrix of coefficients is at most three (Gorman, 1981).
This note uses data on consumer expenditures from as far back as 1888–1890 to estimate rank within the context of polynomial Engel curves and to test whether the rank three condition is met when Engel curves contain up to a cubic term in the logarithm of total expenditures. The rank test is a useful prespecification test providing information on aggregation and separability. Failure to meet the
*Tel.:11-617-253-2989; fax: 11-617-253-1330. E-mail address: [email protected] (D.L. Costa).
184 D.L. Costa / Economics Letters 70 (2001) 183 –186
rank three condition in specifications containing polynomials in functions of expenditures implies that it is not possible to aggregate across different income levels in estimating consumer demands. Failure might be more likely with historical data because the Bureau of Labor Statistics had not yet perfected its interview methods. Rank may be lower in historical than in recent data because the older consumer expenditure surveys did not cover the entire income distribution.
2. Data and empirical methodology
I use consumer expenditure surveys from 1888–90, 1917–19, 1935–36, 1972–73, and 1992. The post-war surveys are a representative sample of the population. The earlier surveys were more specialized. One major difference is that they did not cover ‘slum’ or ‘charity’ families and those before 1935 did not cover higher income families. I impose several sample restrictions to make the datasets more comparable across time, to minimize income correlated demographic variation, and to exclude suspect observations or observations where demand may be unusual. I restrict all surveys to urban families, to husband and wife families, to families in the post-war period who were not receiving welfare or food stamps, and to families where the husband was aged 21–64. I exclude observations in which the share of expenditures devoted to food was less than 0.05 or greater than 0.8. In the post-war period I also exclude families containing adults over age 25 other than the husband and wife. I adjust total expenditures in the 1917–19 and 1972–73 surveys for inflation.
I estimate Engel curves of the form
2 3
9
wi5a1b1log (z)1b2log (z)1b3log (z)1xib1ui (1)
for each year of consumer expenditures where w is the share of total expenditures spent on a specific commodity group, z is total expenditures, x is a vector of demographic coefficients, and u is an error term. The expenditure shares that I examine are those devoted to food, shelter, utilities, recreation, clothing, health, education, and transportation. The demographic variables include the total number of children, the total number of children squared, the age of the household head, and the number of household members above age 18. Because of price fluctuations during the inflation accompanying World War I and because the 1917–19 survey was taken at different times, the Engel curve for 1917–19 also includes dummies (eight, including the omitted variable) indicating when the survey was taken.
D.L. Costa / Economics Letters 70 (2001) 183 –186 185
3. Results and conclusion
I reject the hypothesis that all higher order terms in Eq. (1) are equal to 0 for all commodity groups.
2 2
Thex (12) statistic for 1888–90 is 127.63 and thex (18) statistics for 1917–19, 1935–36, 1972–73, and 1992 are 201.14, 84.49, 195.82, and 41.43, respectively. I also reject the hypothesis that all cubic
2 2
terms for all commodity groups are equal to 0. Thex (6) statistic is 25.81 in 1888–90 and thex (9) statistics for 1917–19, 1935–36, 1972–73, and 1992 are 78.40, 39.24, 108.14, and 19.70, respective-ly.
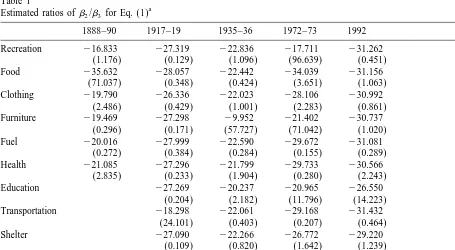
Table 1 shows that within each year the Gorman ratios are remarkably similar across commodity
2
groups. When the ratios do differ, the standard error on the ratio is large. Ax test for equality of the ratios across commodity groups cannot reject the hypothesis that the Gorman ratios are equal at the 5% level of significance. Only in 1917–19 could the hypothesis that the Gorman ratios are equal be rejected at the 10% level of significance, largely because the ratios on food and clothing are different. However, when households who had income from gardens and therefore probably had some degree of
2
self-sufficiency in food are excluded from the sample the x (8) statistic falls to 5.18.
The results indicate that polynomial Engel curve specifications with at least a cubic term are preferred to specifications with lower order terms in both recent and historical data. The findings also provide strong support for the Gorman rank condition which limits polynomial Engel curve
Table 1
a Estimated ratios ofb2/b3 for Eq. (1)
1888–90 1917–19 1935–36 1972–73 1992
Recreation 216.833 227.319 222.836 217.711 231.262 (1.176) (0.129) (1.096) (96.639) (0.451)
Food 235.632 228.057 222.442 234.039 231.156
(71.037) (0.348) (0.424) (3.651) (1.063) Clothing 219.790 226.336 222.023 228.106 230.992
(2.486) (0.429) (1.001) (2.283) (0.861) Furniture 219.469 227.298 29.952 221.402 230.737
(0.296) (0.171) (57.727) (71.042) (1.020)
Fuel 220.016 227.999 222.590 229.672 231.081
(0.272) (0.384) (0.284) (0.155) (0.289) Health 221.085 227.296 221.799 229.733 230.566
(2.835) (0.233) (1.904) (0.280) (2.243)
Education 227.269 220.237 220.965 226.550
(0.204) (2.182) (11.796) (14.223)
Transportation 218.298 222.061 229.168 231.432
(24.101) (0.403) (0.207) (0.464)
Shelter 227.090 222.266 226.772 229.220
(0.109) (0.820) (1.642) (1.239)
Observations 6407 11,849 1650 7602 1677
2 2
x (5), x (8) 8.78 14.4 4.53 9.96 3.43
a 2
186 D.L. Costa / Economics Letters 70 (2001) 183 –186
specifications to rank 3. Better fitting Engel curve specifications than those of rank 2 can therefore be used while still preserving aggregation properties.
4. Data sources
1. Sabelhaus, John, 1996. Consumer Expenditure Survey: Family Level Extracts, 1980:1–1995:1.
http: / / www.nber.org.
2. United States Department of Labor, 1986. Cost of Living of Industrial Workers in the United States
and Europe, 1888–1890. ICPSR 7711. Ann Arbor, MI: Inter-university Consortium for Political
and Social Research.
3. United States Department of Labor. Bureau of Labor Statistics, 1986. Cost of Living in the United
States, 1917–1919. ICPSR 8299. Ann Arbor, MI: Inter-university Consortium for Political and
Social Research.
4. United States Department of Labor. Bureau of Labor Statistics, 1987. Survey of Consumer
Expenditures, 1972–1973. ICPSR 9034. Inter-university Consortium for Political and Social
Research.
5. United States Department of Labor, Bureau of Labor Statistics and United States Department of Agriculture, Bureau of Home Economics et al., 1999. Study of Consumer Purchases in the United
States, 1935–1936. ICPSR 8908. Ann Arbor, MI: Inter-university Consortium for Political and
Social Research.
Acknowledgements
I gratefully acknowledge the support of NIH grant AG12658 and of the Russell Sage Foundation through their Visiting Scholar Program.
References
Gorman, W.M., 1981. Some Engel curves. In: Deaton, A. (Ed.), Essays in the Theory and Measurement of Consumer Behavior in Honor of Richard Stone. Cambridge University Press, Cambridge, pp. 7–29.
Hausman, J.A., Newey, W.K., Powell, J.L., 1995. Nonlinear errors in variables. Estimation of some Engel curves. Journal of Econometrics 65, 205–233.