Dynamics of a hybrid system of a brain neural network and
an artificial nonlinear oscillator
Norihiro Katayama *, Mitsuyuki Nakao, Hiroaki Saitoh, Mitsuaki Yamamoto
Laboratory of Neurophysiology and Bioinformatics,Graduate School of Information Sciences,Tohoku Uni6ersity,Aobayama05, Sendai980-8579,Japan
Abstract
In the brain, many functional modules interact with each other to execute complex information processing. Understanding the nature of these interactions is necessary for understanding how the brain functions. In this study, to mimic interacting modules in the brain, we constructed a hybrid system mutually coupling a hippocampal CA3 network as an actual brain module and a radial isochron clock (RIC) simulated by a personal computer as an artificial module. Return map analysis of the CA3-RIC system’s dynamics showed the mutual entrainment and complex dynamics dependent on the coupling modes. The phase response curve of CA3 was modeled regarding the CA3 as a nonlinear oscillator. Using the phase response curves of CA3 and RIC, we reconstructed return maps of the hybrid system’s dynamics. Although the reconstructed return maps almost agreed with the experimental data, there were deviations dependent on the coupling mode. In particular, we noted that the deviation was smaller under the bidirectional coupling conditions than during the one-way coupling from RIC to CA3. These results suggest that brain modules may flexibly change their dynamical properties through interaction with other modules. © 2000 Elsevier Science Ireland Ltd. All rights reserved.
Keywords:Hippocampal neurons; Field potential; Coupled oscillators; Phase resetting; Mutual entrainment; Synchronization www.elsevier.com/locate/biosystems
1. Introduction
The brain is a complex system that consists of many functional modules. Higher-order brain functions are thought to be realized though
inter-actions among these modules. For example, func-tional modules in the visual cortex have been revealed to work in parallel and hierarchically to process complex information (Felleman and Van Essen, 1991), and synchronous neuronal activities in the different modules have been anticipated to play an important role in solving the ‘binding problems’ in the brain (Milner, 1974; von der Malsburg and Schneider, 1986). This suggests practical aspects of the inter-module interactions. Therefore, in order to understand the mechanisms underlying the brain’s information processing, it
* Corresponding author. Tel.:+81-22-2177179; fax:+ 81-22-2639438.
E-mail address: [email protected] (N. Katayama).
is essential to know the dynamical characteristics of each module, as well as the nature of interac-tions among the modules.
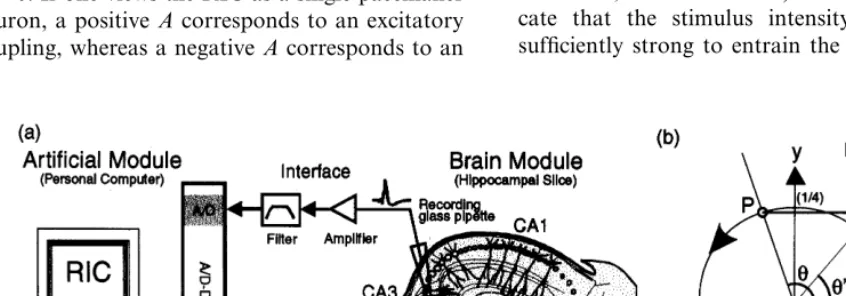
In this study, as a framework for investigating the dynamics of a multi-module system, we con-structed a hybrid system consisting of a neural network in the hippocampal CA3 region as an actual brain module and a nonlinear oscillator as an artificial module working together as a mini-mal unit representing interacting modules in the brain. In this framework, we analyzed the dynam-ics of the hybrid system under varied coupling conditions. Considering the close relationship be-tween the dynamical properties and the function of the modules, variation of the dynamics of the hybrid system implies diversity in the modules’ functions. For considering these variations, we investigated how interactions determine the func-tion of each module in a multi-module system.
2. Materials and methods
2.1. Brain module: hippocampal CA3 region
We adopted the neural network in the CA3 region of a hippocampal slice preparation (abbre-viated CA3) as the brain module. Transverse slices (0.4 mm thickness) of hippocampi were obtained from the brains of guinea pigs (300920 g) by the conventional method (Ito et al., 1989) and kept in normal artificial cerebrospinal fluid (ACSF) containing (in mM) NaCl 124, KCl 3.5, NaH2PO4 1.25, MgSO4 2.0, CaCl2 2.0, NaHCO3
22.0, and glucose 10.0 (pH 7.4), which was equili-brated with a gas mixture of 5% CO2 in O2. All
the experiments were conducted in a perfusing fluid chamber kept at 3491°C. In order to detect neural activities, we measured the extracellular field potential at the CA3 pyramidal cell layer with a single glass pipette filled with the ACSF. The potential was amplified through the band-pass filter (0.3 – 25 Hz) and sampled with 200 Hz by a personal computer (IBM-PC compatible, CPU AMD K6-233; abbreviated PC) with an A/D and D/A converter card (National Instru-ments, AT-MIO-16E-2, 12-bit precision). The PC simultaneously simulated the artificial module (see
below), which provided electric stimuli to the mossy fiber (MF) bundle with a bipolar tungsten electrode. Before starting experiments, pulse-cur-rent stimuli with an amplitude of 0.5 – 1 mA and duration of 200ms were applied every 30 s to MF. Only the slices showing stable responses to those stimuli for 30 min were used for the following experiments.
The CA3 neurons are known to have recurrent excitatory synaptic connections, which tend to cause a rhythmic neural activity. We adopted a CA3 neural network as a model of a rhythmic-acting brain module. Actually, when the ACSF was replaced with an experimental ACSF contain-ing 8.5 mM KCl and 2 mM penicillin chloride, the CA3 neurons exhibited spontaneous bursts (Hayashi and Ishizuka, 1995). The CA3 always responded with a burst to a stimulus stronger than a threshold level (0.03 – 0.07 mA). When threshold-level stimuli were applied, the neural responses were strongly dependent on the tempo-ral pattern of the stimuli. In order to study the organizing process of the response, we used threshold-level stimuli.
2.2. Artificial module:radial isochron clock
As the artificial module, we used a radial isochron clock (RIC) model to mimic a rhythmic-acting brain module, because it is the simplest model of a biological oscillator (Winfree, 1980; Glass and Mackey, 1988; Nomura et al., 1994). Fig. 1b shows the dynamics of the RIC, which is described by the following equations:
r;=Kr(1−r) (1a)
, u is the normalized ‘phase’ of the RIC’s state point ranging between 0 and 1,
TRIC is the period of the limit cycle, and K is a
constant. In this study, we set TRIC=5 s and
K . When the RIC is stimulated with an impulse, the RIC’s state point (indicated by P in Fig. 1b) is moved toward the direction of the
x-axis responsible for the stimulus intensity A
ap-proaches the point on the limit cycle (P%) along with the isochron because ofK . The relation-ship between the old phase u at P and the new phase u% at P% is described below:
u%= 1
2p arctan
sin 2pu A+cos 2pu
u+DRIC(u) (2)
where DRIC is called the phase response curve (PRC) of the RIC.
In practice, RIC was simulated by the PC, which executed real-time processing of Eq. (1)b Eq. (2). When the RIC’s phase passed across zero, the RIC was considered to have fired. At this moment, the PC generated a pulse by the D/A converter to stimulate the CA3. On the other hand, when a CA3 bursting was detected, the RIC was stimulated by an impulse with an amplitude of A. The occurrence of a CA3 bursting was detected when the band-pass-filtered field poten-tial crossed a threshold level (about 0.1 mV). Time series of the CA3 burstings and RIC firings were recorded under varied coupling modes, each for 10 min, where intensity of the stimulus to the RIC was changed fromA=0.95, −0.95 and then
A=0. If one views the RIC as a single pacemaker neuron, a positiveAcorresponds to an excitatory coupling, whereas a negativeAcorresponds to an
inhibitory one (Nomura et al., 1994). In the case of A=0, corresponding to one-way coupling from RIC to CA3, periodic stimulation with an interval of TRICis realized.
3. Results
3.1. Dynamics of inter-bursting inter6als
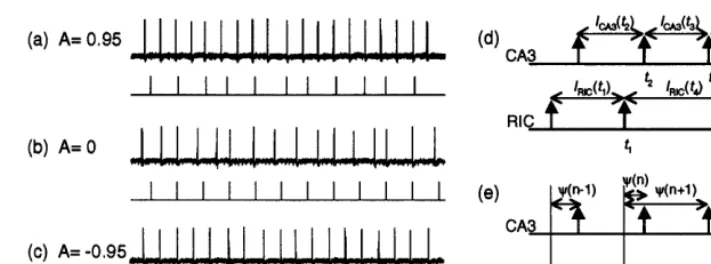
Fig. 2a – c show the bursting activities of the CA3 and the firings of the RIC under the varied coupling conditions. The CA3-RIC system exhib-ited diverse dynamics that were dependent on the coupling modes. First, we investigated the dynam-ics of the inter-bursting intervals of the CA3 ICA3
and the RIC IRIC (Fig. 3, see also Fig. 2d for
definitions).
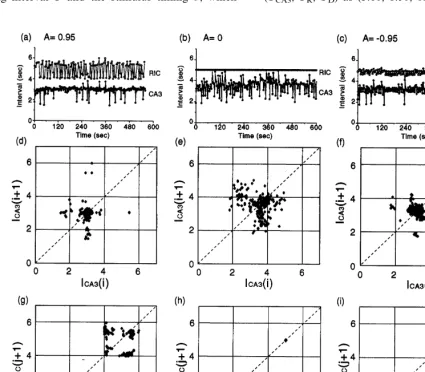
In the case of one-way coupling from RIC to CA3 (A=0, Fig. 3b), IRIC remained unchanged
while ICA3 fluctuated significantly (interval=
3.4990.67 s, mean9S.D). When the stimulus intensity for the CA3 was increased well above the threshold, CA3 burstings were synchronized to the RIC firings with a ratio of 1:1 (1:1 forced-en-trainment, not shown here). This seemed to indi-cate that the stimulus intensity used was not sufficiently strong to entrain the CA3 burstings.
Fig. 2. Observed dynamics of the CA3 and the RIC. (a – c) Field potentials of the CA3 (upper) and the output sequences of the RIC (lower) under the varied coupling modes. (d) Definitions of the inter-bursting intervals of the CA3ICA3and the inter-firing interval
of the RICIRIC. (e) Definition of the time intervalc.
When CA3 and RIC were mutually coupled (i.e. A"0), fluctuations of ICA3 seemed to be
reduced. As shown in Fig. 3a and d, ICA3 for
A=0.95 was more stable than the other cases (interval=2.9190.36 s for A=0.95 and 3.199
0.38 s forA= −0.95). Data points on the return map of ICA3 were shown to mostly concentrate
around period=3 s, but they occasionally devi-ated from the period. On the other hand, IRIC
changed frequently between two distinct intervals, about 4 and 5.5 s. Analysis of the return map did not allow us to determine the switching cycle between the intervals.
In the case of A= −0.95, RIC fired with pe-riod 2 (Fig. 3c and i), which was known from the return map IRIC(j+2)−IRIC(j) consisting of
two clusters on the diagonal line (not shown here). In contrast, periodicity of CA3 burstings was not so clear. Nevertheless, by comparingICA3
andIRIC, we obtained the following integer ratio:
mean firing interval of CA3:3.19 s mean firing interval of RIC:4.83 s:
2 3.
In addition, data points on the return map of
ICA3(i+3) versus ICA3(i) were concentrated on a
diagonal line (not shown). These results suggest that CA3 and RIC were mutually entrained with a period ratio of 3:2. As we mentioned in the case of one-way coupling, the stimulus for CA3 was not sufficiently strong for inducing forced-entrain-ment. However, even with such a weak stimulus, it is possible that CA3 and RIC cooperate to
synchronize their own activities through mutual interactions.
3.2. Dynamics of the latency of CA3 burstings from RIC firings
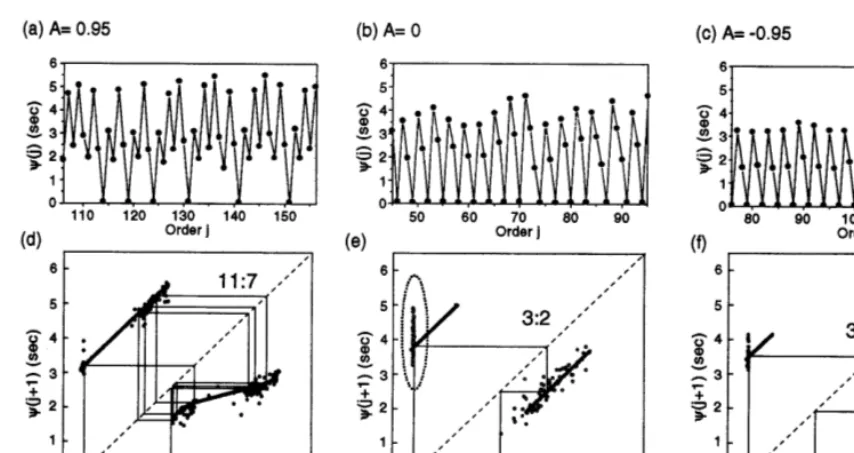
In order to determine the relationship between the CA3’s dynamics and the RIC’s ones, we ana-lyzed the time interval between the RIC firing and the latest CA3 bursting (see Fig. 2e for a dia-gram). Fig. 4a (basic plot of c) shows that c’s dynamics are seemingly complex in the case of
A=0.95. On the corresponding return map (Fig. 4d), one can clearly recognize five clusters. Since the clusters approximately form a single-valued function, the complex dynamics would be re-garded as deterministic. In the case of A= −
0.95, c’s dynamics are almost period 3 because the return map consists mainly of three clusters (Fig. 4f). This result also supports 3:2 mutual entrainment between the CA3 and the RIC. In contrast, c’s dynamics for A=0 seem to be quasi-periodic (Fig. 4b). Nevertheless, as shown in Fig. 4e, distribution of the data points on the return map are qualitatively similar to the case of
A= −0.95.
3.3. Modeling the phase response cur6e of CA3
of the CA3 to understand the dynamics ofc. We assumed the CA3 as a nonlinear oscillator, be-cause it generated bursts repetitively with an ap-proximately fixed period TCA3if no stimulus was
applied. In addition, even if the bursting interval was changed by some stimulus, the interval was restored by itself. Therefore, we investigated the phase response curve (PRC) of the CA3, which is an analyzing tool of internal structure of a nonlin-ear oscillator.
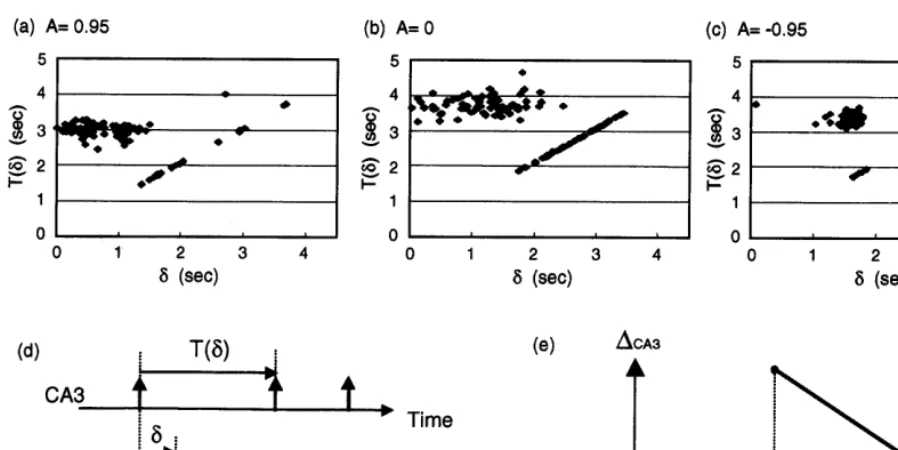
Fig. 5 shows the relationship between the burst-ing interval T and the stimulus timing d, which
were obtained from the data presented in Fig. 3. As shown in the figure, overall response charac-teristics were consistent through the coupling modes. Regardless of the coupling modes, the bursting interval T(d) changed dramatically, de-pending on d. That is, if a stimulus was applied within TR after the last CA3 bursting (dBTR),
the stimulus did not affect the bursting interval. In contrast, if a stimulus was applied after the refractory period TR, CA3 generated a burst
im-mediately TD after the stimulus. We estimated
(TCA3, TR, TD) as (3.10, 1.50, 0.10) for A=0.95,
Fig. 3. Dynamics of the CA3-RIC system under the varied coupling modes. (a – c) Basic plots of the inter-bursting intervals of CA3
(ICA3, ) and the inter-firing interval of the RIC (IRIC,) versus event time. (d – f) Return maps ofICA3corresponding to the data
Fig. 4. Return maps of the time-intervalcunder the varied coupling modes. (a – c) Basic plots ofc. (d – f) Return maps ofc. Dots indicate the experimental data. Thick lines are the reconstructed return maps; thin lines represent the stable orbits allowed in the reconstructed return maps. The entrainment ratio for the stable orbit is indicated beside the orbit.
(3.70, 1.80, 0.10) for A=0, and (3.42, 1.80, 0.10) for A= −0.95 using the least-square method. Based on these results, we modeled the CA3’s PRC DCA3 as follows (Fig. 5e):
where f(=d/TCA3) is the normalized ‘phase’ of
the CA3 ranging between 0 and 1.
3.4. Reconstructed return map ofc based on the phase response cur6es
If the CA3’s PRC fully describes the dynamical properties of CA3 under the varied coupling con-ditions with RIC, the dynamics of c could be reconstructed based on the PRCs of both oscilla-tors. Conversely, if there were disparities between the experimentally obtained and the reconstructed return maps; they indicate a nature of the CA3-RIC system’s dynamics that could not be
de-scribed within the framework of a coupled two-oscillator system.
The reconstructed return maps of c are pre-sented in Fig. 4d – f together with the experimental data. The mathematical expression of the maps is described in Appendix A. As shown in the graphs, the reconstructed maps almost agree with the experimental data. The stable orbits for the recon-structed maps indicate that the CA3 and RIC would mutually entrain with period ratios of 11:7 for A= +0.95, and of 3:2 for A=0 and for
A= −0.95. Regardless of coupling conditions, the reconstructed orbit almost covers the experi-mental data. Therefore, the actual orbit is consid-ered to wander in the neighborhood of the stable orbit predicted by the reconstructed map. Never-theless, there are deviations between the recon-structed map and the experimental data, especially in the case of one-way coupling, which is depicted by an oval in Fig. 4e. We believe the deviation indicates fluctuations in the intrinsic bursting period TCA3 just after the CA3 bursting
immediately evoked by the stimulus from the RIC, because we know the concrete cluster is
DCA3(f)=
(TCA3−T(TCA3f))
TCA3
=
!
0, 05fBTR/TCA3Fig. 5. Stimulus-to-response characteristics of the CA3 under the varied coupling modes. (a – c) Plots of inter-bursting intervalTas a function of the stimulus timingd. (d) Definition of the inter-bursting intervalTand the stimulus timingd. (e) Modeled phase response curve of the CA3 (DCA3).
constructed by the point (c(n), c(n+1))=
(TD,TCA3+TD) according to the theory (see
Appendix A). Actually, the fluctuation was significantly large in the case of one-way coupling. These results suggest that the dynamical properties of fluctuation in TCA3 changed
dependent on the coupling mode.
4. Discussion
We studied the dynamics of a hybrid system composed of an actual brain module (CA3 neural network) and an artificial module (RIC) under varied coupling conditions. Within our experi-mental conditions, the CA3 and RIC were mutu-ally entrained when they were connected bidirectionally, whereas the CA3 was not firmly entrained to the RIC under the one-way coupling. The dynamics of the hybrid system were recon-structed by combining the phase response curves of the CA3 and the RIC. The reconstructed dy-namics almost agreed with the experimental data except for the case of the one-way coupling. We
emerge in a framework such as the one we used, and such cooperation may be substantial in in-ter-module interactions in the brain. (Felleman and Van Essen, 1991).
The hippocampus is known to couple with many modules in the brain, including the sep-tum and entorhinal cortex. Therefore, the artifi-cial module coupled with the CA3 should have dynamical properties similar to the properties of those modules. In spite of this, we cannot com-pare the RIC that we adopted in this study with those modules, because properties such as phase response curves have not been clarified yet. However, it is likely the RIC shares some dy-namical properties with those brain modules, be-cause many neural systems (e.g. thalamocortical neurons (Soltesz and Crunelli, 1992) and pace-maker networks (Ayers and Selverston, 1977) were reported to have PRCs similar to that of the RIC under certain conditions. We await fu-ture studies that will reveal the dynamical prop-erties of the modules.
From the viewpoint of biosystem control, our framework is useful. Recently, the chaos control technique has shown to be successful for de-creasing as well as inde-creasing periodicity of the CA3 bursting behavior (Schiff et al., 1994). This technique, like ours, is based on the mutual in-teraction between biological tissue and an artifi-cial module. In our study, the rhythmic activity of a brain module was modulated by interacting with an RIC. Since the RIC is simpler than the chaos control algorithm, our framework may be advantageous for biosystem control.
Acknowledgements
Experiments were authorized by the commit-tee for experiment on animal of Graduate School of Information Sciences, Tohoku Univer-sity. This work was partially supported by Grants-in Aids for Scientific Research from the Ministry of Education, Science, Sports, and Cul-ture of Japan, No.10750329, No.11145207, and No.10480080.
Appendix A. Reconstruction of the CA3-RIC system dynamics
In order to describe the dynamics of the CA3-RIC system simply, we introduce several defini-tions as follows. The dynamics of the CA3-RIC system are represented by C for the CA3 burst-ing and R for the RIC firburst-ing. For example, when a firing of RIC is followed by the double bursts of CA3, this sequence is represented by RCC. To describe the return map concisely, we define the following functions:
fRIC(t)t+TRICDRIC(t/TRIC),
fCA3(d)d+TCA3DCA3(d/TCA3)
=
!
d, 05dBTRTCA3−TD, otherwise,
where TRIC and TCA3 are the intrinsic firing and
the bursting periods, respectively, tand d repre-sent the time phase, i.e. t=TRICu for RIC and
d=TCA3f for CA3, where u and f are the
nor-malized ‘phases’ of the respective module rang-ing between 0 and 1. DRIC and DCA3 represent the PRCs of the respective modules. Evidently, 05fRICBTRIC and 05fCA3BTCA3 hold. fCA3 is
a non-decreasing function because of TCA3−
TD\TR according to the experimental results.
fRIC is monotonically increasing, because we set AB1 in this study. fRIC and fCA3 give the new
time phase of the respective system just after a stimulus coming from the other system. For ex-ample, when the RIC is stimulated at t=TRICu,
the new time phase t%=TRICu% is instantaneous
after the stimulus is given by t%=fRIC(t). Hence
the time interval between the stimulus and the following RIC firing is described by (TRIC−
fRIC(t)), if additional stimuli were not given
within the interval.
Using these definitions, we can describe the return maps of c as follows:
c(n+1)=c(n)+TCA3,
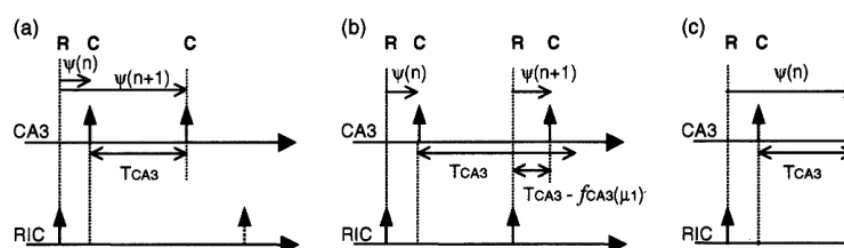
Fig. 6. Patterns observed in the output sequence of the CA3-RIC system. Vertical arrows represent the events (firings or burstings) of the module. (a) Sequence of RCC, (b) RCRC, and (c) RCCRC.
c(n+1)=TCA3−fCA3(m1),
fRIC−1(TRIC−TCA3)5c(n)BTCA3 (a.2)
c(n+1)=TCA3−fCA3(m2),
TCA35c(n)BTCA3+f−RIC 1
(TRIC−TCA3)
(a.3)
wherefRIC
−1 represents the inverse function of
fRIC,
m1=TRIC−fRIC(c(n)) and m2=TRIC−fRIC
(fRIC(c(n)−TCA3)+TCA3). The dynamics of the
CA3-RIC system for the respective cases Eqs. (a.1), (a.2) and (a.3) are depicted in Fig. 6. Ac-cording to the reconstructed return maps, within our experimental conditions, each output se-quence contains only RC and RCC patterns; in other words, combinations such as RR and CCC do not appear in the sequence if no behavior deviating from the map occurs. Due to paucity of space, we cannot explain the reason here.
References
Ayers, J.L., Selverston, A.I., 1977. Synaptic control of an endogenous pacemaker network. J. Physiol.(Paris) 73,
453 – 461.
Felleman, D.J., Van Essen, D.C., 1991. Distributed hierarchi-cal processing in the primate cerebral cortex. Cerebral Cortex 1, 1 – 47.
Glass, L., Mackey, M.C., 1988. From Clocks to Chaos: The Rhythms of Life. Princeton University Press.
Hayashi, H., Ishizuka, S., 1995. Chaotic response of the hippocampal CA3 region to a mossy fiber stimulation in vitro. Brain Res. 686, 194 – 206.
Ito, K.H., Miyakawa, H., Izumi, Y., Kato, H., 1989. Long-term potentiation induced by repeated paired stimulation of the stratum radiatum and alveus in CA1 pyramidal neurons of hippocampal slices. Biomed. Res. 10, 111 – 124. Milner, P.M., 1974. A model for visual shape recognition.
Psychol. Rev. 81, 521 – 535.
Nomura, T., Sato, S., Doi, S., Segundo, J.P., Stiber, M., 1994. A modified radial isochron clock with slow and fast dy-namics as a model of pacemaker neurons. Biol. Cybern. 72, 93 – 101.
Schiff, S.J., Jerger, K., Duong, D.H., Chang, T., Spano, M.L., Ditto, W.L., 1994. Controlling chaos in the brain. Nature 370, 615 – 620.
Soltesz, I., Crunelli, V., 1992. A role for low-frequency, rhyth-mic synaptic potentials in the synchronization of cat thala-mocortical cells. J. Physiol. (Lond.) 457, 257 – 276. von der Malsburg, C., Schneider, W., 1986. The neural
cock-tail-party processor. Biol. Cybern. 54, 29 – 40.
Winfree, A.T., 1980. The Geometry of Biological Time. Springer, New York.