STRESS MONITORING OF MULBERRY PLANTS BY FINDING REP USING
HYPERSPECTRAL DATA
Kavita Bhoslea, Dr. Vijaya Musandeb
a CSED, Maharashtra Institute of Technology, Aurangabad, MH, India – ([email protected])
bCSED, MGM’s Jawaharlal Nehru Engineering College, Aurangabad, MH, India –
KEY WORDS: Red Edge Position, REP, Hyper spectral, Stress Monitoring, Mulberry Plants
ABSTRACT:
Stressed on crop can be monitored using different indices. Red Edge position is good estimator for stress monitoring. The red edge position (REP) is strongly correlated with foliar chlorophyll content. Strong chlorophyll absorption causes the abrupt change in the 680–800nm region of reflectance spectra of green vegetation. The red edge consist the point of maximum slope between red and near-infrared wavelengths. REP can be used to recognize green zone of the observation area. The REP is present in spectra for vegetation recorded by remote sensing methods. REP is clearer and significant in hyper spectral data as hyper spectral consist of more and continuous bands data. In this paper experiments were carried out for mulberry crop using USGS EO-1 Hyperion data. Atmospheric corrected data is used for classification. Classification is carried out on small cluster of 14 field samples. Ground truth is verified and classified by comparing with Hyperion data. REP is different for different stressed condition of crops and shows healthy and diseased crop condition. Nutritional stresses, diseases, drought of plants are detected using REP. Stressed and healthy field of mulberry are estimated by calculating REP using maximum first derivative, linear interpolation, linear extrapolation method. Finally REP is compared using above methods. It is noticeable difference of REP for healthy and stressed crop. The research indicates that overall accuracy using maximum first derivative was 92.85 % and it was more compared to other methods. Linear extrapolation gives less accuracy compared to linear interpolation method.
1. INTRODUCTION
Agricultural stress can be monitored due to different crops conditions. Infected, dry and dying crops do not efficiently uses sun light, nitrogen. Stress can be categorized due to different condition as greenness by finding NDVI (Normalized Difference vegetation Index), SRI (Simple Ratio Index), REPI (Red Edge Position Index) etc. Stress may be calculated by finding different indices using light use efficiency, canopy nitrogen, leaf pigments, and canopy water content. Experiments are carried out using Red Edge Position Index. Mulberry cluster is used for analysis. REP is narrowband greenness vegetation index and it gives combined effects of foliage chlorophyll concentration, canopy leaf area. REP uses reflectance measurements in the red and near infrared regions to sample the red edge portion of the reflectance curve. Red edge is the sloped region of the vegetation reflectance curve between 680–800nm. This is caused by the transition from chlorophyll absorption and near infrared leaf scattering. REP is intended for use with high spectral resolution imaging data, such as that acquired by hyperspectral sensors. Here in this paper we have used USGS EO-1 Hyperion data for analysis.
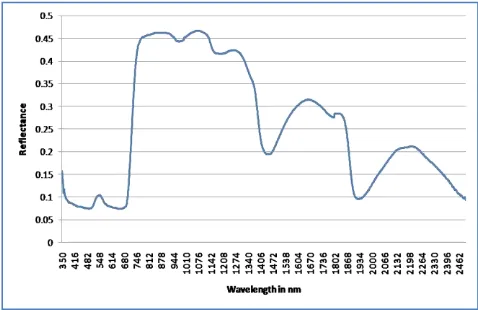
Red edge position is the wavelength of the maximum derivative of reflectance in the vegetation red edge region of the spectrum from 690 nm to 740 nm. The REP and the chlorophyll concentration are strongly correlated by Gates (1965). Curran (1991) exploring the relationship between reflectance red edge and chlorophyll concentration. REP can be used for crop monitoring, photosynthesis modeling, and canopy stress and yield prediction. The typical plant leaf reflectance is shown in figure.
REP can be estimated using different numerical methods such as linear interpolation method, inverted Gaussian technique, three point Lagrange interpolation technique, and maximum first derivative method and so on.
Figure 1: Typical green vegetation reflectance
2. MATERIALS AND METHODS a. Satellite Data Used
Space borne hyperspectral remote sensing data (EO-1 Hyperion) acquired on Dec 24, 2015 was used for the study as in winter season, crops can be clearly monitored in farm field. The product used in study had 242 bands with a spectral resolution The International Archives of the Photogrammetry, Remote Sensing and Spatial Information Sciences, Volume XLII-1/W1, 2017
ISPRS Hannover Workshop: HRIGI 17 – CMRT 17 – ISA 17 – EuroCOW 17, 6–9 June 2017, Hannover, Germany
This contribution has been peer-reviewed.
of 10 nm, spatial resolution of 30 m. Only 196 bands out of 242 bands were calibrated because of low detector response and un calibrated bands thus bad bands are set to zero. Out of 196 bands, 152 unique bands (8 to 57, 79, 83 to 119, 133 to 164, 183 to 184, and 188 to 220) were selected.
b. Study Area
The study area lies between upper left corner latitude, longitude (20.310883, 75.401182), upper right corner latitude, longitude (20.297426, 75.472334), lower left corner latitude, longitude (19.377469, 75.260141), lower right corner latitude, longitude (19.390566,75.189663) in Waregaon village, Aurangabad district of Maharashtra. India. Figure 2 shows study area of Hyperion data. Data gathered is of winter season. Crops are available for analysis.
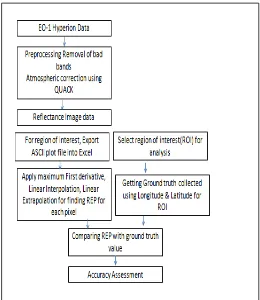
c. Method used
The brief methodology used in this work is shown in figure 3. Level 1 GST Hyperion data was processed by removing bad band and making atmospheric corrected data using FLAASH technique. We have selected Waregaon village as our region of interest. ASCII files exported into excel for selected pixel area. REP is calculated by applying three techniques such as linear interpolation, linear extrapolation and maximum first derivative method. REP is correlated to ground truth value. Overall accuracy is assessed using correlation.
Figure 2: Study area
Figure 3: Methodology Adopted
3. ALGORITHMS USED FOR FINDING REP
In this paper three algorithms are used for finding REP using excel functions those are explained as follows.
a. Maximum First derivative method
This technique locates REP as the maximum first derivative of the reflectance spectrum in the region of the red edge. Given by Horler (1983), Clevers (1991), Dawson and Curran (1998). This method takes the first derivative of the data. The algorithm uses a specified gap distance to skip that number of points to take the differences instead of adjacent data points. Here gap distance taken as 1. A spectrum that is the result of applying a derivative transform to the data of the original spectrum. The formula used for the first derivative is
f’(λ)= [f(λ + Δλ) – f (λ –Δλ)] / 2 Δλ
Where λ is the wavelength, f is the reflectance value at particular wavelength and Δ is gap distance between two wavelengths. Red edge position is the wavelength of the maximum derivative of reflectance in the vegetation red edge region of the spectrum from 690 nm to 740 nm. It is noted that this technique is quite complex and required high computational cost.
b. Linear Interpolation method
This method is simplest one first developed by Baret (1987) also used by Guyot (1992). It assumes that the reflectance red edge can be converted into straight line. This line centered on a The International Archives of the Photogrammetry, Remote Sensing and Spatial Information Sciences, Volume XLII-1/W1, 2017
ISPRS Hannover Workshop: HRIGI 17 – CMRT 17 – ISA 17 – EuroCOW 17, 6–9 June 2017, Hannover, Germany
This contribution has been peer-reviewed.
midpoint of the points, the maximum shoulder reflectance and the minimum reflectance of the chlorophyll reflectance curve, which is considered usually at about 680 nm. By using the slope of the line, red edge point is then calculated by a simple linear equation of a line.
Where λp is the wavelength for the REP and r(670), r(700), r(740) and r(780) are the reflectance at wavelengths 670, 700, 740 and 780 nm respectively.
c. Linear Extrapolation method
Third method is linear extrapolation proposed by Cho and Skidmore (2006). He proposed that REP is the point of intersection between two straight lines extrapolated on the far-red (680–700 nm) and NIR sides (725–760 nm) of the first derivative. Cho and Skidmore have fixed wavebands in the far-red and NIR region spectrum (The linear extrapolation method).
Far-red line: FDR =m1 λ + c1 NIR line: FDR = m2 λ + c2
Where m1 and m2 are slopes of far-red and NIR lines respectively. The REP, which is the λ at the intersection wavelength, is given by:
4. RESULTS AND DISCUSSION
Comparison result obtained by applying said method on Hyperion data for the selected region. Figure 4, 5, 6 shows REP values for selected sample using all methods. The result of maximum first derivative are more accurate. Next the result of linear extrapolation are better than linear interpolation method. We have obtained ground truth from State sericulture department for that area of interest. We get following result by comparing REP obtained from different method with ground truth.
Figure 4: REP for mulberry plants using maximum first derivative method
Figure 5: REP for mulberry plants using langrage’s interpolation method
Figure 6: REP for mulberry plants using Linear Extrapolation method
Figure 4 shows REP for mulberry plants using maximum first derivative method. Overall accuracy is 92.85 %. Out of 14 samples 13 correctly classified.
Figure 5 shows REP for mulberry plants using langrage interpolation method. Overall accuracy is 78.57 %. Out of 14 samples 11 correctly classified.
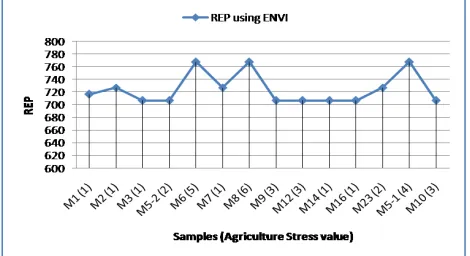
Figure 7: REP for mulberry plants using ENVI tool
Figure 6 shows REP for mulberry plants using linear extrapolation method. Overall accuracy is 85.71 %. Out of 14 samples 12 correctly classified.
The International Archives of the Photogrammetry, Remote Sensing and Spatial Information Sciences, Volume XLII-1/W1, 2017 ISPRS Hannover Workshop: HRIGI 17 – CMRT 17 – ISA 17 – EuroCOW 17, 6–9 June 2017, Hannover, Germany
This contribution has been peer-reviewed.
Figure 7 shows REP for mulberry plants using ENVI method. Overall accuracy is 100 %. Out of 14 samples 14 correctly classified.
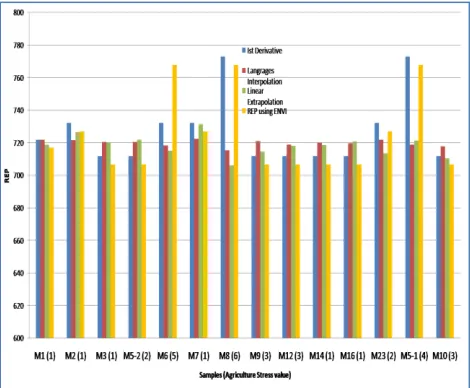
Figure 8: Comparison of REP for mulberry plants using all method
Figure 8 shows comparison between all methods. Out of 14 samples 3 samples found to be under stress that is unhealthy and 11 samples was healthy.
5. CONCLUSION
The aim of this study was estimate REP index using maximum first derivative, langrage interpolation, and linear extrapolation method. Also compare REP obtained through these methods with ENVI simulation and ground truth. The crop under consideration is mulberry and study area is Waregaon village of Aurangabad (MH) district of India. Each field considered as one pixel of size 30 m by 30 m.
Overall accuracy using maximum derivative is 92.85 % that is nearer to ground truth and REP using ENVI simulation method.
REFERENCES
Collins, W. 1978. Remote Sensing of Crop Type and Maturity. Photogrammetric Engineering and Remote Sensing 44: 43−55.
BARET, F., CHAMPION, I., GUYOT, G. and PODAIRE, A., 1987, Monitoring wheat canopies with a high spectral resolution radiometer. Remote Sensing of Environment, 22, pp. 367–378.
Guyot, G., and F. Baret. 1988. Utilisation de la haute résolution spectrale pour suivre l‘état des couverts végétaux. In Proceedings of the 4th International Colloquium on Spectral Signatures of Objects in Remote Sensing, 279−286. Paris: ESA .
DEMETRIADES-SHAH, T., STEVEN, M.D. and CLARK, J.A., 1990, High resolution derivative spectra in
remote sensing. Remote Sensing of Environment, 33, pp. 55–64.
Dawson, T. P., and P. J. Curran. 1998. A New Technique for Interpolating Red Edge Position. International Journal of Remote Sensing 19: 2133−2139.
Cho, M. A., and A. K. Skidmore. 2006. A New Technique for Extracting the Red Edge Position From Hyperspectral Data: The Linear Extrapolation Method. Remote Sensing of Environment 101: 181–193.
Bonham-Carter, G. F. 1988. Numerical Procedures and Computer Program for Fitting an Inverted Gaussian Model to Vegetation Reflectance Data. Computers and Geosciences 14: 339−356.
Curran, P. J., J. L. Dungan, Gholz. 1990. Exploring the Relationship Between Reflectance Red Edge and Chlorophyll Content in Slash Pine. Tree Physiology 7:33– 48.
Dawson, T. P., and P. J. Curran. 1998. A New Technique for Interpolating Red Edge Position. International Journal of Remote Sensing 19: 2133−2139.
Miller, J. R., E. W. Hare, and J. Wu. 1990. Quantitative Characterization of the Red Edge Reflectance. An Inverted-Gaussian Reflectance Model. International Journal of Remote Sensing 11: 1755−1773.
Pu, R., P. Gong, G. S. Biging, and M. R. Larrieu. 2003. Extraction of Red Edge Optical Parameters from Hyperion Data for Estimation of Forest Leaf Area Index. IEEE Transactions on Geoscience and Remote Sensing 41: 916−921.
The International Archives of the Photogrammetry, Remote Sensing and Spatial Information Sciences, Volume XLII-1/W1, 2017 ISPRS Hannover Workshop: HRIGI 17 – CMRT 17 – ISA 17 – EuroCOW 17, 6–9 June 2017, Hannover, Germany
This contribution has been peer-reviewed.