APPLICATION OF PHOTOGRAMMETRY TO BRAIN ANATOMY
E. Nocerinoa, F. Mennaa, F. Remondinoa, S. Sarubbob, A. De Benedictisc, F. Chioffib, V. Petraliab, M. Barbareschid, E. Olivettie,f, P. Avesanie,f
a 3D Optical Metrology (3DOM) unit, Bruno Kessler Foundation (FBK), Trento, Italy <nocerino><fmenna><remondino>@fbk.eu, http://3dom.fbk.eu
b Division of Neurosurgery, Structural and Functional Connectivity Lab, S. Chiara Hospital, Trento, Italy
c Neurosurgery Unit, Department of Neuroscience and Neurorehabilitation, Bambino Gesù Children's Hospital, IRCCS, Roma, Italy d Department of Histopathology, S. Chiara Hospital, Trento, Italy
e Neuroinformatics Laboratory (NILab), Bruno Kessler Foundation (FBK), Trento, Italy f Center for Mind/Brain Science (CIMeC), University of Trento, Trento, Italy
Commission II, WG 10
KEY WORDS: Photogrammetry, Dense Image Matching, Non-rigid body comparison, Depth of field, Brain anatomy, Brain connectivity, White matter dissection
ABSTRACT:
This paper presents an on-going interdisciplinary collaboration to advance brain connectivity studies. Despite the evolution of non-invasive methods to investigate the brain connectivity structure using the diffusion magnetic resonance, in the neuroscientific community there is an open debate how to collect quantitative information of the main neuroanatomical tracts. Information on the structure and main pathways of brain’s white matter are generally derived by manual dissection of the brain ex-vivo. This paper wants to present a photogrammetric method developed to support the collection of metric information of the main pathways, or set of fibres, of the white matter of brain. For this purpose, multi-temporal photogrammetric acquisitions, with a resolution better than 100 microns, are performed at different stages of the brain’s dissection, and the derived dense point clouds are used to annotate the stem, i.e., the region where there is a greater density of fibres of a given pathway, and termination points of several neuroanatomical tracts, i.e. fibres.
1. INTRODUCTION
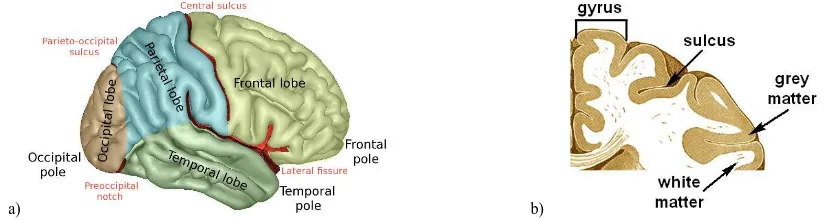
The central nervous system (CNS) is composed of the brain, with all its nerves and spinal cord. The brain is divided into three parts; the largest of them is called cerebrum, which is split in the right and left hemispheres, having each four lobes (Figure 1a). The surface of the cerebrum, known as cortex (Figure 1b), has a folded appearance, being a fold called gyrus and a groove sulcus (Hines, 2016). The cortex contains a complex network of cortical epicentres or neurons (gray or grey matter, GM), connected by parallel axonal connections, i.e. the white matter (WM) (De Benedictis and Duffau, 2011). According to this model, a given neural function results from the dynamic interaction between neural circuits distributed over the different regions of the brain, i.e. the cerebral lobes.
The WM plays a crucial role for several reasons. First, it represents the anatomical substrate for brain connectivity, through several short and long pathways running within and between the two cerebral hemispheres (Aralasmak et al, 2006; Filley 2005). Second, the WM is susceptible to a large spectrum of diseases (Filley 2010) depending on different mechanisms, including disconnection between brain territories, and several
patterns of both hyper- or hypoconnectivity (Catani and Mesulam, 2008; de Shotten et al, 2008). Finally, contrary to the well-documented plastic potential occurring at the cortical level, responsible for the clinical recovering after acute and chronic pathologies, the subcortical connectivity does not benefit from the same rearrangement, especially after acute accidents (Duffau, 2009) or surgical damage (Russell et al., 2005). For these reasons, an accurate awareness of WM anatomy is crucial, not only for an exhaustive understanding of the brain functioning, but also to optimize the quality of neurosurgical approaches.
In this interdisciplinary study, an innovative method based on photogrammetry is developed to support the acquisition of metric information on the main WM pathways of the human brain. Multi-step micro-dissections were performed on the lateral WM in a right human hemisphere, and photogrammetric acquisitions were performed at different stages of the dissection. Dense point clouds are then produced and used for various analyses and annotations. The paper first introduces an overview on state-of-the-art techniques for WM dissection and analysis; then, details of acquisitions and processing steps are reported, and the preliminary results of the study are described. A final discussion on future avenues concludes the paper.
a) b)
Figure 1. Brain anatomy: (a) lateral surface of right cerebral hemisphere with main lobes and sulci (source:
https://commons.wikimedia.org/wiki/File:LobesCaptsLateral.png); (b) the cortex structure (based on Gray, 1918, and Hines, 2016).
2. STATE-OF-THE-ART IN WHITE MATTER DISSECTION AND ANALYSIS
In the past, the WM anatomy was investigated by post-mortem cadaveric dissections, which enabled a high-specific and systematic description of different WM bundles. Moreover, the introduction of the Klingler’s method, based on fibers spread induced by the preventive brain freezing (Klingler, 1935, Zemmoura et al., 2016), allowed a more accurate and systematic characterization of the different fascicles (Ture et al., 2000). However, the technical complexity required in the preparation of the specimens, the time-consuming dissection procedure, and the fragility of the structures, have progressively discouraged in the following years the widespread use of this technique.
More recently, the development of diffusion tensor imaging (DTI) made possible to investigate in vivo and in a non-invasive way the three-dimensional anatomy of WM tracts. DTI is a special imaging method based on the principle that water molecules diffuse preferentially along the neural axons, so providing indirect details about the course of WM fibres within the brain. The reconstruction of diffusion maps (i.e. tractography, Figure 2), based on the different directional patterns of the fibres, allows a three-dimensional representation of many pathways (Mukherjee et al., 2008). A large number of publications encourage the improvement of this tool for studying cerebral connectivity (Jones et al., 1999; Catani and De Schotten, 2008; Lequerc et al., 2011).
Figure 2. Lateral view of a tractographic result from DTI (Filler, 2009). However, remaining methodological limitations of this neuroimaging technique need to be addressed, mainly in relation to the representation of the fascicles in correspondence of the crossing points among differently oriented pathways, and regarding the precise definition of their trajectories and cortical terminations. Moreover, the results of reconstructions are extremely variable and related to data processing and tracking. These factors have contributed to renewed interest in classic cadaveric observations, as demonstrated by some recent studies in which both the methods have been used (Fernandez-Miranda et al., 2008; Martino et al., 2013; De Benedictis et al., 2012; De Benedictis et al., 2014; De Benedictis et al., 2016; Sarubbo et al., 2013).
In this context, despite the continuous evolution of ex-vivo analysis and non-invasive methods in investigating brain connectivity, several aspects need further clarification, mainly concerning: (i) the course and the topography of cortical terminations of the single tracts and their reciprocal relationships with other pathways; (ii) the three-dimensional awareness of these anatomical data; (iii) the best methodology for collecting reliable quantitative information on WM tracts.
The aim of this work is to develop a reliable method, based on photogrammetry, to support the process of acquisition of metric information and 3D visualisation of the main WM pathways of the brain. Photogrammetry was already applied for non-invasive
studies of human brain, e.g., for localising scalp sensors used for electroencephalogram - EEG (Li et al., 2016) or for deriving the 3D surface of subjects’ face to register medical imaging, like MRI or positron emission tomography - PET (Mawlawi et al., 1998). Anaglyphic images were adopted in neurosurgical anatomy studies (Fernandez-Miranda et al., 2008), whereas, in the authors’ knowledge, photogrammetry has never been applied to provide 3D digital high resolution reproductions of the WM during a multi-step dissection.
3. BRAIN DISSECTIONS AND MULTI-TEMPORAL PHOTOGRAMMETRIC MEASUREMENTS 3.1 Brain dissection
One right hemisphere, whose main dimensions are approximatively (95×175×70) mm3, is prepared according to a modified protocol for Klingler’s technique, which consists in a process of formalin fixation, freezing and gradual defrosting of the specimens. After removing the vessels and the meningeal layer, WM fibres are progressively manually exposed using wooden spatulas, by gently peeling the matter underlying the cortical layer (Sarubbo et al., 2015).
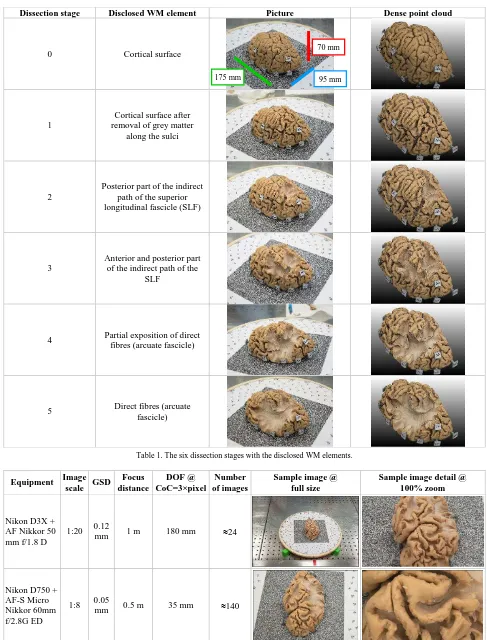
Table 1 summarises the six dissection stages. At the end of each dissection step, the brain was placed on a turntable, featuring photogrammetric circular coded targets and a square random pattern, for high resolution 3D surveys (Section 3.2). The analyses are focused on the course of the terminal distribution of the WM fibre complex, composed by the superior longitudinal fascicle (SLF) and the arcuate fascicle (AF). This structure is one of the most eloquent and investigated pathway of the brain, providing connectivity between Wernicke’s, Geschwind’s and Broca’s territories (Martino et al., 2012; Axer et al., 2013). The dissection started from the lateral surface of the brain and we advanced in a lateral-to-medial direction, to progressively expose the indirect and the direct components, as described in previous work (Catani 2005, De Benedictis et al., 2012; De Benedictis et al., 2014).
3.2 Photogrammetric survey
From a 3D (photogrammetric) documentation standpoint, the main challenges of the current application arise from the following peculiarities and critical factors:
- the location where the acquisitions are performed is an aseptic environment, usually a mortuary, with quite limited space around for setting up wired and bulky 3D equipment. - strict safety protocols are dictated imposed: operators must
wear proper clothes and eyewear, and the equipment must be disinfected at the end of the acquisition session.
- a fast acquisition method is essential as the dissection of the brain may entail several steps to progressively expose the fibres of interest. Being an irreversible procedure, the option to check the processing results in real time is crucial. - the dissected brain is a non-rigid body, both for its own
structure and because of the protocol preparatory for the dissection (Section 3.1). The brain shape may be considered constant within each dissection stage, but it changes between the sequential dissection steps. The magnitude of its shape variation is unknown and it affects the multi-temporal analyses. One of the aim of this study is to identify a method to quantify such deformations.
- at each step of the dissection, the brain is washed in order to remove the dissected parts. Consequently, its surface features a shiny and quite homogenous texture, i.e. a challenge for automatic image-based modelling techniques.
Dissection stage Disclosed WM element Picture Dense point cloud
0 Cortical surface
1
Cortical surface after removal of grey matter
along the sulci
2
Posterior part of the indirect path of the superior longitudinal fascicle (SLF)
3
Anterior and posterior part of the indirect path of the
SLF
4 Partial exposition of direct fibres (arcuate fascicle)
5 Direct fibres (arcuate fascicle)
Table 1. The six dissection stages with the disclosed WM elements.
Equipment Image scale GSD
Focus distance
DOF @ CoC=3×pixel
Number of images
Sample image @ full size
Sample image detail @ 100% zoom
Nikon D3X + AF Nikkor 50 mm f/1.8 D
1:20 0.12
mm 1 m 180 mm 24
Nikon D750 + AF-S Micro Nikkor 60mm f/2.8G ED
1:8 0.05
mm 0.5 m 35 mm 140
Table 2. Specifications of photogrammetric acquisitions for every dissection stage (Table 1). 70 mm
95 mm 175 mm
To digitally reproduce the WM fascicles, a geometric resolution of the final product (dense point cloud) better than 0.1 mm is required. To satisfy this requirement, a very close or quasi-macro photogrammetric acquisition is needed; in such condition, the depth of filed (DOF) is known to be a critical factor (Nocerino et al., 2016a). As trade-off between resolution in object space, sharpness and acquisition time, two separate photogrammetric acquisitions were planned for every dissection stage (Table 1). The two acquisitions were carried out at two different image scales, with two different camera systems for each dissection stage. Table 2 shows the specifications of the two photogrammetric acquisitions.
For both cameras, the focus distance was fixed and kept constant through the entire photographic session, in order to keep camera interior orientation parameters as much stable as possible. The smallest image scale (1:20) acquisition was performed to establish a coordinate reference system with scale in object space, while the highest images scale (1:8) was planned to assure the necessary ground sample distance (GSD) to properly digitise the WM fascicles.
The smallest image scale acquisition, providing a wider DOF, is also adopted as cross-check method to assess the accuracy of the highest scale photogrammetric solution. Indeed, photogrammetry has proved to be a very accurate technique, well suited for high demanding measurement purposes, like in industrial applications (Luhmann, 2010), and able to provide relative accuracies up to 1:150,000 in controlled environment (Nocerino et al., 2016a). For each dissection stage, two datasets are acquired and processed. The centres of the coded targets visible both on the turntable and pinned to the brain are then extracted, triangulated and compared between the two photogrammetric networks. An average root mean square difference (RMS) better than 0.05 mm was obtained in the spatial transformation for all the photogrammetric acquisitions.
The images at large image scale are then further processed with a dense image matching procedure (Table 1). The dense matching was carried out using the second-level image pyramid, i.e. at a quarter of the original image resolution, considered a reasonable trade-off between processing effort and desirable resolution in object space (Remondino et al., 2014). Despite this choice, due to the utilised multi-view matching procedure utilised, the final average linear resolution of the point clouds is about 0.05 mm, i.e. equal to the image GSD.
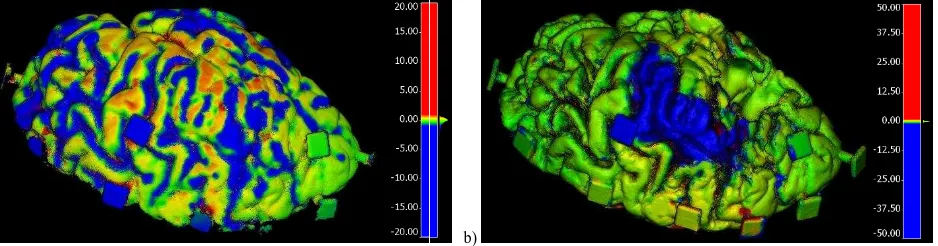
4. ALIGNMENT OF DISSECTIONS AND ANALYSES 4.1 Alignment and comparison of dense point clouds The multi-temporal photogrammetric point clouds are generated in a common coordinate reference system, provided by the photogrammetric coded targets visible on the turntable. Since the brain is moved for each dissection stage, a fine registration is anyway necessary and it is performed through the iterative closest point (ICP) registration method implemented in the open source software application CloudCompare (2017). The signed distance between point clouds corresponding to consecutive dissection stages is also computed, using the CloudCompare M3C2 plugin (Lague et al., 2013). The differences highlight the removed parts, as well as the deformation occurred.
The colour coded maps of the comparison between stage 0 and stage 1, as well as stage 2 and stage 3 are shown in Figure 3a and 3b, respectively. The differences are displayed on the earlier stages, namely 0 and 2, respectively. Thus, the blue colour represents the dissected parts, while the red might indicate the deformations of the non-rigid body.
a) b)
Figure 3. Colour-coded map of differences (in mm) visualised on the older / first point cloud: a) stage 0 vs stage 1, b) stage 2 vs stage 3 (b). The blue colour represents removed parts in the dissection process, while the red might indicate the possible occurred deformations. 4.2 Registration of point clouds on medical imagery data
A further rigid transformation is computed to register the multi-temporal photogrammetric point clouds into the coordinate reference system of magnetic resonance imaging (MRI) data (Figure 4), acquired before the dissection procedure. The additional transformation is necessary to obtain the analyses and
annotations of the WM elements in the medical imaging, i.e. MRI and DTI, coordinate system.
a)
b) c)
Figure 4. Single orthogonal plane views of the brain MRI (a); orthogonal planes visualised in the cubic volume (b); MRI volume rendering (c).
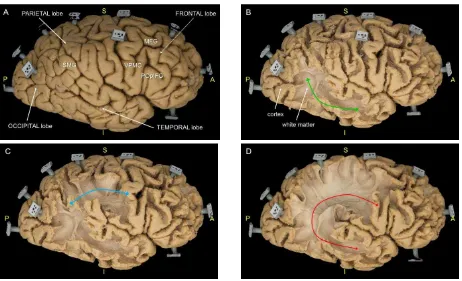
Figure 5. The multi-temporal photogrammetric dense point clouds, corresponding to different steps of the SLF dissection within a right hemisphere. A: cortical surface (stage 0); B: dissection of the indirect posterior SLF (green arrow) (stage 2); C: dissection of the indirect anterior SLF (blue
arrow) (stage 3); dissection of the direct arcuate fasciculus (red arrow) (stage 5). 4.3 Preliminary analyses
Given the multi-temporal 3D point clouds of the brain, the following analyses are performed:
- Stage 0: the cortical surface is accurately analysed to exclude major anatomical variability of the sulco-gyral anatomy (Figure 5A). The following annotations are also reported:
SMG: supramarginal gyrus (parietal lobe)
MFG: middle frontal gyrus (frontal lobe)
POpIFG: pars opercularis of the inferior frontal gyrus (frontal lobe)
VPMC: ventral premotor cortex (frontal lobe); - Stage 1: after cortical gray matter removal, the intergyral
U-shaped fibres, consisting in short connections between adjacent cerebral convolutions, is revealed;
- Stage 2: the indirect posterior component of SLF, connection the inferior parietal lobule and the posterior temporal lobe (Figure 5B), is disclosed;
- Stage 3: the indirect anterior segment of SLF, connecting the parietal lobe with the posterior part of the frontal lobe (Figure 5C), is exposed;
- Stage 4 and 5: the arcuate fascicle (AF), running in a deeper layer and providing a direct connection between the
posterior part of the temporal lobe and the posterior part of the frontal lobe (Figure 5D), is shown.
Moreover, specific measures, including the stem width and the orthogonal distance between the cortical surface and the stem of each segment, are acquired using the dense point clouds (Table 3).
5. CONCLUSIONS AND FUTURE WORKS In this interdisciplinary study, we developed an innovative method to support the visualisation and the acquisition of metric information on the perisylvian structural connectivity of the human brain. The described photogrammetric approach is a
promising tool, able to provide a detailed, accurate and interactive 3D representation of the WM anatomy. Moreover, several quantitative and qualitative data can be extracted and potentially correlated with functional information. The application of this method to other WM tracts will help to clarify several structural and topographical aspects of the whole brain network.
Non-rigid transformation approaches will be investigated to improve the registration between the point clouds representing the brain at different dissection stages.
We believe that this technique could have a special value for many neuroscientific, educational and surgical applications.
Stage Tract (set of fibres) Stem: region where the fibres of a given WM pathway have greater density [mm]
Distance: measurement between the cortical surface of a given gyrus and the WM stem [mm]
2 Posterior SLF 9.6 SMG-stem: 17.6
Table 3. Example of structural and topographical quantitative information derived from photogrammetric data and related to each WM segment.
REFERENCES
Aralasmak, A., Ulmer, J.L., Kocak, M., Salvan, C.V., Hillis, A.E. and Yousem, D.M., 2006. Association, commissural, and projection pathways and their functional deficit reported in literature. Journal of computer assisted tomography, 30(5), pp.695-715.
Axer, H., Klingner, C.M. and Prescher, A., 2013. Fiber anatomy of dorsal and ventral language streams. Brain and language, 127(2), pp.192-204.
Catani, M. and De Schotten, M.T., 2008. A diffusion tensor imaging tractography atlas for virtual in vivo dissections. Cortex, 44(8), pp.1105-1132.
Catani, M. and Jones, D.K., 2005. Perisylvian language networks of the human brain. Annals of neurology, 57(1), pp.8-16.
Catani, M. and Mesulam, M., 2008. What is a disconnection syndrome? Cortex, 44(8), pp.911-913.
CloudCompare, 2017. http://www.cloudcompare.org/, v. 2.8.
De Benedictis, A. and Duffau, H., 2011. Brain hodotopy: from esoteric concept to practical surgical applications. Neurosurgery, 68(6), pp.1709-1723.
De Benedictis, A., Duffau, H., Paradiso, B., Grandi, E., Balbi, S., Granieri, E., Colarusso, E., Chioffi, F., Marras, C.E. and Sarubbo, S., 2014. Anatomo‐ functional study of the temporo‐ parieto‐ occipital region: dissection, tractographic and brain mapping evidence from a neurosurgical perspective. Journal of anatomy, 225(2), pp.132-151.
Benedictis, A., Petit, L., Descoteaux, M., Marras, C.E., Barbareschi, M., Corsini, F., Dallabona, M., Chioffi, F. and Sarubbo, S., 2016. New insights in the homotopic and heterotopic connectivity of the frontal portion of the human corpus callosum
revealed by microdissection and diffusion tractography. Human Brain Mapping, 37(12), pp.4718-4735.
De Benedictis, A., Sarubbo, S. and Duffau, H., 2012. Subcortical surgical anatomy of the lateral frontal region: human white matter dissection and correlations with functional insights provided by intraoperative direct brain stimulation: laboratory investigation. Journal of neurosurgery, 117(6), pp.1053-1069.
De Schotten, M.T., Kinkingnehun, S., Delmaire, C., Lehericy, S., Duffau, H., Thivard, L., Volle, E., Levy, R., Dubois, B. and Bartolomeo, P., 2008. Visualization of disconnection syndromes in humans. Cortex, 44(8), pp.1097-1103.
Duffau, H., 2009. Does post-lesional subcortical plasticity exist in the human brain? Neuroscience research, 65(2), pp.131-135.
Fernández-Miranda, J.C., Rhoton Jr, A.L., Álvarez-Linera, J., Kakizawa, Y., Choi, C. and de Oliveira, E.P., 2008. Three‐ dimensional microsurgical and tractographic anatomy of the white matter of the human brain. Neurosurgery, 62(6), Annals of the New York Academy of Sciences, 1064(1), pp.162-183.
Filley, C.M., 2010. White matter: organization and functional relevance. Neuropsychology review, 20(2), pp.158-173.
Hines, T., 2016. Anatomy of the Brain. Mayfield Certified Health Info materials. Mayfield Clinic 1998-2016. http://www.mayfieldclinic.com/PDF/PE-AnatBrain.pdf
Jones, D.K., Simmons, A., Williams, S.C. and Horsfield, M.A., 1999. Non-invasive assessment of axonal fiber connectivity in the human brain via diffusion tensor MRI. Magnetic Resonance in Medicine, 42(1), pp.37-41.
Klingler, J., 1935. Erleichterung der makrokopischen Präparation des Gehirns durch den Gefrierprozess. Orell Füssli.
Lague, D., Brodu, N. and Leroux, J., 2013. Accurate 3D comparison of complex topography with terrestrial laser scanner: Application to the Rangitikei canyon (NZ). ISPRS Journal of Photogrammetry and Remote Sensing, 82, pp.10-26.
Leclercq, D., Delmaire, C., de Champfleur, N.M., Chiras, J. and Lehéricy, S., 2011. Diffusion tractography: methods, validation and applications in patients with neurosurgical lesions. Neurosurgery Clinics of North America, 22(2), pp.253-268.
Li, K., Papademetris, X. and Tucker, D.M., 2016. BrainK for structural image processing: creating electrical models of the human head. Computational intelligence and neuroscience, 2016.
Luhmann, T., 2010. Close range photogrammetry for industrial applications. ISPRS Journal of Photogrammetry and Remote Sensing, 65(6), pp.558-569.
Martino, J., Hamer, P.C.D.W., Berger, M.S., Lawton, M.T., Arnold, C.M., de Lucas, E.M. and Duffau, H., 2013. Analysis of the subcomponents and cortical terminations of the perisylvian superior longitudinal fasciculus: a fiber dissection and DTI tractography study. Brain Structure and Function, 218(1), pp.105-121.
Martino, J., da Silva-Freitas, R., Caballero, H., de Lucas, E.M., García-Porrero, J.A. and Vázquez-Barquero, A., 2013. Fiber dissection and diffusion tensor imaging tractography study of the temporoparietal fiber intersection area. Operative Neurosurgery, 72, pp.ons87-ons98.
Mawlawi, O.R., Beattie, B.J., Larson, S.M. and Blasberg, R.G., Multimodality Brain Image Registration Using a Three-Dimensional Photogrammetrically Derived Surface. Chapter 14 in Quantitative functional brain imaging with positron emission tomography. Carson, R.E., Herscovitch, P. and Daube-Witherspoon, M.E. eds., 1998. Elsevier.
Mukherjee, P., Berman, J.I., Chung, S.W., Hess, C.P. and Henry, R.G., 2008. Diffusion tensor MR imaging and fiber tractography: theoretic underpinnings. American journal of neuroradiology, 29(4), pp.632-641.
Nocerino, E., Menna, F., Remondino, F., Beraldin, J.A., Cournoyer, L. and Reain, G., 2016a. Experiments on calibrating tilt-shift lenses for close-range photogrammetry. ISPRS International Archives of the Photogrammetry, Remote Sensing and Spatial Information Sciences, Vol. XLI-B5, pp.99-105.
Nocerino, E., Remondino, F., Uccheddu, F., Gallo, M. and Gerosa, G., 2016b. 3D modelling and rapid prototyping for cardiovascular surgical planning - Two case studies. ISPRS International Archives of the Photogrammetry, Remote Sensing and Spatial Information Sciences, Vol. XLI-B5, pp.887-893.
Remondino, F., Spera, M.G., Nocerino, E., Menna, F. and Nex, F., 2014. State of the art in high density image matching. The Photogrammetric Record, 29(146), pp.144-166.
Russell, S.M., Elliott, R., Forshaw, D., Kelly, P.J. and Golfinos, J.G., 2005. Resection of parietal lobe gliomas: incidence and evolution of neurological deficits in 28 consecutive patients correlated to the location and morphological characteristics of the tumor. Journal of neurosurgery, 103(6), pp.1010-1017.
Sarubbo, S., De Benedictis, A., Maldonado, I.L., Basso, G. and Duffau, H., 2013. Frontal terminations for the inferior fronto-occipital fascicle: anatomical dissection, DTI study and functional considerations on a multi-component bundle. Brain Structure and Function, 218(1), pp.21-37.
Sarubbo, S., De Benedictis, A., Milani, P., Paradiso, B., Barbareschi, M., Rozzanigo, U., Colarusso, E., Tugnoli, V., Farneti, M., Granieri, E. and Duffau, H., 2015. The course and the anatomo‐ functional relationships of the optic radiation: a combined study with ‘post mortem’ dissections and ‘in vivo’ direct electrical mapping. Journal of anatomy, 226(1), pp.47-59.
Türe, U., Yasargil, M.G., Friedman, A.H. and Al-Mefty, O., 2000. Fiber dissection technique: lateral aspect of the brain. Neurosurgery, 47(2), pp.417-427.
Zemmoura, I., Blanchard, E., Raynal, P.I., Rousselot-Denis, C., Destrieux, C. and Velut, S., 2016. How Klingler’s dissection permits exploration of brain structural connectivity? An electron microscopy study of human white matter. Brain Structure and Function, 221(5), pp.2477-2486.
APPENDIX
The photogrammetry derived 3D point clouds of the multi-temporal dissection (Table 1), as well as the colour-coded differences between consecutive stages can be interactively viewed here: http://3dom.fbk.eu/repository/brain/index.html.