DEVISING A VISUAL INSPECTION SYSTEM FOR CANAL TUNNELS:
PRELIMINARY STUDIES
J.-L. Alberta, P. Charbonniera, P. Chavanta,b, P. Fouchera, V. Muzeta, D. Prybylaa, T. Perrina, P. Grussenmeyerb, S. Guilleminb, M. Koehlb
a
CETE de l’Est, LRPC de Strasbourg, 11 rue Jean Mentelin, 67035 Strasbourg, France
{Jean-Louis.Albert,Pierre.Charbonnier,Philippe.Foucher,Valerie.Muzet, Davy.Prybyla,Thibaut.Perrin}@developpement-durable.gouv.fr b
ICube Laboratory UMR 7357, Photogrammetry and Geomatics Group, INSA de Strasbourg, 24 Bd de la Victoire, 67084 Strasbourg, France
{pierre.grussenmeyer,samuel.guillemin,mathieu.koehl}@insa-strasbourg.fr
KEY WORDS:Photogrammetry, Cultural Heritage, Recording, Surveying, Inspection, Imagery, Multisensor, Positioning
ABSTRACT:
In France, most tunnel canals were built during the 19th and 20th centuries. Maintaining them is not only a matter of heritage preser-vation but also a question of security. Inspecting tunnel canals is difficult and time consuming, which motivates the development of an image-based surveying system, as already exists for railway or road tunnels. However, while the imaging configuration is similar, referencing the data acquisition device is more difficult in the case of underground waterways, due to the drifts of the inspection barge. In this paper, we introduce the recording prototype we have designed and report the results of the test that were performed in an un-derground waterway, Niderviller’s tunnel, to assess the feasibility of the system. In particular, we give details on the imaging system design. We also analyze the pros and cons of each location method, in terms of costs, practicability, computational burden and accuracy.
1 INTRODUCTION
There are 31 canal tunnels in service in France, totalling 42 km of underground waterway, among which the longest measures 5670 m. They were mostly built during the 19th and 20th centuries. Their size is variable; however most of them are suited to the so-called Freycinet gauge (maximum 38.5 m long and 5.05 m wide boats). Many types of transports take canal tunnels: goods (in-cluding hazardous materials), passengers (tourism and pleasure boats), and other users (e.g. cyclists or pedestrian on ledges). Hence, keeping tunnels in good condition is not only a matter of heritage preservation, but also a security issue.
In this context, Voies Navigables de France (the French operator of waterways), the Centre d’Etudes des Tunnels (CETU) and the CETE de l’Est, in collaboration with the Photogrammetry and Geomatics Group (INSA) have begun a study for the develop-ment of a visual inspection system dedicated to canal tunnels. This project aims at devising a prototype for acquiring images of the tunnel vaults and side walls, from a barge. These image sequences should be browsed and analyzed in terms of defect de-tection, metric measurements or inventory of equipments, using dedicated software. Therefore, they must be sufficiently bright, sharp and well-resolved to allow visual inspection. Also, ev-ery image must be located and oriented as precisely as possible. Since conventional global positioning systems (GPS)-based nav-igation systems of course do not work in tunnels, other solutions must be sought to accurately locate the recording boat.
The feasibility experiments reported in this paper addressed the objectives of image quality and of location accuracy, with a focus on the second one, which is the most difficult to fulfill. The rest of the paper is organized as follows. In section 2, we give a brief overview of related works. In section 3, we describe the test site, the way a reference model of the tunnel was built and the data recording prototype. In section 4, we focus on the positioning of the acquisition system. Experimental results are shown and dis-cussed in section 5. Conclusions and future directions are given in section 6.
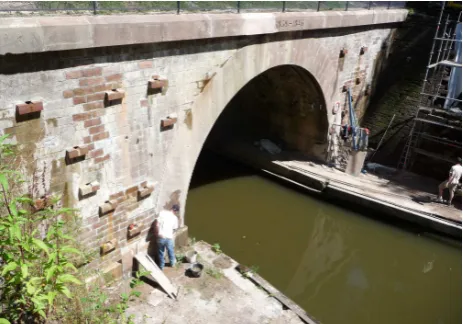
Figure 1: Restoration of Niderviller’s tunnel masonry in 2009.
2 RELATED WORKS
Dynamic recording for tunnel inspection using 3D (Laser) and/or image data has received an increasing attention during the last few years. Most of the works reported in the literature concern road, subway and railway tunnels. Experimental systems are em-bedded either on locomotives or carts, or on pick-ups or trucks. To our best knowledge, only one system, combining video cam-eras and laser pointers onboard a boat, used in Japan for large diameter pipe inspection, has been reported (Kanzaki and Yam-aguchi, 2006).
rail-way tunnel. In (M¨ulleret al., 2012), total stations implemented every 300 m inside the Gothard Base Tunnel were used to track reflector prisms mounted on the inspection vehicle. Such conven-tional trajectography methods require a careful synchronization of all recording devices. They also imply either user interaction or multiple equipments, that both increase the overall cost of in-spections.
An alternative to these techniques is to exploit image data. In par-ticular, structure from motion (SFM) is a framework that emerged from the fields of computer vision and digital photogrammetry. It allows reconstructing both the structure of the scene and the camera poses in 3D from an image sequences, which may not be ordered, see e.g. (Agarwalet al., 2011). It relies on image cor-respondances and on an off-line optimization stage called bun-dle adjustment, whose computational time and memory require-ment increase with the number of images. We refer the reader to (Szeliski, 2010) for a thorough presentation and further ref-erences. In contrast, visual odometry (VO) (Scaramuzza and Fraundorfer, 2011, Scaramuzza and Fraundorfer, 2012), which can be seen as a special case of SFM, estimates the 3D motion of the camera in real-time, in a sequential way. In a nutshell, it simplifies the problem by introducing motion estimation into the loop, allowing for dense 3D reconstruction along itineraries in real-time (Geigeret al., 2011). Image-based techniques are promising and seem relevant for our application, since imaging the vaults and sidewalls is the main purpose of the study.
3 DYNAMIC DATA RECORDING
3.1 Experimental site
Our recording campaigns took place in Niderviller’s tunnel, on the Marne-Rhine canal. This canal is a 314 km long waterway lo-cated in the north-east of France. Connected, at its western side, to the lateral canal of the river Marne in Vitry-le-Franc¸ois and, at its eastern side, to the Rhine in Strasbourg, it allows navigating from the Seine basin (Le Havre, Paris) to Germany, Netherlands and eastern Europe. A first investigation, commissioned by king Louis XVI in the early 1780’s and conducted by d’Arson and Laf-fite de Clav´e concluded that the project was feasible (Huerne de Pommeuse, 1822). However, the study of the Marne-Rhine canal by engineer B. Brisson really started in 1826. The construction, leaded by polytechnician C-E. Collignon started in 1838 and the canal was opened to navigation in 1853. Today, the canal has 166 locks and 4 tunnels. The Vosges massif is crossed via two tunnels located near its lower point, called Col de Saverne, in Niderviller and Arzviller∗.
Our experimental site, Niderviller’s tunnel (475.45 m long), is shorter than Arzviller’s tunnel (2306 m). It is straight, lined with stonework and has a pedestrian path on a ledge. Its construction took place between 1839 and 1845. Navigation in the tunnel was successively pulled by horses, tugboats and towing locomotives on a narrow railroad, that still exists. Nowadays, boats are self-propelling and navigate freely in the tunnel. However, navigation is one-way, in alternate mode, and at low speed (3 to 6 km/h, typically). About 7,000 boats, among which a vast majority are pleasure boats, cross the tunnel every year (in 2012). Inspection and restoration campaigns (see fig. 1) are difficult to organize be-cause they require interrupting the traffic.
∗Note that Arzviller is better known for itsinclined plane, located at the eastern side of the tunnel, which, since 1969, lifts boats on a 44.5 m high climb, replacing a ladder of 17 locks.
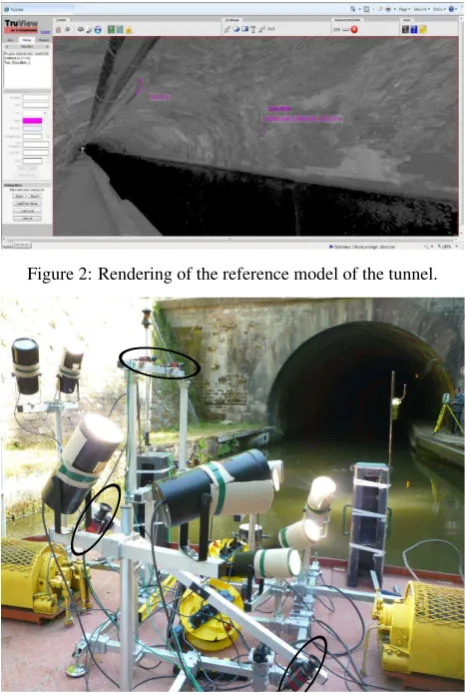
Figure 2: Rendering of the reference model of the tunnel.
Figure 3: The inspection barge with the modular frame support-ing cameras and projectors entersupport-ing Niderviller’s canal tunnel. Black ellipses indicate the positions of cameras.
3.2 Construction of a reference model of the tunnel
Prior to our experimentation, a set of carefully georeferenced points was implemented (in RGF 93 and NGF-IGN 69 coordi-nates) outside and inside the tunnel, using conventional survey-ing methods. The precision of the planimetric survey was about 1 cm and the altimetric closure was 3 mm. Then, several additional equipments such as targets, spheres, and visual marks were also placed inside the tunnel. Note that a set of plate, placed every decameter on the sidewall along the bench, was already present, showing the distance from the beginning of the tunnel. Finally, a static 3D surveying of the tunnel was performed using a LEICA C10 laser scanner, which provided a reference point cloud for further precision assessments. More precisely, 15 stations were performed along the ledge of the tunnel (i.e. approximately one every 30 m). These high density scans were co-registered using dedicated software, resulting in about 1.5 billion points. The re-sulting accuracy (difference in position between traditional geo-referencing and the 3D model) over 100 control points is less than 1.7 cm. The reader is referred to (Charbonnieret al., 2013), in the same archive, for further details. A rendering of the model using LEICA’s TruView software is shown on fig. 2.
3.3 Recording prototype
Side-looking cameras
Panoramic rig
Side-looking cameras
Stereo rig
Side-looking cameras
Stereo rig
Side-looking cameras
Stereo rig
Figure 4: Schematic view of the tunnel and the barge featuring the camera configurations. Top left: panoramic, top right: stereo (0◦) , bottom left: stereo (32◦) and bottom right: stereo (
−32◦).
the barge. Vertical tubes are fixed on the frame, to support pro-jectors and cameras, as can be seen on fig. 3. Note that a careful static geometric survey of the frame was performed, to determine the transformations between the barge and the different elements of the prototype, to make location tasks easier.
Several kinds of projectors were first tested in laboratory. Metal-halide lamps with electronic ballast were chosen for their good performance, relatively low electrical consumption and low price. In the tunnel, 10 projectors are used. Their orientations are first arranged in laboratory, but thanks to the modularity of our struc-ture, they can be adjusted on-site to make illumination as uniform as possible.
To record images, we take commercial high-resolution industrial cameras, namely Pike F210C (1920×1080pixels) and Marlin
F145C (1392×1040pixels), from Allied Vision Tech (AVT). More specifically, we use a pair of each model, in the following way: the Marlin cameras are placed on the left side of the boat, facing the right side wall. They are fixed on a bar, as parallel to each other as possible, to form a stereo rig.The advantage of considering a stereo device is that 3D measurements are possible, once the system is calibrated (Szeliski, 2010). The Pike cameras can be arranged either to form a stereo rig or to form a panoramic rig directed towards the vault. The axis of the stereo rig can be oriented along 3 angles with respect to the vertical (−32◦, 0◦ and32◦) and the aperture angle is about75◦, so 3 passes are necessary to acquire images of the whole vault. In panoramic configuration, the aperture angle is nearly145◦, so a single pass is sufficient, but 3D measurements are not possible. The camera configurations are summarized on fig. 4.
Synchronism is a keypoint for stereovision, whose principle relies on finding corresponding points in both views of the same scene. It is also interesting to synchronize both pairs of cameras to obtain complementary views (of the vault and side wall). To this aim, we use an external trigger device, that generate pulses at regular time intervals. Note that, contrary to railway or road tunnels, it is not possible here to trigger the acquisitions by distance, since no reliable odometric sensor is directly available.
Finally, since the images are taken from a moving barge, they may suffer from motion blur. In order to avoid this effect, one has to adapt the exposure time and the aperture of the diaphragm.
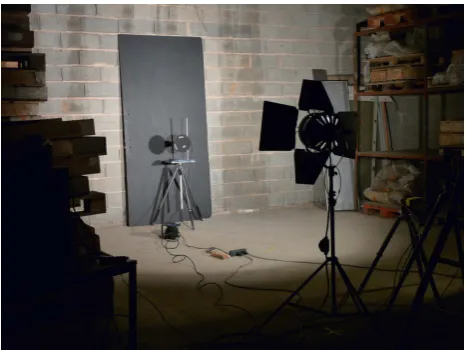
Figure 5: Setting up electronic and optical parameters in lab, us-ing a rotatus-ing disk under artificial illumination.
Of course, the fact that images are taken under artificial lighting enforces some constraints on this adjustment. Therefore, we per-formed a laboratory experiment (see fig. 5) which consisted in taking images of a rotating disk (with a speed close to1 m.s−1)
in the same illumination conditions as in the tunnel. The opti-cal and electronic parameters were then chosen to optimize the image quality.
4 LOCATION METHODS
Several positioning methods, with different capabilities, were test-ed by exploiting the recordtest-ed data off-line: simplifitest-ed visual odom-etry (using single camera or stereo rigs) to position the barge in curvilinear abscissa; photogrammetry, which provides both a 3D model of the structure and camera locations and orientations; in-ertial navigation and tacheometric tracking.
4.1 Trajectography
During our experiments, we tested two ways of measuring the tra-jectory of the barge. The first one relies on external means. More specifically, tacheometers were placed at the ends of the tunnel for tracking the barge, which was equipped with targets. For the first campaign, 3 reflector prisms were used, in order to obtain both position and orientation information. For the second one, a single prism was considered. Synchronization with the other de-vices was made using a reference timer for the first experiment, and using the speaking clock, for the second one.
We also tested an on-board solution: a commercial navigation system, which combines a differential GPS (Ashtech Proflex), an inertial navigation system (IXSEA Phins), and a Doppler log (RDI Explorer PA). GPS data is used to initialize a Kalman filter that integrates inertial and Doppler data.
4.2 Simplified visual odometry (SVO)
As explained in section 2, there are several ways of computing the successive positions of the imaging system from an image sequence. Under some simplifying assumptions about the motion of the boat, its curvilinear abscissa can be obtained from images of the side walls in a more or less automatic way.
Interactive SVO The simplest procedure implies user
L R L R
Figure 6: Automatic simplified visual odometry configuration. Solid lines: stereo rig at timet. Dashed lines: stereo rig at times t−1. The cameras are supposed to be parallel to the side wall.
measured beforehand. More precisely, the user points out all images were a decametric plate is the closest to a pre-defined landmark (typically the center of the image). Then, the interval between successive images is obtained as the ratio between the inter-plate distance and the number of images. This procedure is valid for single-camera image sequences, but stereovision can be used to correct the measure from the shift between the center of the plate and the center of the image.
Automatic SVO Stereovision can be exploited in a more
au-tomatic way. Once the stereo rig is calibrated, it is possible to rectify images, i.e. to transform them as if they were taken by similar, perfectly aligned cameras, see (Szeliski, 2010) for de-tails, and to correct them from geometric distorsion. In this con-figuration, it is well known that depth,Z, is an inverse function of the disparitydS, which is the apparent displacement between images of the scene:
Z=βbS dS
, (1)
whereβis a scale ratio andbSis the stereo base, i.e. the distance between cameras. Both parameters are estimated by calibration. Let us consider a pair of successive images taken by one camera of the stereo rig and assume that the motion of the boat is parallel to the base line of the imaging system. This defines a new stereo configuration, with unknown base distance,bM. Then, we have:
Z=βbM dM
, (2)
where the image motiondM can be seen as a disparity and the base distancebM is the motion of the system. Assuming thatZ remains constant while the barge moves, we obtain:
bM = dM
dS
bS, (3)
which means that the motion of the system (in meters) can be deduced from the displacement (in pixels) between left and right images of a stereo pair, and the displacement (also in pixels) be-tween successive left (or right) images. In practice,dM anddS are computed using phase correlation (Szeliski, 2010), which is fast and easy to implement.
4.3 Photogrammetric modeling
The most classical method in structure-from-motion is bundle ad-justment. To apply this technique, we consider the images of the right camera of the stereo rigs and we use a commercial soft-ware, namely PhotoModeler Scanner (PMS). The program first searches interest points in the images. Then it looks for corre-spondences between these points (homologous points). Finally, it estimates both the 3D structure of the scene, up to a scale fac-tor, and the successive positions and orientations of the cameras.
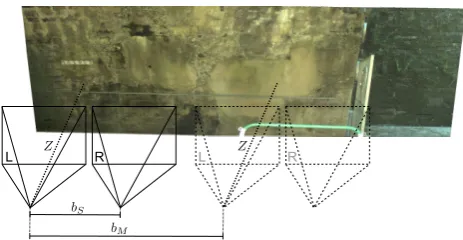
Figure 7: Example of measurement on a side wall using a stereo pair. The real distance between points on the bar-coded target is 42 cm. The measured distance is 41 cm.
Geo-referenced points can be used to remove scale ambiguity and to fix the geometry of the model. The reader is referred to (Char-bonnieret al., 2013) in the same archive for more details about the construction of the 3D model.
5 RESULTS AND DISCUSSION
5.1 Images
The feasibility study confirmed that recording images of the side walls and of the vault is not a real difficulty. Of course, special care must be taken to synchronization and to the quality of il-lumination. In our experiments, the barge was moving at about
1 m.s−1. We acquired images at a frame rate of 1 Hz and 5 Hz.
This results in a distance interval of approximately 1 m (resp. 20 cm) between successive acquisitions, which corresponds to an overlap of 75 % (resp. 95 %) between successive images. In our configuration, 3 passes were necessary to acquire images of the whole vault, but a single pass would be made possible by multi-plying the number of cameras.
Stereo images can be exploited using dedicated software to pro-vide 3D measurements (see e.g. fig. 7). Moreover, 3D models can be constructed from single-camera based image sequences, using PMS.
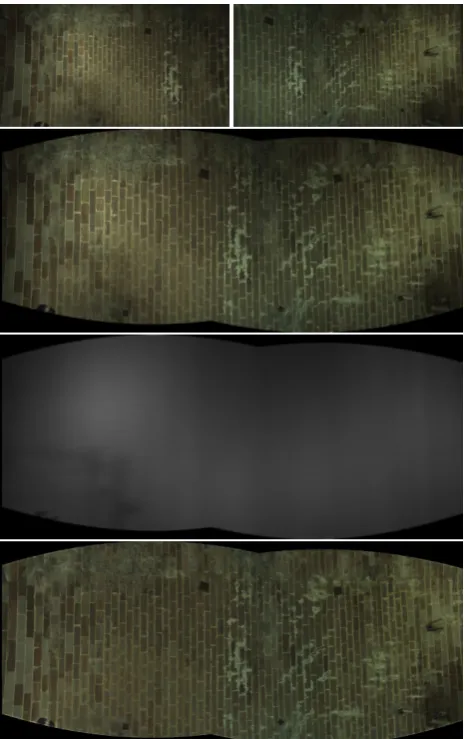
Figure 8: Example of panoramic image. From top to bottom: original images, combined image, “flat field” image exhibiting shadows and illumination variations, corrected panorama.
5.2 Location of the vision system
In this section, we analyze the pros and cons of each location method in light of our experiments. Comparisons mostly rely on the result of the second experiment, in which all 4 solutions were simultaneously tested. During this run, the boat followed a straight trajectory, excepted by the end of the tunnel, where it slowed down and was drifted towards the ledge by its own wave. This resulted in a loop in the planimetric trajectory and, also in altimetric perturbations.
Tacheometric tracking During the first experiment, 3 prisms
were mounted on the boat. We observed confusions that were probably due to the limited observation angles. In the second experiment, only one prism was used with 4 tacheometers. As can be seen on Fig. 9, the tracking is not perfect, which results in peaks in the inter-image distance graph. Such peaks might be smoothed out easily from the curve. Another problem we faced was synchronization with other devices: the internal clock of tacheometers is apparently not very accurate nor stable. Fi-nally, we found that the useful range of tacheometers is limited to about 300 m, which is consistent with observations of (M¨ulleret al., 2012). This means that using this solution in longer or curved tunnels would require multiplying the number of tacheometers, hence raising the difficulty of synchronization. These drawbacks are counterbalanced by a good altimetric precision: the altitude variations were less than 15 cm, with a maximum near the end of
the tunnel, where the trajectory of the boat was perturbed.
Inertial navigation The tested system is based on a Kalman
filter initialized by a GPS, whose signal was highly perturbed be-cause the canal is in a trench before the tunnel (see fig. 3). More-over, inside the tunnel, the inertial system strongly drifted (1 m in planimetry and 2 m in altimetry). However, it was possible to adjust the trajectory thanks to the loop near the end of the tunnel. After correction, the planimetric deviation with respect to PMS results (see below) was less than 8 cm and the altitude variations, less than 15 cm. This experiment shows that, although the sys-tem is appealing since it is autonomous, it requires a good initial-ization and periodic corrections of the drift using either external measurements, as in (M¨ulleret al., 2012) or manually pointed control points, as in (Boavidaet al., 2012).
Photogrammetry with PMS Image-based method are
inter-esting because they do not involve external devices. Moreover, structure from motion (implemented by PMS) provides both the trajectory of the imaging system and a 3D reconstruction of the tunnel. However, these methods are computationally demand-ing. For example, to compute a 3D model of the tunnel with a high performance PC, 9 sub-models had to be computed and assembled. Moreover, there are many possibilities in terms of pa-rameter setup, and some experience is needed. Finally, finding correspondances between views requires that images are suffi-ciently textured. Note that, due to error accumulation, the result-ing model was curved. To tackle this problem, several reference points had to be included in the computations. The accuracy of the resulting 3D model was first assessed by measuring the dis-tances between couples of points separated by 8 m each. The error was between -0.9 and 1.9 cm. Then, a global comparison of point clouds between the reference model and the model es-timated with PMS shown that differences were less than 5 cm (see (Charbonnieret al., 2013), this proceedings, for more de-tails). These rather good figures, however, concern the 3D model, not the trajectory. Assessing the precision of the trajectory itself is impossible since we have no reference. The method we use is consistent with the application: since the aim of visual inspection is to locate defects or equipments, we compare the coordinates of several points, pointed out by an operator in the reference (Laser) point cloud and in the PMS model. Over 9 such control points, the average difference is 2 cm, with a maximum of 11 cm.
Simplified VO The first two simplified odometry methods we
evaluated are interactive, see Sec. 4.2. To assess the accuracy of these techniques, we use the same method as for photogramme-try: 15 control points were pointed in the 3D model computed by PMS and 9 were selected in the reference lasergrammetric model. Their positions were also computed in single or stereo im-age sequences. The results are given in Tab. 1. Not surprisingly, the single-image based method is rather inaccurate. Introducing 3D corrections thanks to stereovision significatively reduces the mean and maximum differences.
SVO vs. PMS vs. Laser
method mean (m) max (m) mean (m) max (m)
Single 0.68 1.08 0.79 1.18
Stereo 0.17 0.34 0.13 0.36
Automatic 0.19 0.50 0.14 0.31
Table 1: Absolute differences between control points extracted from images, and pointed out in a reference model (Laser model or PMS model).
0,8
Figure 9: Inter-image distance (m) vs. curvilinear abscissa (m): comparison between tacheometric tracking and automatic simplified visual odometry.
from the PMS model, for 48 positions along the tunnel. The mean difference is 4.4 cm (with a maximum of 14.4 cm). For comparison, the mean is 6.2 cm for manual stereovision, with a maximum of 13.3 cm). We found that phase correlation works better with 95 % overlap than with 75 % overlap. The value of the correlation coefficient gives an indication about the quality of the image correspondance. Correlation failures result in outliers in the inter-image distance graph, which can be filtered out eas-ily, as was done for the plot shown on Fig. 9, where inter-image distances from automatic visual odometry are compared to inter-image distances obtained by projecting the speed vectors from tacheometric tracking onto the axis of the tunnel. As can be seen, the curves are rather similar. Incorporating a dynamic model of the boat in the estimation should provide smoother results. Fi-nally, the drift of the method was evaluated to 4.5 ‰ (i.e. 2.14 m over the tunnel). Using registration points in a post-processing step will tackle this problem. These promising results can be seen as a first step towards considering more complete motion models than translation.
6 CONCLUSIONS AND FUTURE WORK
In this paper, we have introduced a modular prototype dedicated to dynamic data acquisition in canal tunnels and reported the re-sults of preliminary tests that were performed in Niderviller’s tun-nel. Not surprisingly, they shown that synchronism is an impor-tant issue in a multiple-sensor context. Also, it appears that a minimal equipment of the tunnel is required since, whatever the method, landmarks or control points are required. Designing an image acquisition under artificial illumination system is not a dif-ficult issue. The experiments shown that it is better to consider relatively small distance interval between images. Locating the imaging system along the tunnel is a much more difficult prob-lem. Tacheometric tracking is limited by the range of these ap-paratus and the difficulty to synchronise them with other acquisi-tion devices. Inertial navigaacquisi-tion systems exhibit drifts, that may be corrected at the price of an accurate registration, which can-not be provided by GPS, but could be obtained from tacheometric measurements or control points. Finally, an interesting strategy to avoid combining different systems seems to exploit image data as much as possible. Photogrammetric techniques, such as bun-dle adjustment provide both a 3D model of the infrastructure as well as the position and orientation of cameras. However, they are very demanding in terms of user interaction, computational time and memory requirements. Visual odometry, which exploits motion contraints, is increasingly used in mobile-mapping and seems a promising way to make the procedure more accessi-ble. The results obtained here, with a simplified implementation, seem sufficient to reach a decimetric precision. Adapting more sophisticated methods to the particular geometry of canal tunnels, in order to increase the precision of the system will be addressed in a near future.
ACKNOWLEDGEMENTS
The authors would like to thank Voies Navigables de France and the Centre d’Etudes des Tunnels for funding this project. Many thanks, also, to the students of INSA de Strasbourg who con-tributed to the project, and to P.-Y. Scordia and B. Singer for pro-viding historical and statistical information.
REFERENCES
Agarwal, S., Furukawa, Y., Snavely, N., Simon, I., Curless, B., Seitz, S. and Szeliski, R., 2011. Building Rome in a day. Comm. ACM 54(10), pp. 105–112.
Boavida, J., Oliveira, A. and Santos, B., 2012. Precise long tunnel survey using the Riegl VMX-250 mobile laser scanning system. In: Riegl LiDAR 2012, Riegl, Orlando, Florida, USA.
Charbonnier, P., Chavant, P., Foucher, P., Muzet, V., Prybyla, D., Perrin, T., Grussenmeyer, P. and Guillemin, S., 2013. Accuracy assessment of a canal-tunnel 3D model by comparing photogram-metry and laserscanning recording techniques. In: XXIV Inter-national CIPA Symposium, Strasbourg.
Geiger, A., Ziegler, J. and Stiller, C., 2011. Stereoscan: Dense 3D reconstruction in real-time. In: IEEE Intelligent Vehicles Sym-posium (IV), pp. 963–968.
Grewal, M., Weill, L. and Andrews, A., 2007. Global Position-ing Systems, Inertial Navigation, and Integration. 2nd edn, John Wiley & Sons, Hoboken, NJ, USA.
Huerne de Pommeuse, M., 1822. Des canaux navigables con-sid´er´es d’une mani`ere g´en´erale. Bachelier et Huzard, Paris.
Kanzaki, T. and Yamaguchi, S., 2006. Current situation and issues concerning the maintenance and management of under-ground lifeline structures in Japan. - Evolving toward the in-troduction of information technology, automation and robotiza-tion. In: The 23rd International Symposium on Automation and Robotics in Construction 2006, Japan Society of Civil Engineers, Tokyo, Japan, pp. 293–298.
M¨uller, U., Kuhn, P. and Kadner, G., 2012. Potential savings in motion. World tunelling, (March 2012), pp. 25–27.
Scaramuzza, D. and Fraundorfer, F., 2011. Visual odometry - part I: The first 30 years and fundamentals. Robotics & Automation Magazine, IEEE 18(4), pp. 80–92.
Scaramuzza, D. and Fraundorfer, F., 2012. Visual odometry - part II: Matching, robustness, optimization, and applications. Robotics & Automation Magazine, IEEE 19(2), pp. 78–90.