ASSESMENT AND EVLUATION OF THE IMPACT OF USING POLSAR IMAGERIES
WITH DIFERENT INCIDENT ANGLES IN FOREST CLASSIFICATION
K. Ranjbar a, , Y. Maghsoudi a, M. R. Sahebi a
aKNT University of technology, Geomatics and Geodesy Faculty, Valiasr, Tehran, Iran - (kranjbar, ymaghsoudi, sahebi)@kntu.ac.ir
KEY WORDS: POLSAR, incident angle, Wishart Classification, Covariance matrix, Forest
ABSTRACT:
Forests are a dominant biome of the earth and have an important impact on its economic and environmental well-being. Forestry applications of radar remote sensing are addressed in the context of both forest management and ecosystem understanding, modelling and monitoring. Nowadays, radar remote sensing is being used for a lot of applications in various fields. Due to the applications of polarimetric radar in recent decades, many researchers have tended to this field. One of the main advantages of SAR images is that these images are independent over the time (day and night) and weather condition. The polarimetric SAR (POLSAR) images compared with other remote sensing images are more informative. Classification of radar images is a way by which we can separate different types of forest species. In addition to the main characteristics of the target, the backscatter from a SAR image is widely dependant on various radar system parameters. One of these system parameters is the incident angle of the radar system. In this paper, the impact of using PolSAR images with different incidence angles for the classification of forest areas is investigated. Two polSAR images with different incident angles taken by RADARSAT-2 in fine quad polarized mode (FQ4 and FQ18) have been used in this study. The study area is located in the Petawawa Research Forest (PRF) near Chalk River, Ontario, Canada The methodology of this paper contains three steps: 1) preprocessing, 2) wishart classification and 3) evaluating & analyzing the results. The preprocessing steps consist of the speckle noise filtering, covariance matrix extraction and georeferencing. In the second step, each incidence angle image was classified by using the supervised Wishart classification. The Wishart classification method has the capability of having multiple images at the same time. Thus, in the next experiment the classification was performed using both incidence angle images. Finally, the obtained results from each class and the classification results in each of three cases were evaluated and analyzed.
The results showed that Wishart classification provides an overall accuracy of %67.17 using the lower incidence angle PolSAR image and %65.38 for the higher incidence angle POLSAR image. Also, the overall accuracy of the simultaneous classification by using the extracted covariance matrix from both images is 72.63%. Those results showed a better performance of the image with lower incident angle compared to that of an image with higher incident angle for forest classification. It is also shown that combining extracted covariance matrix from the FQ4 image with extracted covariance matrix from the FQ18 image can significantly improve the classification accuracy (overall accuracy).
1. INTRODUCTION
Radar Polarimetery is an approach which offers a lot of choices in order to analysis and understanding of the forest characteristics (Lang, Townsend et al. 2008). The radar’s system multi-polarization (quad-pol.) is used to record the full polarization information, which in turn, is used to calculate the scattering matrix.
The surface scattering depends strongly on the incident angle i.e. the majority of back scattering occurs in low incident angles and increasing the incident angle leads to a decrease in back scattering(Scheuchl, Hajnsek et al.). On the other hand, this dependence upon the incident angle lowers down when the surface roughness increases. It is also worthy to mention that dependence upon incident angle increases for mediums with high dielectric constant (Henderson and Lewis 1998).
The forest’s canopy almost is considered as a volume scatterer.
This assumption results in less back scattering in low incident angles (Svendsen, Skriver et al. 1998). This dependence, even minor, introduces some problems in satellite and airborne imaging applications. In various incident angles, because of
polarization, canopy and ground’s back scattering power,
different back scattered fields from tree’s elements impinge on
radar(Carandall 1969; Chauhan, Lang et al. 1991).
According to the diverse applications of forests, to better resource management, it is necessary to gather information related to trees like type, age, biomass, and etc. Various approaches have been incorporated to attain this information from the original image.
Radar images classification is an approach which it is possible to determine the tree’s types. By taking into account that images with different incident angles provide us a lot of information about forests characteristics which this information are distinct, in this paper the classification of PolSAR images of a forestry with different incident angles is discussed.
2. METHODOLOGIES
2.1 Study area and data
The study site selected is the Petawawa Research Forest (PRF) located near Chalk River, Ontario (45◦57’ N, 77◦34’ W). It is approximately 200 km west of Ottawa and 180 km East of North Bay, Ontario, Canada. Two Radarsat-2 scenes were used: 16th September 2008 (FQ4) and 19th September 2008 (FQ18). The imaging modes were fine quad and were both ascending International Archives of the Photogrammetry, Remote Sensing and Spatial Information Sciences, Volume XL-1/W3, 2013
SMPR 2013, 5 – 8 October 2013, Tehran, Iran
passes. An image subset was selected for testing the classification algorithms. Figure 1 shows the false color image of the area (R: HH, G: VV, B: HV), which covers a forest area of approximately 22 × 22 km2. In order to evaluate the classification algorithms, a variety of different forest classes were considered in this study. These forests are being divided into two general categories: hardwood and softwood trees. Classes that have been evaluated in this research are aspen (A), poplar (Populus L.) (Po), white pine (Pinus strobus L.) (Pw), black spruce (Picea mariana (Mill) B.S.P) (Sb), ground vegetation (GV), building (B) and water (W), that aspen and poplar trees are components of hard wood and white pine and black spruce trees are components of soft wood.
Figure 1 Radarsat-2 polarimetric SAR data of PRF, Ontario (2200 × 2200 pixels, R: HH, G: VV, B: HV) Reference data was collected from forest inventory maps, aerial photographic interpretation, Landsat ETM+ images and field visits.
These referenced data are divided into two parts: training data and test data. Table 1 shows the number of the training data and test data for each class.
Table 1 training data and test data Name
SAR data pre-processing includes three stages of filtering, features extraction, and image geo-referencing. Theses stages are described in the following sections.
Filtering
Generally, SAR images are noisy in nature. Existence of speckle noise influences the information and features which are extracted from the image, significantly. Therefore, speckle noise reduction is one of the most important steps in using the PolSAR images.
To eliminate the noise effects in Polarimetery features, two scenarios are used. For incoherent parameters, at first the coherency matrix elements are speckle filtered. Then, the features are extracted from the coherency matrix. In the second scenario, for coherent parameters, features are extracted from unfiltered coherency matrix. In this paper, the BoxCar filter will be used.
Feature Extraction
Another pre-processing step which applies to images is Polarimetery feature extraction. In this research, covariance matrix extracted from each image.
Image Geo-Referencing
The next step in pre-processing is image geo-referencing. In order to referencing the extracted features, the geo-referenced RadarSat-1 image have been used.
2.3 Wishart classifier
The most important advantage of using covariance matrix is that its elements have Wishart distribution. Thereby, the classification can be applied to multiple images in different frequency bands, different times or in different incident angles, concurrently.
The Wishart classifier proposed by Lee (Lee, Grunes et al. 1994)was adopted in this study. It has been shown that the polarimetric covariance matrix Z may be described by a complex multivariate Wishart distribution. Let C= E(Z |ωm) be the mean covariance matrix for class ωm , based on the maximum likelihood classifier and the complex Wishart distribution, the Wishart distance measure was derived as dm = ln|Cm| + Tr (C m−1 Z)
The supervised classification rule becomes as follows: assign the pixel to class ωi i ∈ {1, 2, ・・・, k}, if
d(i)m ≤ d(j)m ∀ωj≠ωi
3. RESULTS
After carried out the steps that mentioned in the previous section, a series of results obtained for each of the scenarios are as follows:
In the case of Wishart classifier was applied on FQ18 image, the overall accuracy of 65.38%, respectively. Figure 2 shows the classification accuracy for each of the class.
Figure 2 classification accuracy for FQ18 image In the case of Wishart classifier was applied on FQ4 image, the overall accuracy of 67.17%. Figure 3 shows the classification accuracy for each of the class.
International Archives of the Photogrammetry, Remote Sensing and Spatial Information Sciences, Volume XL-1/W3, 2013 SMPR 2013, 5 – 8 October 2013, Tehran, Iran
Figure 3 classification accuracy for FQ4 image Also, the overall accuracy of the simultaneous classification by using the extracted covariance matrix from both images is 72.63%. Figure 3 shows the classification accuracy for each of the class.
Figure 4 classification accuracy for both images 4. CONCLUSION
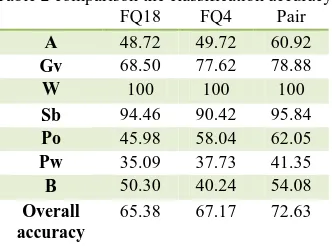
According to the table 2, the results showed a better performance of the image with lower incident angle compared to that of an image with higher incident angle for forest classification.
Table 2 comparison the classification accuracy
FQ18 FQ4 Pair
A 48.72 49.72 60.92
Gv 68.50 77.62 78.88
W 100 100 100
Sb 94.46 90.42 95.84
Po 45.98 58.04 62.05
Pw 35.09 37.73 41.35
B 50.30 40.24 54.08
Overall accuracy
65.38 67.17 72.63
It is also shown that combining extracted covariance matrix from the FQ4 image with extracted covariance matrix from the FQ18 image can significantly improve the classification accuracy (overall accuracy).
In Figure 5, the overall classification accuracy in all three cases is visually comparable, which can be easily found that, by using the images with different incident angles, the classification accuracy is improved
Figure 5 the overall classification accuracy in all three cases REFERENCES
Carandall, C. J. 1969. "Radar mapping in Panama." Photogrametric Engineering 35(6): 641-646. Chauhan, N. S., R. H. Lang, et al. 1991. "Radar modeling of
boreal forest." IEEE Transaction Geoscience and Remote Sensing 29(4): 627-638.
Henderson, F. M. and A. J. Lewis 1998. Principles and applications of imaging radar,manual of remote sensing, ASPRS.
Lang, M. W., P. A. Townsend, et al. 2008. "Influence of incidence angle on detecting flooded forests using C-HH synthetic aperture radar data." Remote Sensing of Environment.
Lee, J.-S., M. R. Grunes, et al. 1994. "Classification of multi-look polarimetric SAR imagery based on complex Wishart distribution." International Journal of Remote Sensing 15(11): 2299-2311.
Scheuchl, B., I. Hajnsek, et al. "Classification strategies for polarimetric SAR sea ice data."
Svendsen, M. T., H. Skriver, et al. 1998. "Investigation of Polarimetric SAR Data Acquired at Multiple Incidence Angles." IEEE Transaction Geoscience and Remote Sensing: 3.
International Archives of the Photogrammetry, Remote Sensing and Spatial Information Sciences, Volume XL-1/W3, 2013 SMPR 2013, 5 – 8 October 2013, Tehran, Iran