SOME ASPECTS IN HEIGHT MEASUREMENT BY UAV PHOTOGRAMMETRY
R. Matsuoka a, *, I. Nagusa b, H. Yasuhara b, M. Mori a, T. Katayama c, N. Yachi c, A. Hasui c, M. Katakuse c, T. Atagi d
a
Research and Development Division, Kokusai Kogyo Co., Ltd., Japan
{ryuji_matsuoka, masaru_mori}@kk-grp.jp
b
Geospatial Information Engineering Division, West Japan Department, Kokusai Kogyo Co., Ltd., Japan
{issei_nagusa, hirotaka_yasuhara}@kk-grp.jp
c
Civil Engineering Department, General Environmental Technos Co., Ltd., Japan
{katayama_tatsuo, yachi_nobuhisa, hasui_akinori, katakuse_maiko}@kanso.co.jp
dAsago Power System Center, Himeji Branch, Kansai Electric Power Co., Inc., Japan
[email protected]
Commission I, ICWG I/V
KEY WORDS: Analysis, Measurement, Orientation, Engineering, Experiment, UAV
ABSTRACT:
We conducted an experiment to investigate the feasibility of the deformation measurement of a large-scale solar power plant on reclaimed land by UAV photogrammetry. Two teams engaged in the experiment at first. One, which is called Team-A, carried out orientation of images following the procedure of conventional aerial photogrammetry. The other, which is called Team-C, executed that in the manner of close range photogrammetry. The RMSE in height measurement by Team-A was 121.5 mm, while that by Team-C was 8.7 mm. This paper reports an analysis conducted in order to investigate the cause of the large difference in height measurement accuracy between Team-A and Team-C. In the analysis the third team, which is called Team-S, conducts supplementary orientation by using the images utilized by Team-A in the same manner as Team-C did. The RMSE in height measurement by Team-S is 19.1 mm. Our investigation focuses on the difference of the arrangement of points utilized in the orientation. Team-A selected pass points and tie points on image automatically by Intergraph’s ImageStation Automatic Triangulation (ISAT) software, while Team-C and Team-S selected points to be utilized in orientation manually so that selected points are distributed uniformly in the experiment area. From the results of the analysis we conclude that the sets of tie points along a straight line on a plane that were selected automatically by the ISAT would bring the low accuracy in height measurement by Team-A.
1. INTRODUCTION
Various unmanned aerial vehicles (UAVs) have been utilized for photogrammetry (Eisenbeiss, 2011). The photogrammetric potential of an UAV has been recently evaluated in several studies (Gülch, 2011, Haala et al., 2011, Küng et al., 2011, Vallet et al., 2011, Rosnell and Honkavaara, 2012). These studies encouraged us to measure deformation of solar panels on land reclaimed from the sea with sufficient accuracy by UAV photogrammetry. The periodic deformation measurement of solar panels on reclaimed land requires that a root mean squares of errors (RMSE) in height measurement should be less than several centimeters.
Then we conducted an experiment to investigate the feasibility of the deformation measurement of solar panels on reclaimed land by UAV photogrammetry. It was required that a RMSE in height measurement should be less than 26 mm that is 1/3 of the critical limit 78 mm of deformation off the plane of a solar panel. Our previous paper (Matsuoka et al., 2012) reported the initial results of the experiment. Two teams engaged in the experiment at first. One carried out orientation of images following the procedure of conventional aerial photogrammetry, and the other executed that in the manner of close range photogrammetry. We name the former Team-A, while we name the latter Team-C. The RMSE of 220 check points in height
measurement by Team-A was 121.5 mm, while that by Team-C was 8.7 mm that satisfied the required accuracy.
Since the difference in height measurement accuracy between Team-A and Team-C was considerably large, we decided to conduct an analysis in order to investigate the cause of the large difference in measurement accuracy. This paper reports the results of the analysis. In the analysis the third team, which is called Team-S, conducted supplementary orientation by using the images utilized by Team-A in the same manner as Team-C did. The analysis focused on the comparison between Team-A and Team-S.
2. OUTLINE OF THE ANALYSIS
2.1 Target solar panels
The experiment was conducted in the 1/64 part of Sakai Solar Power Station of Kansai Electric Power Co., Inc. which consists of 113152 solar panels on reclaimed land with an area of 0.3 km2 on the coast of Osaka Bay. The experiment area was a rectangle 54 m wide (East–West) and 75 m long (North–South) and had 1762 solar panels of 52 columns (East–West) by 34 rows (North–South). Each solar panel was a rectangle 1.01 m wide and 1.36 m long. Figure 1 shows the target solar panels in the experiment area.
Figure 1. Target solar panels
Figure 2. A pair of stereo images
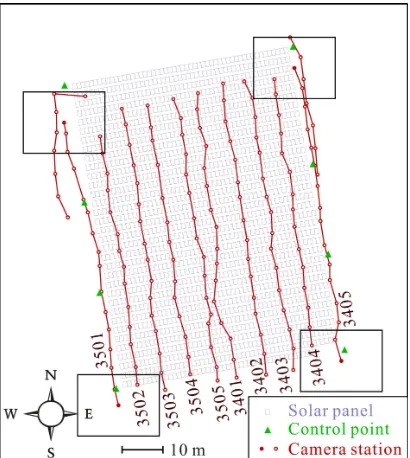
Figure 3. Camera stations of Team-A and Team-S Figure 4. Control points and check points
2.2 Image acquisition
We obtained images by a non-metric digital camera on board a microdrones md4-1000 quadrocopter, which is called md4-1000. The md4-1000 had a lens interchangeable digital camera Olympus PEN E-P2 with an Olympus M.ZUIKO DIGITAL 17 mm F 2.8 lens, which is called P2. The sensor size of the E-P2 is 17.3 mm by 13.0 mm and the number of recording pixels of the E-P2 is 4032 pixels by 3024 pixels. Accordingly the pixel size on the focal plane of the E-P2 is 4.3 m by 4.3 m.
Vertical image acquisition in the experiment was carried out similarly to that in an ordinary aerial survey by Team-A. The planned forward and side overlap ratios of the vertical image acquisition were 60 % and 60 % respectively. The planned flying height of the md4-1000 was 20 m above the ground level and the ground resolution of an image was approximately 5.0 mm by 5.0 mm.
Three flights were carried out in the experiment. The first flight consisting of five courses (#3401 – #3405) covered the east half of the experiment area, while the second flight consisting of five courses (#3501 – #3505) covered the west half of the experiment area. The third flight consisting of nine courses
(#4101 – #4109) covered the whole of the experiment area. Figure 2 shows a pair of stereo images acquired in the experiment.
Team-C utilized 126 images acquired in the third flight, while Team-A utilized 155 images acquired in the first and second flights and 15 images acquired in the third flight in order to apply two control points located at the northeast and northwest of the experiment area. Team-S utilized the same 170 images as Team-A did. Figure 3 show the camera stations of the images utilized by Team-A and Team-S.
2.3 Control points and check points
We placed eight control points around the experiment area. Measurement results by the UAV photogrammetry were evaluated by the space coordinates of 220 check points which were corner points of 55 solar panels selected from 1768 solar panels in the experiment area. The reference space coordinates of the check points were measured by a total station. The approximate accuracy of the measurement was expected to be 3 mm in height on the average. Figure 4 shows the arrangement of the eight control points and the 220 check points.
Figure 5. Points utilized in orientation by Team-A
Team A C S
Number of images 170 126 170
Number of control points 8 8 8
Number of orientation points 584 307 364 Number of points utilized in
orientation 592 315 372
Number of image points 2347 1896 2871 Average of numbers of image
points on an image 13.81 15.05 16.89
Average of numbers of bundles
of a control point 4.63 4.25 4.88
Average of numbers of bundles
of an orientation point 3.96 6.07 7.78
Table 1. Statistics of orientation of images
Team A C S
Number of check points 220 220 220
Number of image points 460 1228 2006 Average of numbers of bundles
of a check point 2.09 5.58 9.12
Table 2. Statistics of measurement of check points
Figure 6. Points utilized in orientation by Team- S
Team A C S
Image points (pixel) 0.52 0.74 0.92
Horizontal 0.7 2.0 2.9
Control points
(mm) Vertical 1.6 3.2 7.7
Horizontal 13.4 10.6 11.4 Check points
(mm) Vertical 121.5 8.7 19.1
Table 3. RMSEs on image and in space
2.4 Image distortion model
Since the E-P2 is a non-metric digital camera, it is necessary to estimate its image distortion model accurately when it is used for precise measurement. We adopted an image distortion model that consists of a principal distance, offsets from the principal point to the center of the image frame, radial and decentering distortion components. The image distortion model adopted in the experiment is widely used in close range photogrammetry (Luhmann, 2006).
Both Team-A and Team-C estimated the image distortion model of the E-P2 by self-calibration, while Team-S utilized the image distortion model estimated by Team-A.
2.5 Orientation and measurement
Team-A selected pass points and tie points on image automatically by Intergraph’s ImageStation Automatic Triangulation (ISAT) software which performs fully automated aerial triangulation. On the other hand, Team-C and Team-S selected points to be utilized in bundle adjustment manually without distinction between a pass point and a tie point so that selected points were distributed uniformly in the experiment area. Points except control points utilized in the bundle adjustment by Team-A, Team-C, and Team-S are called orientation points.
Team-A measured image coordinates of the orientation points automatically by the ISAT, while Team-C and Team-S measured those manually on each image.
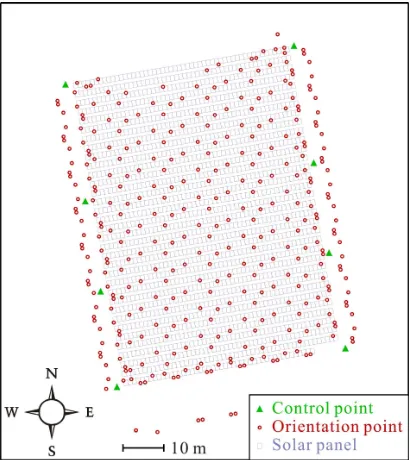
Figure 5 and Figure 6 show the points utilized in the orientation by Team-A and Team-S respectively. Table 1 and Table 2 show the statistics of the orientation of the images and the measurement of the check points respectively.
3. RESULTS AND DISCUSSION
Table 3 shows RMSEs obtained in the experiment. The RMSE of the 220 check points in the height measurement by Team-A was 121.5 mm, while that by Team-S was 19.1 mm that satisfied the required accuracy. From the results shown in Table 3 we concluded that the difference of the utilized images between Team-A and Team-C did not make the large difference International Archives of the Photogrammetry, Remote Sensing and Spatial Information Sciences, Volume XL-1/W2, 2013
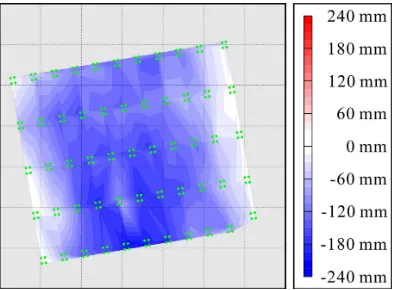
Figure 7. Errors in height measurement by Team-A Figure 8. Errors in height measurement by Team-S
Table 4. RMSs of standard deviations in orientation in height measurement accuracy between Team-A and Team-C.
We also concluded that the image distortion model estimated by Team-A did not bring the low accuracy in height measurement by Team-A because Team-S utilized the same image distortion model as Team-A did.
Figure 7 and Figure 8 show distributions of errors in the height measurement by Team-A and Team-S respectively. Figure 7 clearly indicates the existence of large systematic errors in the height measurement by Team-A. On the contrary, the errors in the height measurement by Team-S would be small enough.
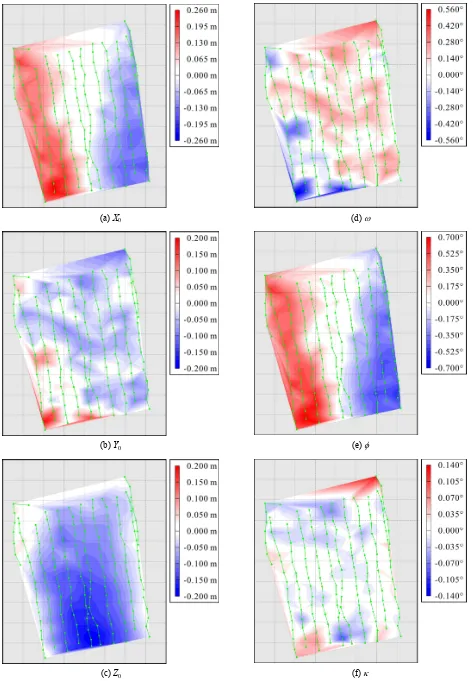
Figure 9 shows differences of estimated exterior orientation parameters (X0, Y0, Z0, , , ) between Team-A and Team-S. (a), (c), and (e) in Figure 9 clearly indicate the existence of systematic differences of the estimated X0, Z0, and . The distributions of the differences of the estimated X0, Z0, and resemble the distribution of the errors in the height measurement by Team-A. Accordingly we guessed that the incorrect X0, Z0, and estimated by Team-A would bring the low accuracy in height measurement by Team-A.
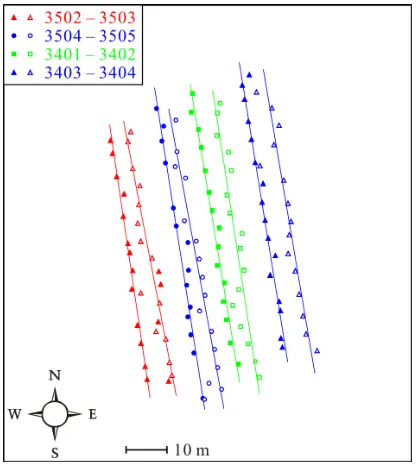
We suspected that the arrangement of tie points utilized in the orientation by Team-A brought the incorrect X0, Z0, estimates. The ISAT that was utilized by Team-A selected tie points extracted from automatically selected pass points. Figure 10 shows some of the tie points utilized by Team-A. Figure 10 indicates that most of the tie points may lie along straight lines.
It would be very easy for the ISAT to select pass points at corners of solar panels automatically and the ISAT picked tie points from the automatically selected pass points. Furthermore the solar panels were laid on a plane. Accordingly the selected tie points would be apt to lie along a straight line on a plane. Two sets of tie points along a straight line on a plane between two adjacent strips would make the arrangement of the strips be estimated uncertainly. Figure 11 shows 2-D schematic representation of the uncertain estimation of exterior orientation parameters. In Figure 11 the image points p1R and p1R have the same image coordinates, and the image points p2R and p2R have the same image coordinates. However, the position and attitude of the camera OR is different from that of the camera OR.
From the results of the analysis we concluded that the sets of tie points along a straight line on a plane that were selected automatically by the ISAT would bring the low accuracy in height measurement by Team-A.
We had better have placed at least one vertical control point in the central part of the experiment area in order to make sure of sufficient accuracy in height measurement by UAV photogrammetry. However, since the experiment was conducted not only to investigate the feasibility of UAV photogrammetry but also to compare the performance of UAV photogrammetry with that of TLS (terrestrial laser scanner) and MMS (mobile mapping system), we placed only eight control points around the experiment area.
From the results of the analysis we confirmed the conclusion of our previous paper (Matsuoka et al., 2012) that the deformation measurement of a large-scale solar power plant on reclaimed land by UAV photogrammetry would be feasible if points utilized in orientation of images have a sufficient number of bundles in good geometry.
There is a question about a possibility of our predicting the low accuracy in height measurement by Team-A. The RMSEs on image of the image points and the RMSEs in space of the control points shown in Table 3 had no significant differences between Team-A and Team-S.
Table 4 shows the RMSs of the standard deviations of the estimates of exterior orientation parameters (X0, Y0, Z0, , , ) and space coordinates (X, Y, Z) of orientation points in the orientation. The RMS of the standard deviations of Z0 seems to indicate the accuracy in height measurement, while the RMSs of the standard deviations of X0 and Y0 do not always indicate the accuracy in planimetric measurement. The RMS of the standard deviations of Z by Team-A was approximately twice as much as that by Team-S, while the RMSE of the height measurement of the check points by Team-A was approximately six times as much as that by Team-S.
(a) X0 (d)
(b) Y0 (e)
(c) Z0 (f)
Figure 9. Differences of estimated exterior orientation parameters between Team-A and Team-S
Figure 10. Tie points utilized by Team-A
Figure 11. Uncertain estimation of exterior orientation parameters
Consequently we reached the tentative conclusion that it would be impossible to predict the low accuracy in height measurement by Team-A.
4. CONCLUSION
From the results of the analysis we conclude that the sets of tie points along a straight line on a plane that were selected automatically by the ISAT would bring the low accuracy in height measurement by Team-A. Moreover we reached the tentative conclusion that it would be impossible to predict the low accuracy in height measurement by Team-A.
We also confirmed the conclusion of our previous paper (Matsuoka et al., 2012) that the deformation measurement of a large-scale solar power plant on reclaimed land by UAV photogrammetry would be feasible if points utilized in orientation have a sufficient number of bundles in good geometry.
ACKNOWLEDGEMENTS
The authors are grateful to Sakai Solar Power Station of Kansai Electric Power Co., Inc. for assistance in the experiment.
REFERENCES
Eisenbeiss, H., 2011. The Potential of Unmanned Aerial Vehicles for Mapping, Photogrammetrische Woche 2011, Dieter Fritsch (Ed.), Wichmann Verlag, Heidelberg, pp. 135– 145.
Gülch, E., 2011. Photogrammetric Evaluation of Multi-Temporal Fixed Wing UAV Imagery, Proceedings of the International Conference on Unmanned Aerial Vehicle in Geomatics (UAV-g), The International Archives of the Photogrammetry, Remote Sensing and Spatial Information Sciences, Zurich, Switzerland, XXXVIII-1/C22.
Haala, N., Cramer, M., Weimer, F., Trittler, M., 2011. Performance Test on UAV-Based Photogrammetric Data Collection, Proceedings of the International Conference on Unmanned Aerial Vehicle in Geomatics (UAV-g), The International Archives of the Photogrammetry, Remote Sensing and Spatial Information Sciences, Zurich, Switzerland, XXXVIII-1/C22.
Küng, O., Strecha, C., Beyeler, A., Zufferey, J.-C., Floreano, D., Fua, P., Gervaix, F., 2011. The Accuracy of Automatic Photogrammetric Techniques on Ultra-Light UAV Imagery , Proceedings of the International Conference on Unmanned Aerial Vehicle in Geomatics (UAV-g), The International Archives of the Photogrammetry, Remote Sensing and Spatial Information Sciences, Zurich, Switzerland, XXXVIII-1/C22.
Luhmann, T., Robson, S., Kyle, S., Harley, I., 2006. Close Range Photogrammetry, Whittles Publishing, Caithness, pp. 114–122.
Matsuoka, R., Nagusa, I., Yasuhara, H., Mori, M., Katayama, T., Yachi, N., Hasui, A., Katakuse, M. Atagi, T., 2012. Measurement of Large-Scale Solar Power Plant by Using Images Acquired by Non-Metric Digital Camera on Board UAV, The International Archives of the Photogrammetry, Remote Sensing and Spatial Information Sciences, Melbourne, Australia, Vol. XXXIX, Part B1, pp. 435-440.
Rosnell, T., Honkavaara, E., 2012. Point Cloud Generation from Aerial Image Data Acquired by a Quadrocopter Type Micro Unmanned Aerial Vehicle and a Digital Still Camera,
Sensors, Vol. 12, Issue 1, pp. 453–480
Vallet, J., Panissod, F., Strecha, C., Tracol, M., 2011. Photogrammetric Performance of an Ultra Light Weight Swinglet “UAV”, Proceedings of the International Conference on Unmanned Aerial Vehicle in Geomatics (UAV-g), The International Archives of the Photogrammetry, Remote Sensing and Spatial Information Sciences, Zurich, Switzerland, XXXVIII-1/C22.